| Param | Original file | Final file |
|---|---|---|
| Filename | modeM0/AS1T03_075T01_9000002660_17894cztM0_level2.evt | modeM0/AS1T03_075T01_9000002660_17894cztM0_level2_quad_clean.evt |
| Size (bytes) | 543,553,920 | 106,695,360 |
| Size | 518.4 MB | 101.8 MB |
| Events in quadrant A | 3,798,612 | 671,866 |
| Events in quadrant B | 3,957,953 | 688,802 |
| Events in quadrant C | 4,098,120 | 664,090 |
| Events in quadrant D | 4,060,406 | 646,970 |
| Mode M9 | |||
|---|---|---|---|
| Quadrant | BADHDUFLAG | Total packets | Discarded packets |
| A | 0 | 11 | 0 |
| B | 0 | 11 | 0 |
| C | 0 | 11 | 0 |
| D | 0 | 11 | 0 |
| Mode SS | |||
|---|---|---|---|
| Quadrant | BADHDUFLAG | Total packets | Discarded packets |
| A | 0 | 166 | 0 |
| B | 0 | 166 | 0 |
| C | 0 | 166 | 0 |
| D | 0 | 166 | 0 |
| Mode M0 | |||
|---|---|---|---|
| Quadrant | BADHDUFLAG | Total packets | Discarded packets |
| A | 0 | 16836 | 2 |
| B | 0 | 17139 | 2 |
| C | 0 | 17526 | 2 |
| D | 0 | 17776 | 2 |
| Quadrant | Total seconds | Saturated seconds | Saturation percentage |
|---|---|---|---|
| A | 8042 | 129 | 1.604079% |
| B | 8043 | 189 | 2.349869% |
| C | 8043 | 199 | 2.474201% |
| D | 8043 | 98 | 1.218451% |
Noise dominated data is calculated using 1-second bins in cleaned event files. If a bin has >2000 counts, and if more than 50% of those come from <1% of pixels, then it is considered to be noise-dominated and hence unusable.
| Quadrant | # 1 sec bins | Bins with >0 counts | Bins with >2000 counts | High rate bins dominated by noise | Noise dominated (total time) | Noise dominated (detector-on time) | Marked lightcurve |
|---|---|---|---|---|---|---|---|
| A | 9202 | 8044 | 0 | 0 | 0.00% | 0.00% | 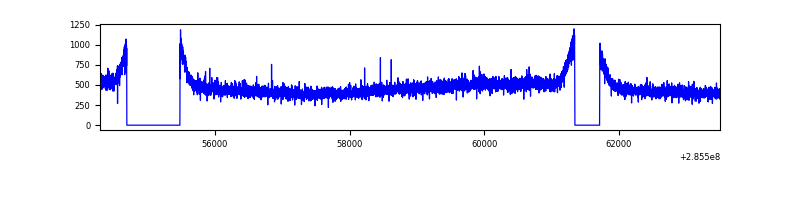 |
| B | 9203 | 8045 | 1 | 1 | 0.01% | 0.01% | 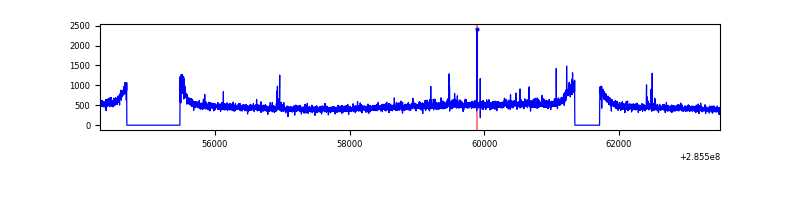 |
| C | 9203 | 8045 | 0 | 0 | 0.00% | 0.00% | 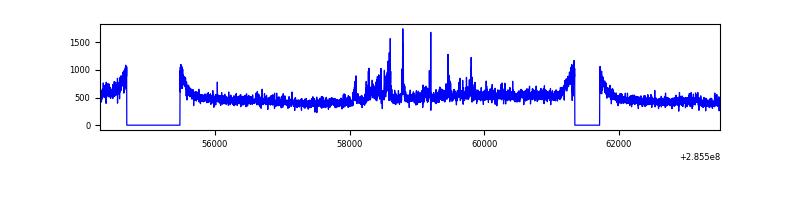 |
| D | 9203 | 8045 | 15 | 15 | 0.16% | 0.19% | 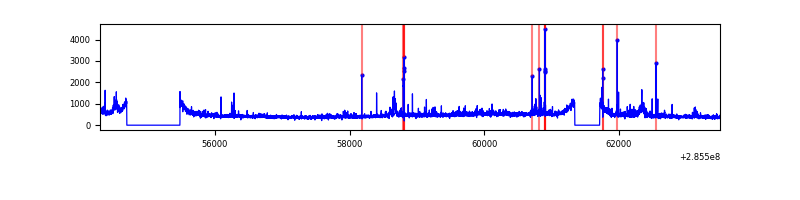 |
Top three noisy pixels from each quadrant. If the there are fewer than three noisy pixels in the level2.evt file, extra rows are filled as -1
| Pixel properties | Quadrant properties | ||||||
|---|---|---|---|---|---|---|---|
| Quadrant | DetID | PixID | Counts | Sigma | Mean | Median | Sigma |
| A | 0 | 226 | 8455 | 37.11 | 987 | 966 | 201.8 |
| A | 3 | 137 | 7832 | 34.02 | 987 | 966 | 201.8 |
| A | 12 | 194 | 7015 | 29.97 | 987 | 966 | 201.8 |
| B | 15 | 222 | 25839 | 128.86 | 990 | 966 | 193.0 |
| B | 12 | 111 | 23550 | 117.0 | 990 | 966 | 193.0 |
| B | 11 | 111 | 20634 | 101.89 | 990 | 966 | 193.0 |
| C | 3 | 233 | 238181 | 1048.03 | 952 | 957 | 226.4 |
| C | 14 | 238 | 146861 | 644.59 | 952 | 957 | 226.4 |
| C | 13 | 61 | 6720 | 25.46 | 952 | 957 | 226.4 |
| D | 12 | 110 | 101183 | 425.0 | 958 | 930 | 235.9 |
| D | 13 | 168 | 84159 | 352.83 | 958 | 930 | 235.9 |
| D | 1 | 52 | 62802 | 262.3 | 958 | 930 | 235.9 |
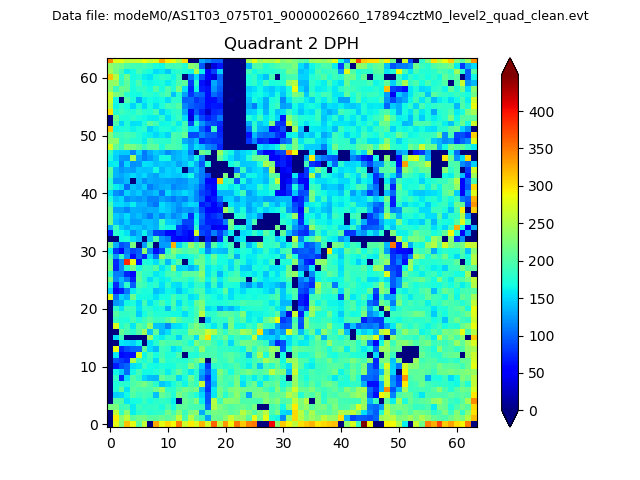
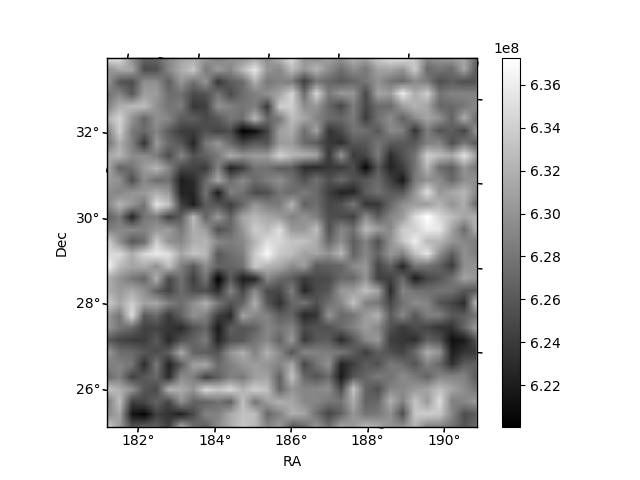
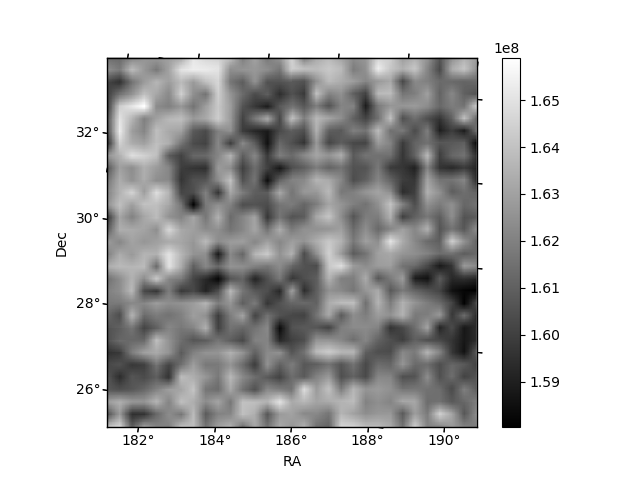
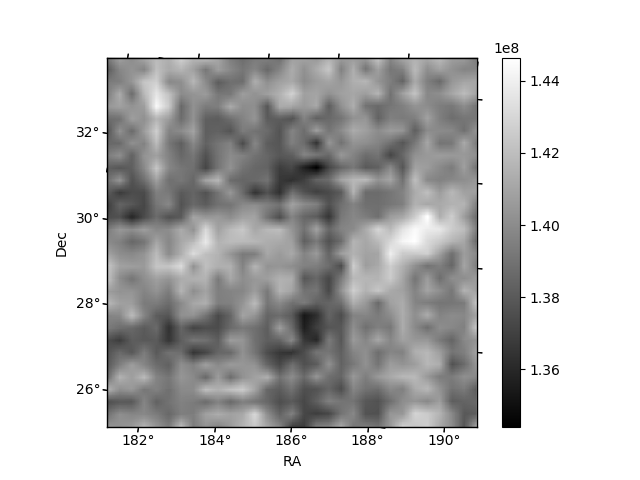
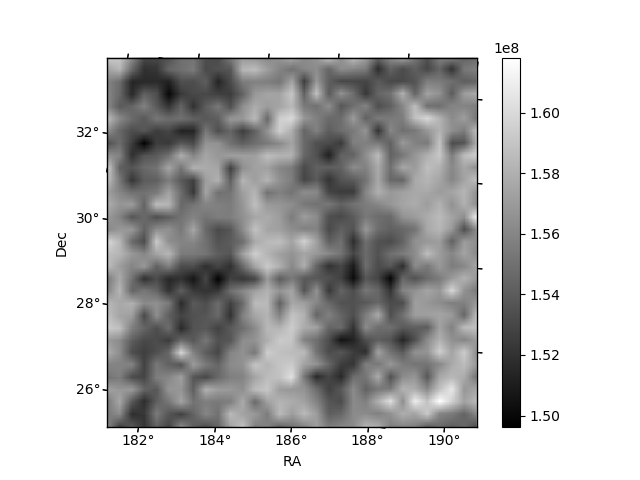
Histogram calculated using DETX and DETY for each event in the final _common_clean file
| Quadrant A | 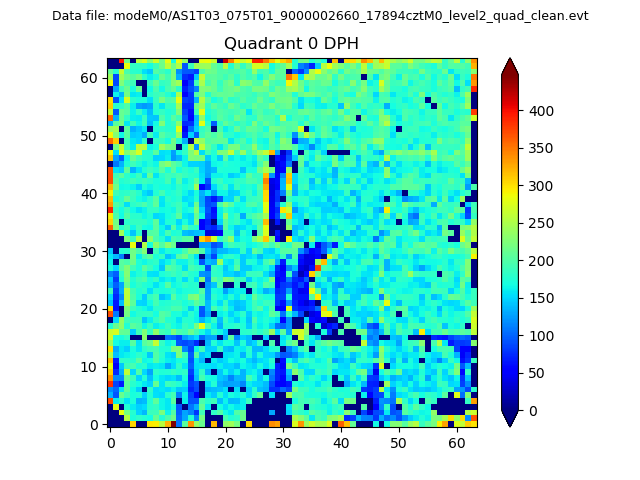 |
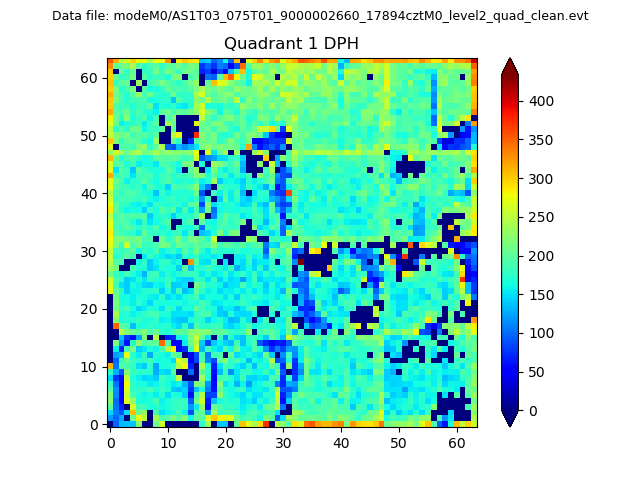 |
Quadrant B |
|---|---|---|---|
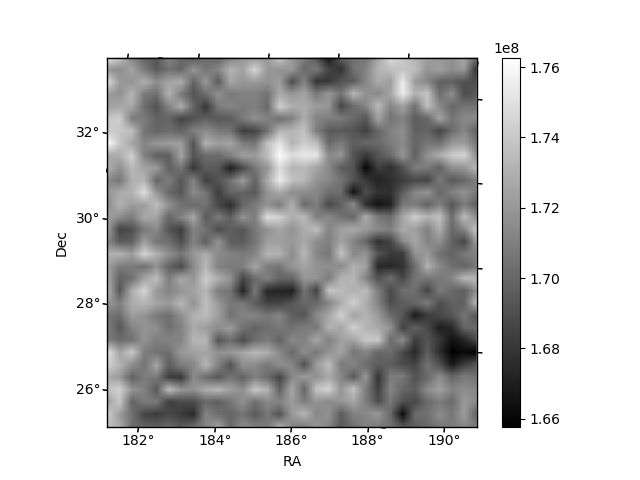
| Quadrant D | 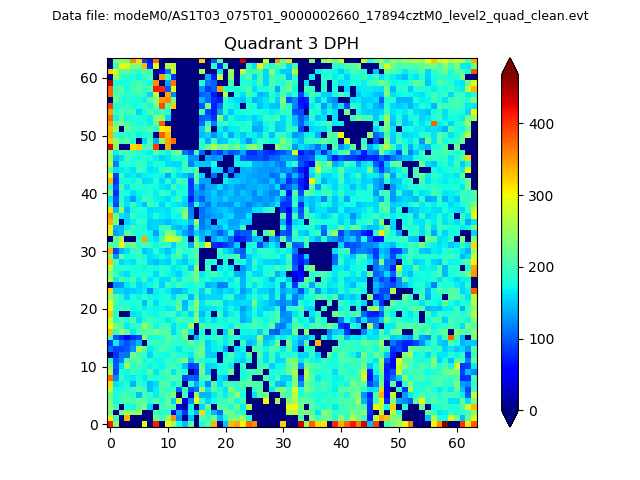 |
 |
Quadrant C |
| Plot type | Count rate plots | Images |
|---|---|---|
| Comparison with Poisson distribution Blue bars denote a histogram of data divided into 1 sec bins. Red curve is a Poisson curve with rate = median count rate of data. |
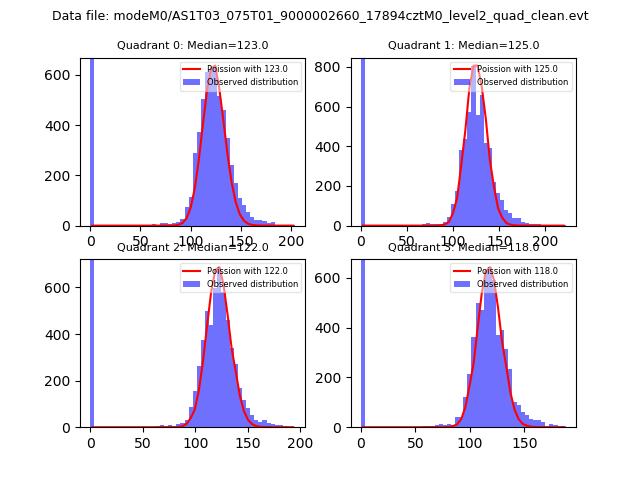 |
 |
| Quadrant-wise count rates Data is divided into 100 sec bins |
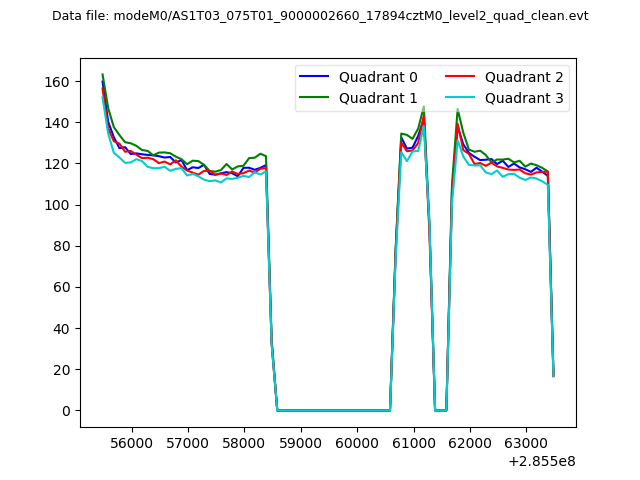 |
|
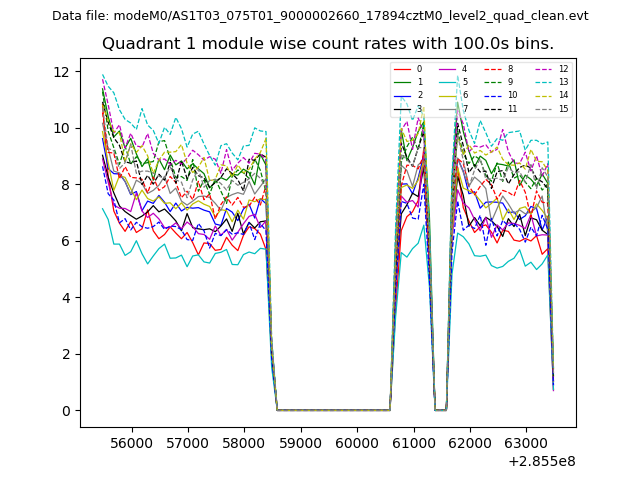
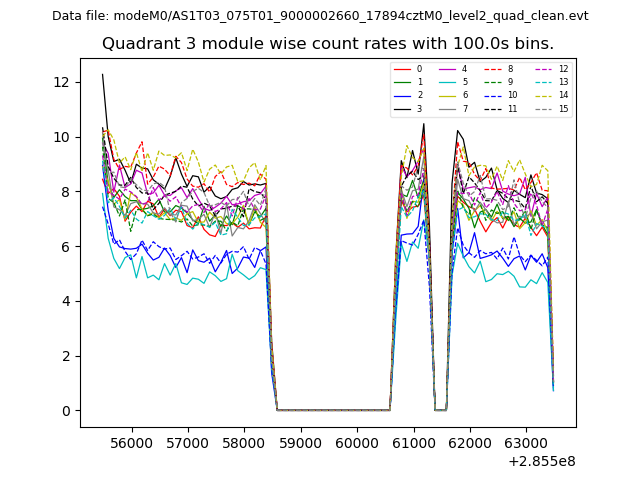
| Module-wise count rates for Quadrant A Data is divided into 100 sec bins |
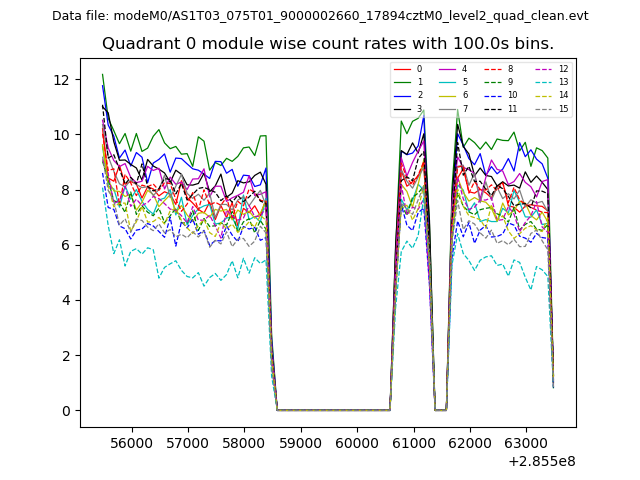 |
 |
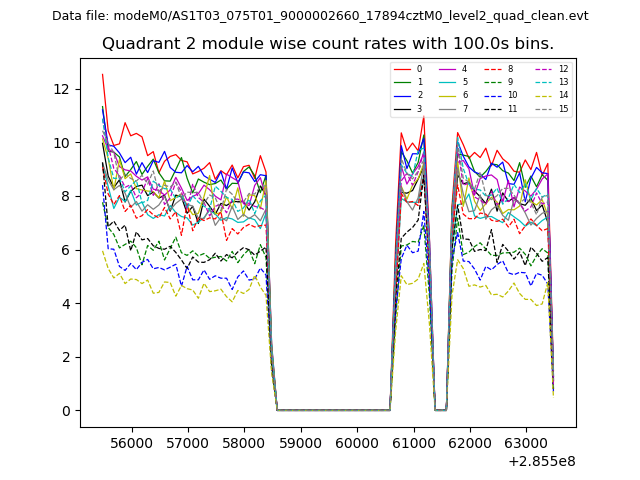
| Module-wise count rates for Quadrant B Data is divided into 100 sec bins |
 |
 |
| Module-wise count rates for Quadrant C Data is divided into 100 sec bins |
 |
 |
| Module-wise count rates for Quadrant D Data is divided into 100 sec bins |
 |
 |
| Parameter | Plot |
|---|---|
| CZT HV Monitor | 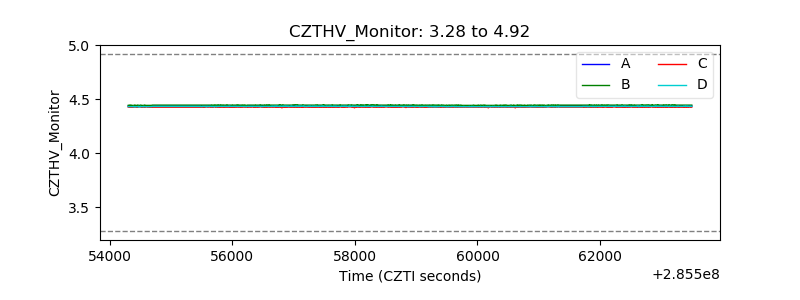 |
| D_VDD | 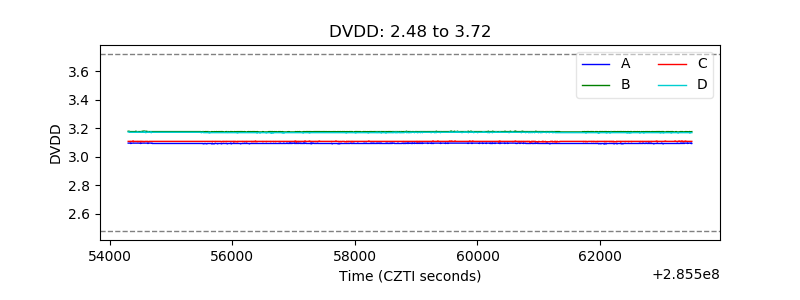 |
| Temperature 1 | 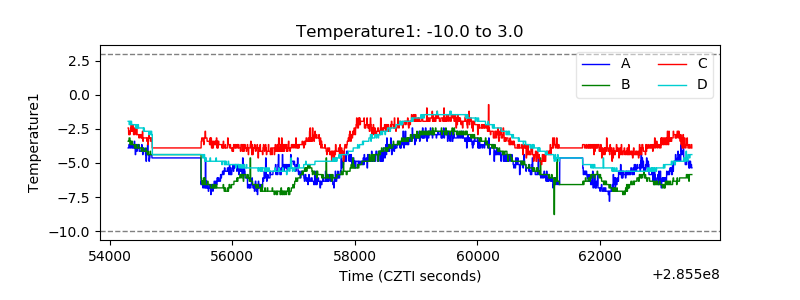 |
| Veto HV Monitor |  |
| Veto LLD | 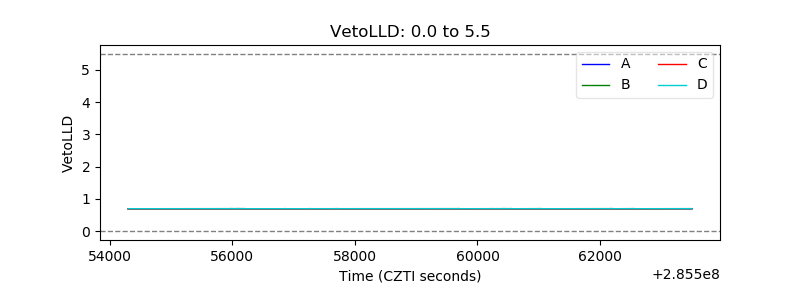 |
| Alpha Counter | 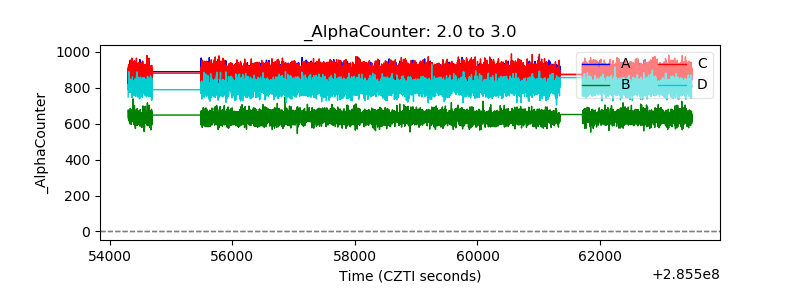 |
| _CPM_Rate | 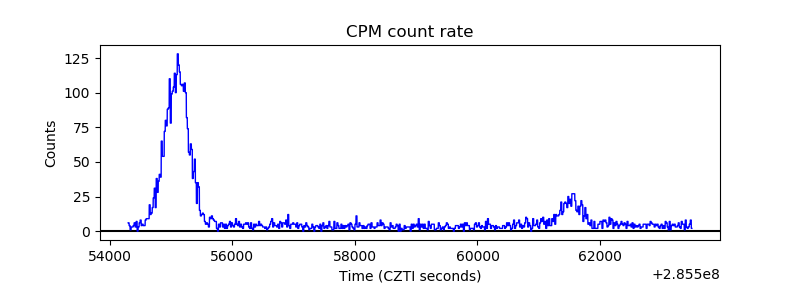 |
| CZT Counter | 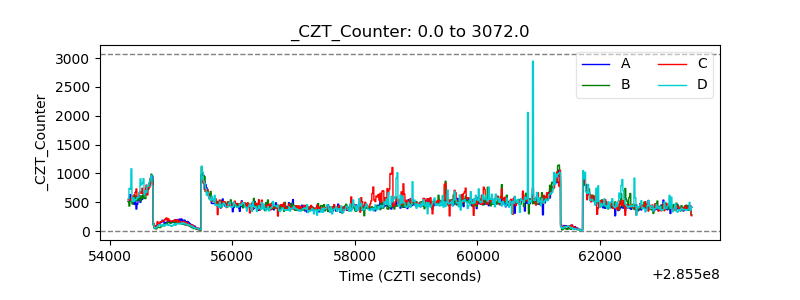 |
| +2.5 Volts monitor |  |
| +5 Volts monitor | 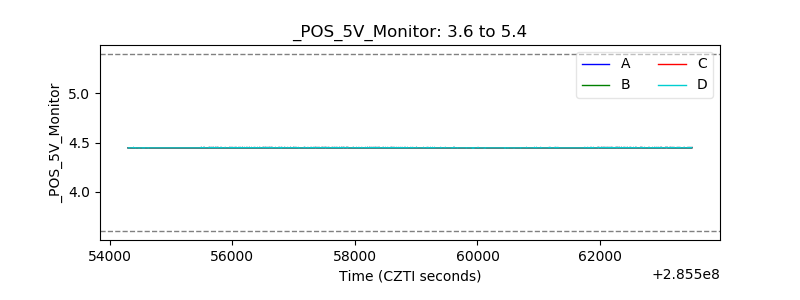 |
| _ROLL_ROT | 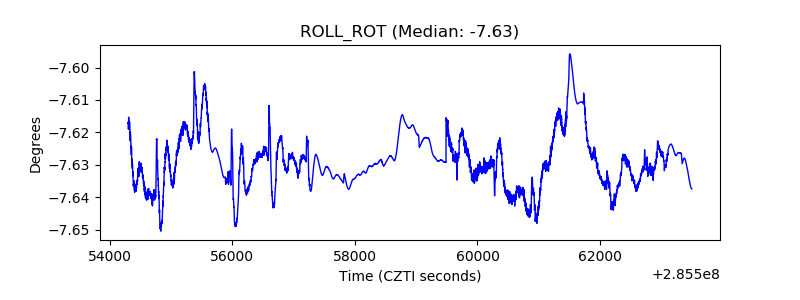 |
| _Roll_DEC | 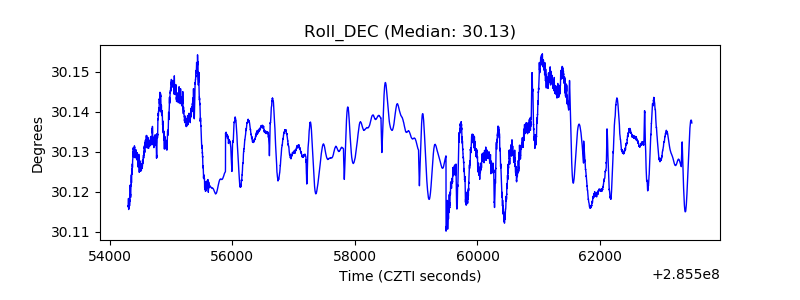 |
| _Roll_RA | 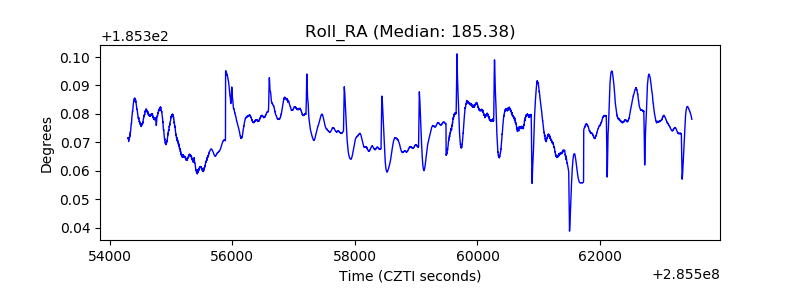 |
| Veto Counter | 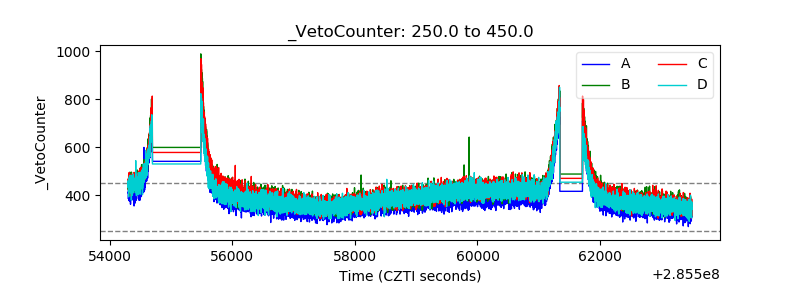 |