| Param | Original file | Final file |
|---|---|---|
| Filename | modeM0/AS1T03_075T01_9000002660_17895cztM0_level2.evt | modeM0/AS1T03_075T01_9000002660_17895cztM0_level2_quad_clean.evt |
| Size (bytes) | 506,427,840 | 106,044,480 |
| Size | 483.0 MB | 101.1 MB |
| Events in quadrant A | 3,574,396 | 669,847 |
| Events in quadrant B | 3,743,534 | 689,635 |
| Events in quadrant C | 3,685,501 | 664,499 |
| Events in quadrant D | 3,808,668 | 649,886 |
| Mode SS | |||
|---|---|---|---|
| Quadrant | BADHDUFLAG | Total packets | Discarded packets |
| A | 0 | 154 | 0 |
| B | 0 | 154 | 0 |
| C | 0 | 154 | 0 |
| D | 0 | 154 | 0 |
| Mode M0 | |||
|---|---|---|---|
| Quadrant | BADHDUFLAG | Total packets | Discarded packets |
| A | 0 | 16003 | 2 |
| B | 0 | 16328 | 3 |
| C | 0 | 16137 | 2 |
| D | 0 | 16714 | 2 |
| Quadrant | Total seconds | Saturated seconds | Saturation percentage |
|---|---|---|---|
| A | 7727 | 207 | 2.678918% |
| B | 7727 | 228 | 2.950692% |
| C | 7727 | 206 | 2.665976% |
| D | 7727 | 160 | 2.070661% |
Noise dominated data is calculated using 1-second bins in cleaned event files. If a bin has >2000 counts, and if more than 50% of those come from <1% of pixels, then it is considered to be noise-dominated and hence unusable.
| Quadrant | # 1 sec bins | Bins with >0 counts | Bins with >2000 counts | High rate bins dominated by noise | Noise dominated (total time) | Noise dominated (detector-on time) | Marked lightcurve |
|---|---|---|---|---|---|---|---|
| A | 7767 | 7729 | 0 | 0 | 0.00% | 0.00% |  |
| B | 7767 | 7729 | 0 | 0 | 0.00% | 0.00% | 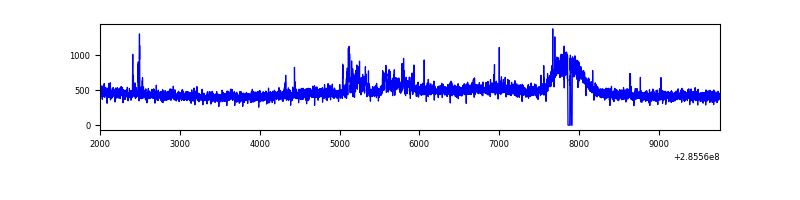 |
| C | 7767 | 7729 | 0 | 0 | 0.00% | 0.00% | 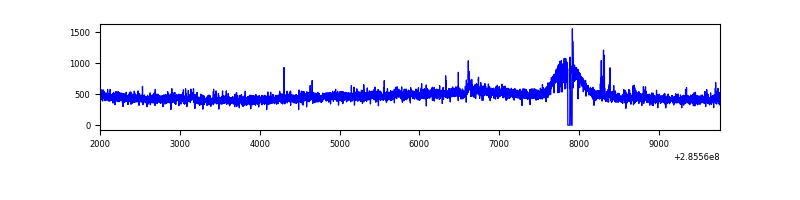 |
| D | 7767 | 7729 | 21 | 21 | 0.27% | 0.27% | 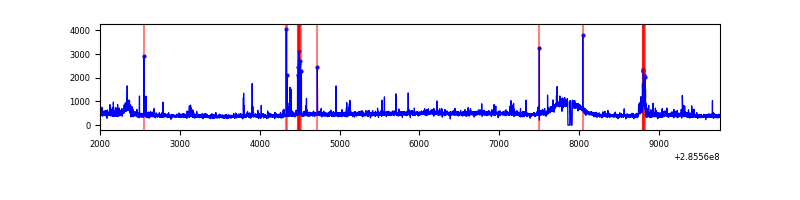 |
Top three noisy pixels from each quadrant. If the there are fewer than three noisy pixels in the level2.evt file, extra rows are filled as -1
| Pixel properties | Quadrant properties | ||||||
|---|---|---|---|---|---|---|---|
| Quadrant | DetID | PixID | Counts | Sigma | Mean | Median | Sigma |
| A | 15 | 174 | 23171 | 118.32 | 924 | 902 | 188.2 |
| A | 0 | 226 | 8024 | 37.84 | 924 | 902 | 188.2 |
| A | 3 | 137 | 7440 | 34.74 | 924 | 902 | 188.2 |
| B | 0 | 183 | 56243 | 307.62 | 924 | 898 | 179.9 |
| B | 12 | 111 | 22236 | 118.6 | 924 | 898 | 179.9 |
| B | 15 | 222 | 21195 | 112.82 | 924 | 898 | 179.9 |
| C | 14 | 238 | 134150 | 631.73 | 888 | 892 | 210.9 |
| C | 3 | 233 | 83647 | 392.31 | 888 | 892 | 210.9 |
| C | 13 | 61 | 6218 | 25.25 | 888 | 892 | 210.9 |
| D | 12 | 110 | 163080 | 729.16 | 903 | 876 | 222.5 |
| D | 9 | 64 | 60229 | 266.81 | 903 | 876 | 222.5 |
| D | 7 | 96 | 57421 | 254.19 | 903 | 876 | 222.5 |
Histogram calculated using DETX and DETY for each event in the final _common_clean file
| Quadrant A | 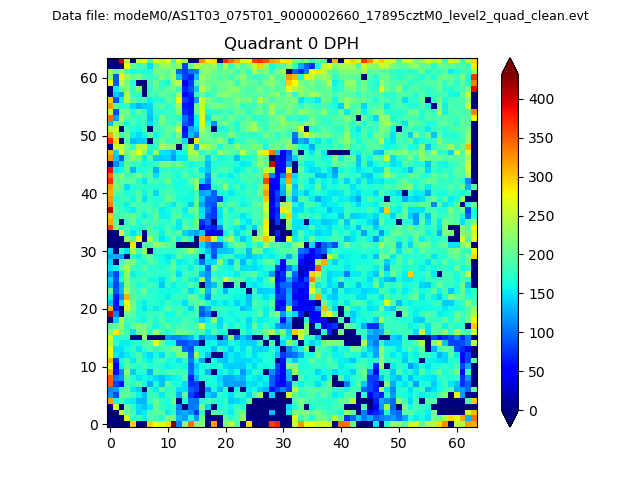 |
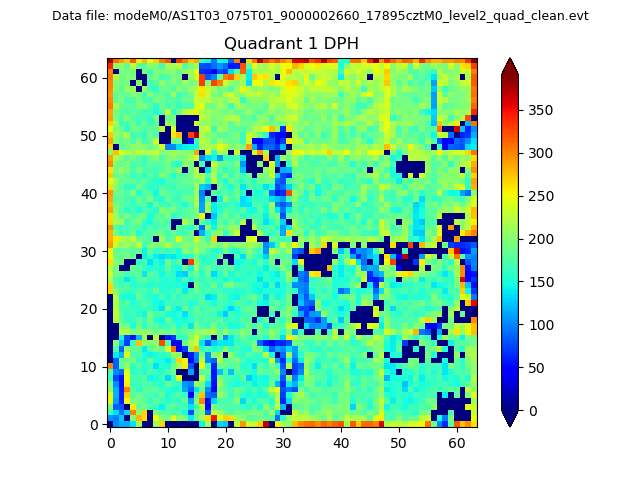 |
Quadrant B |
|---|---|---|---|
| Quadrant D | 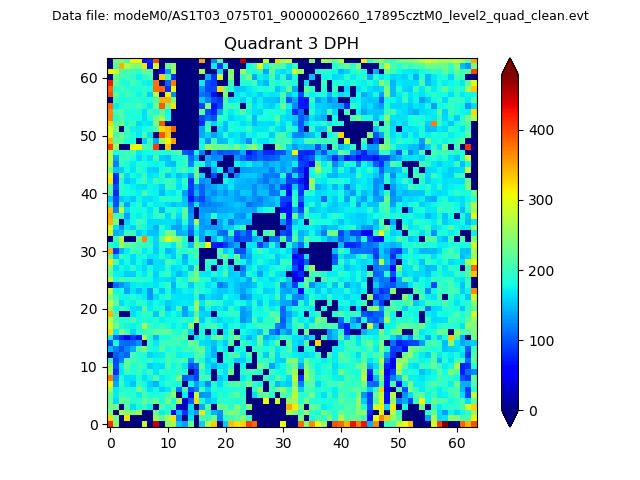 |
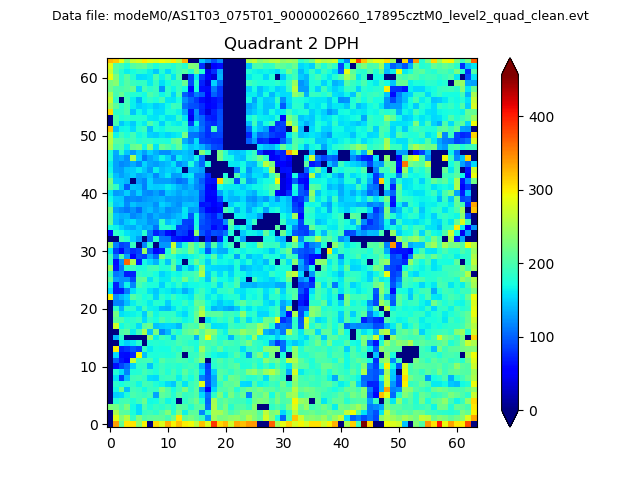 |
Quadrant C |
| Plot type | Count rate plots | Images |
|---|---|---|
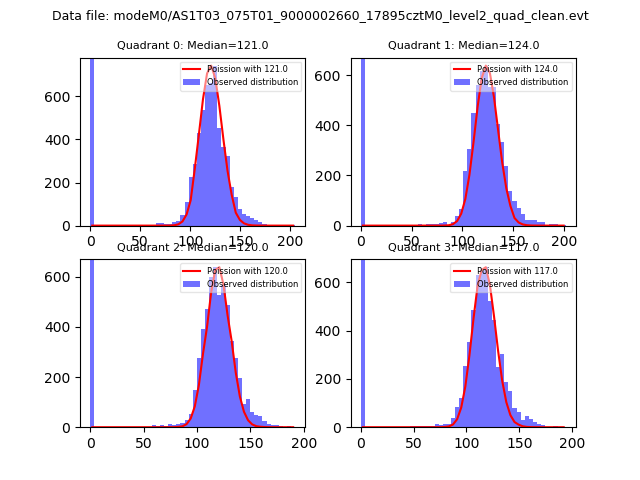
| Comparison with Poisson distribution Blue bars denote a histogram of data divided into 1 sec bins. Red curve is a Poisson curve with rate = median count rate of data. |
 |
 |
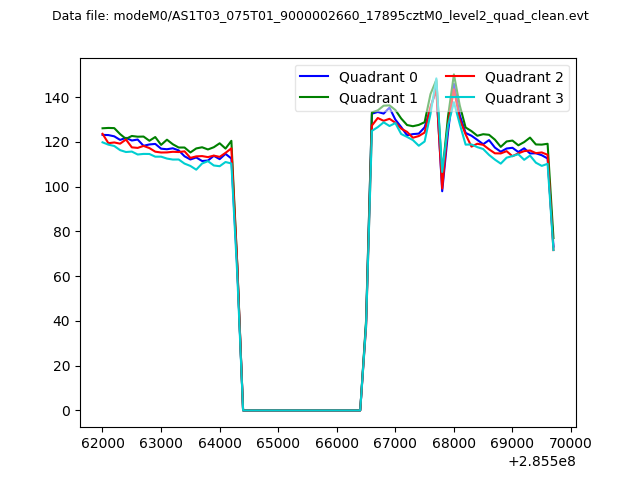
| Quadrant-wise count rates Data is divided into 100 sec bins |
 |
|
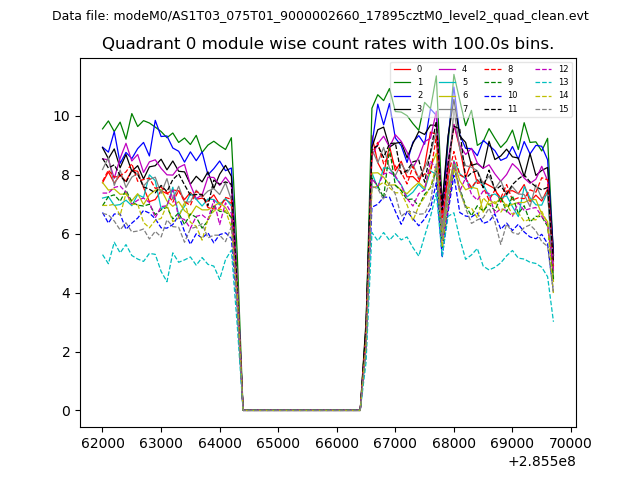
| Module-wise count rates for Quadrant A Data is divided into 100 sec bins |
 |
 |
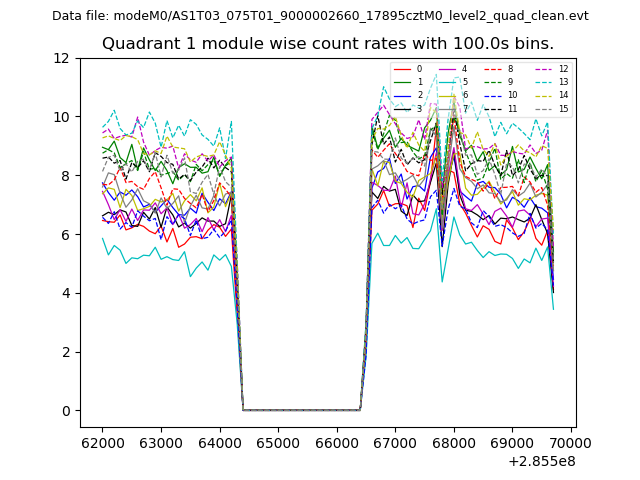
| Module-wise count rates for Quadrant B Data is divided into 100 sec bins |
 |
 |
| Module-wise count rates for Quadrant C Data is divided into 100 sec bins |
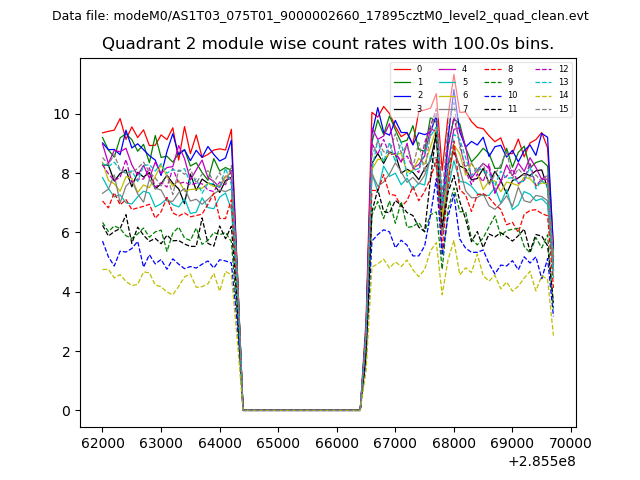 |
 |
| Module-wise count rates for Quadrant D Data is divided into 100 sec bins |
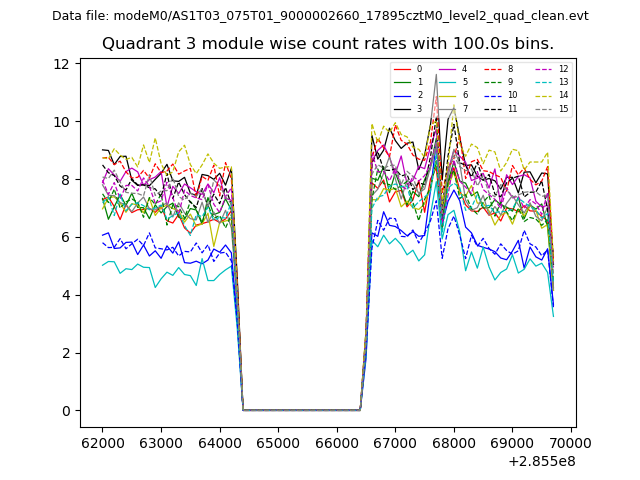 |
 |
| Parameter | Plot |
|---|---|
| CZT HV Monitor | 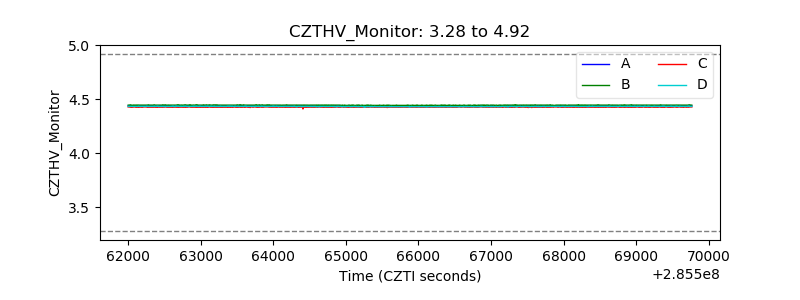 |
| D_VDD |  |
| Temperature 1 | 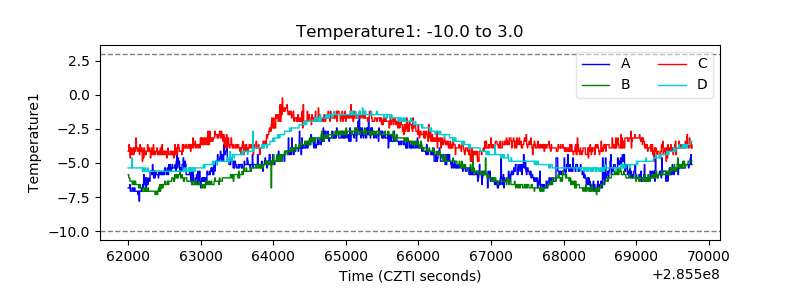 |
| Veto HV Monitor | 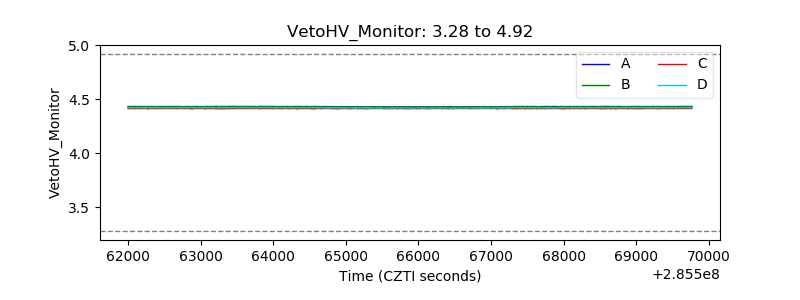 |
| Veto LLD | 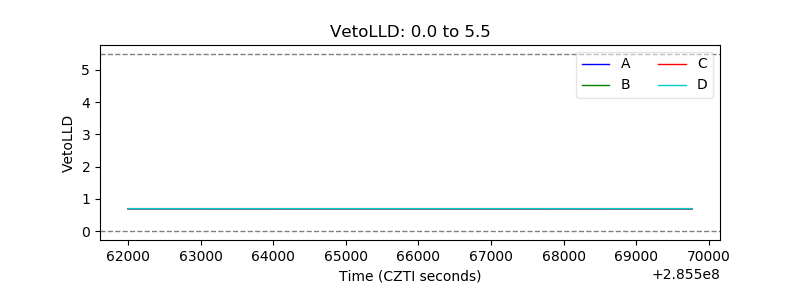 |
| Alpha Counter | 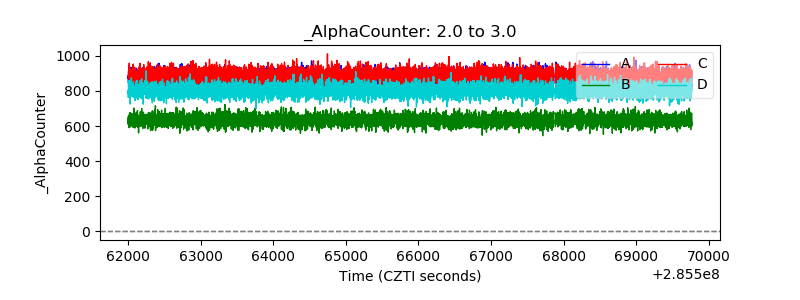 |
| _CPM_Rate | 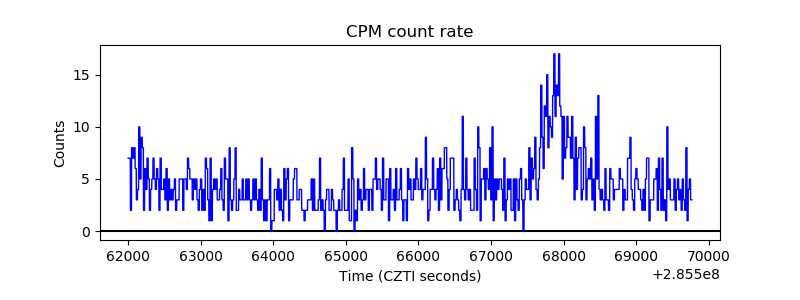 |
| CZT Counter | 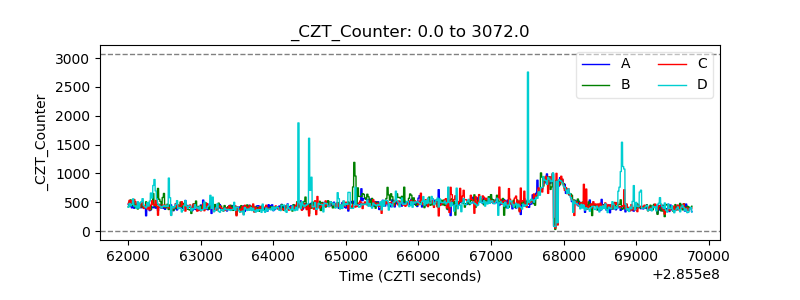 |
| +2.5 Volts monitor |  |
| +5 Volts monitor | 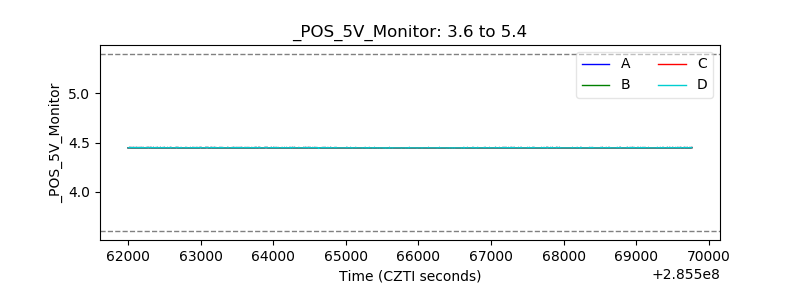 |
| _ROLL_ROT | 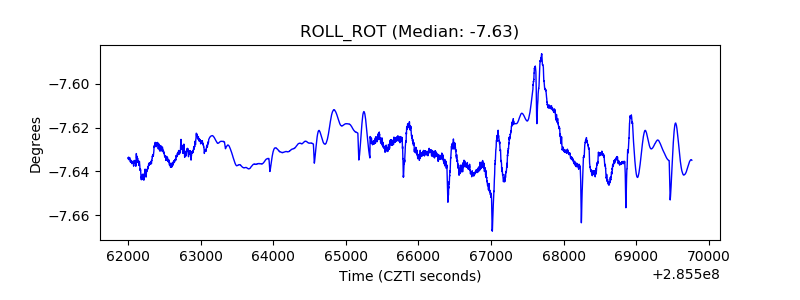 |
| _Roll_DEC | 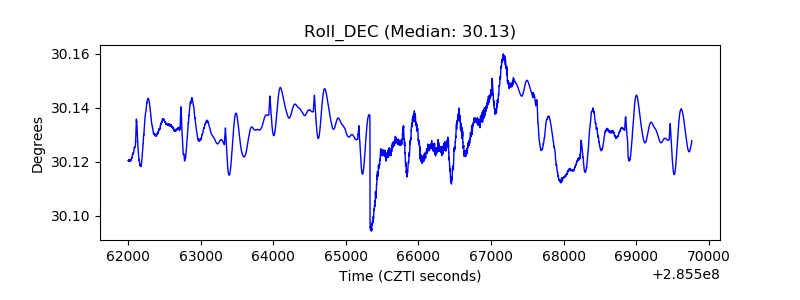 |
| _Roll_RA | 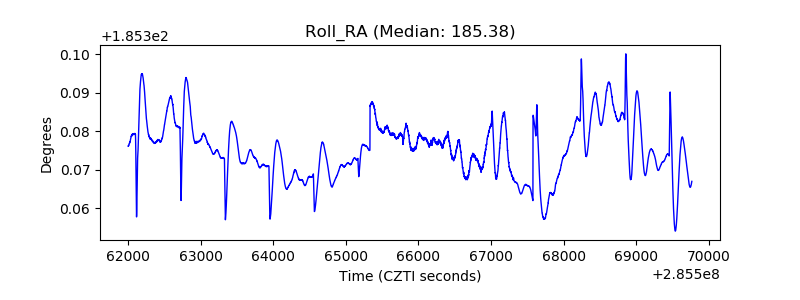 |
| Veto Counter | 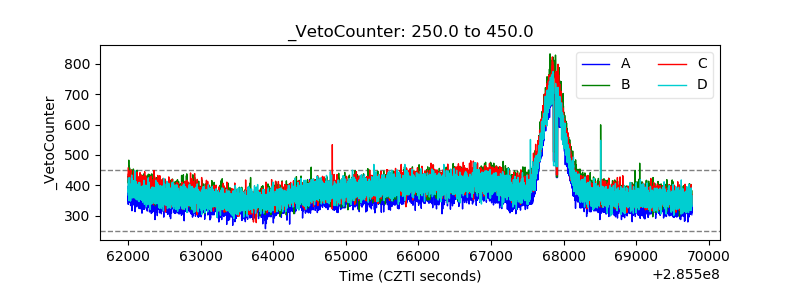 |