| Param | Original file | Final file |
|---|---|---|
| Filename | modeM0/AS1A05_109T01_9000002662_17898cztM0_level2.evt | modeM0/AS1A05_109T01_9000002662_17898cztM0_level2_quad_clean.evt |
| Size (bytes) | 476,804,160 | 80,400,960 |
| Size | 454.7 MB | 76.7 MB |
| Events in quadrant A | 3,380,857 | 488,698 |
| Events in quadrant B | 3,558,846 | 498,273 |
| Events in quadrant C | 3,516,465 | 478,550 |
| Events in quadrant D | 3,496,599 | 469,690 |
| Mode M0 | |||
|---|---|---|---|
| Quadrant | BADHDUFLAG | Total packets | Discarded packets |
| A | 0 | 14705 | 3 |
| B | 0 | 15002 | 2 |
| C | 0 | 14772 | 2 |
| D | 0 | 15134 | 2 |
| Mode SS | |||
|---|---|---|---|
| Quadrant | BADHDUFLAG | Total packets | Discarded packets |
| A | 0 | 144 | 0 |
| B | 0 | 144 | 0 |
| C | 0 | 144 | 0 |
| D | 0 | 144 | 0 |
| Mode M9 | |||
|---|---|---|---|
| Quadrant | BADHDUFLAG | Total packets | Discarded packets |
| A | 0 | 11 | 0 |
| B | 0 | 11 | 0 |
| C | 0 | 11 | 0 |
| D | 0 | 11 | 0 |
| Quadrant | Total seconds | Saturated seconds | Saturation percentage |
|---|---|---|---|
| A | 7177 | 66 | 0.919604% |
| B | 7177 | 71 | 0.989271% |
| C | 7177 | 102 | 1.421207% |
| D | 7177 | 75 | 1.045005% |
Noise dominated data is calculated using 1-second bins in cleaned event files. If a bin has >2000 counts, and if more than 50% of those come from <1% of pixels, then it is considered to be noise-dominated and hence unusable.
| Quadrant | # 1 sec bins | Bins with >0 counts | Bins with >2000 counts | High rate bins dominated by noise | Noise dominated (total time) | Noise dominated (detector-on time) | Marked lightcurve |
|---|---|---|---|---|---|---|---|
| A | 7842 | 7177 | 0 | 0 | 0.00% | 0.00% | 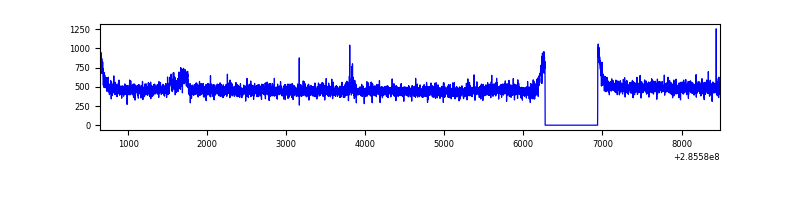 |
| B | 7842 | 7178 | 1 | 1 | 0.01% | 0.01% | 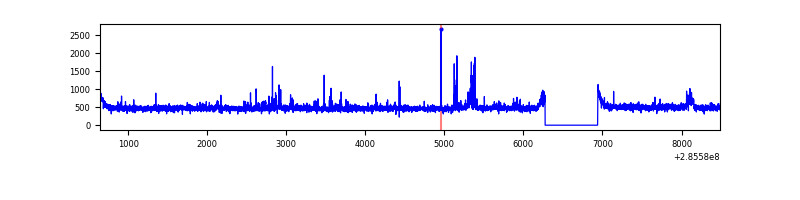 |
| C | 7842 | 7177 | 2 | 2 | 0.03% | 0.03% | 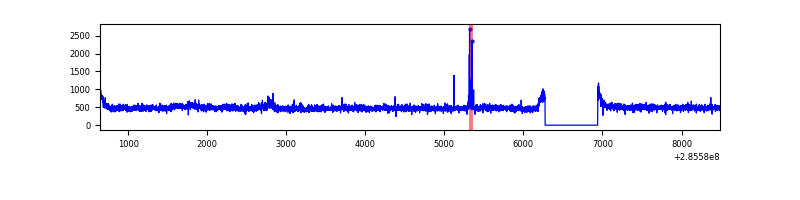 |
| D | 7842 | 7178 | 13 | 13 | 0.17% | 0.18% | 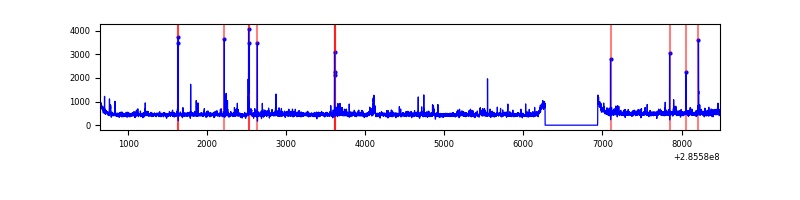 |
Top three noisy pixels from each quadrant. If the there are fewer than three noisy pixels in the level2.evt file, extra rows are filled as -1
| Pixel properties | Quadrant properties | ||||||
|---|---|---|---|---|---|---|---|
| Quadrant | DetID | PixID | Counts | Sigma | Mean | Median | Sigma |
| A | 15 | 174 | 39534 | 216.76 | 869 | 848 | 178.5 |
| A | 0 | 226 | 7405 | 36.74 | 869 | 848 | 178.5 |
| A | 3 | 137 | 6835 | 33.55 | 869 | 848 | 178.5 |
| B | 15 | 222 | 43384 | 251.5 | 869 | 843 | 169.2 |
| B | 4 | 216 | 36805 | 212.6 | 869 | 843 | 169.2 |
| B | 0 | 189 | 34791 | 200.7 | 869 | 843 | 169.2 |
| C | 14 | 238 | 128265 | 646.7 | 834 | 838 | 197.0 |
| C | 3 | 233 | 101880 | 512.8 | 834 | 838 | 197.0 |
| C | 9 | 54 | 28493 | 140.35 | 834 | 838 | 197.0 |
| D | 1 | 52 | 68132 | 323.52 | 848 | 822 | 208.1 |
| D | 10 | 70 | 50755 | 240.0 | 848 | 822 | 208.1 |
| D | 7 | 238 | 36414 | 171.07 | 848 | 822 | 208.1 |
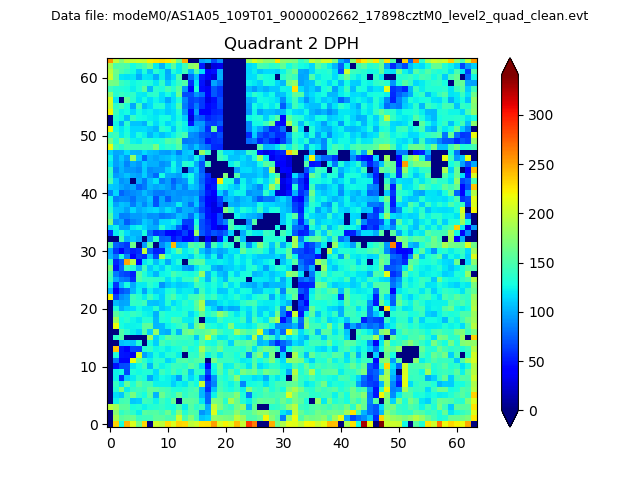
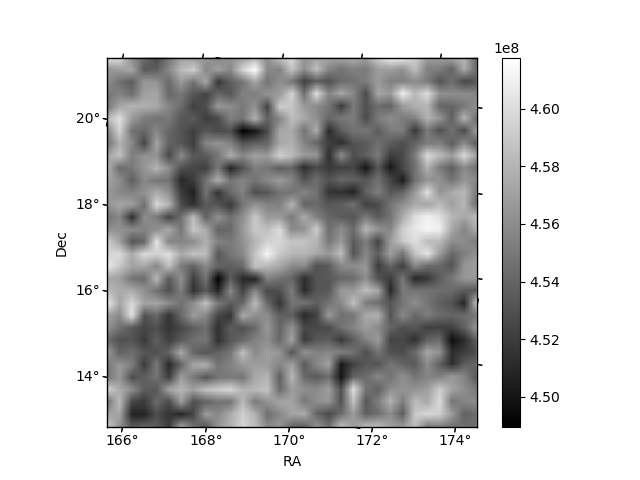
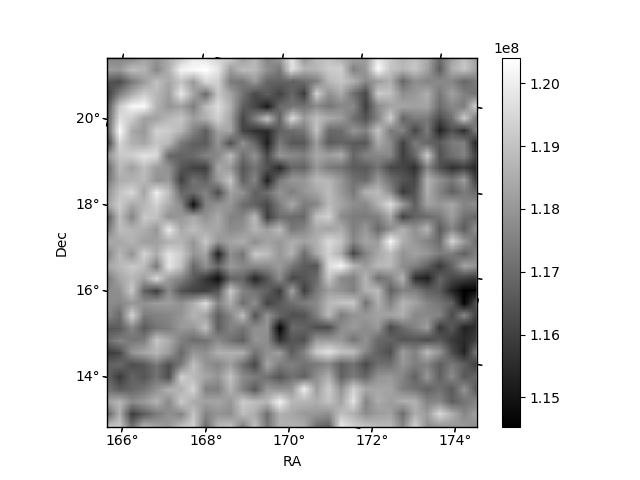
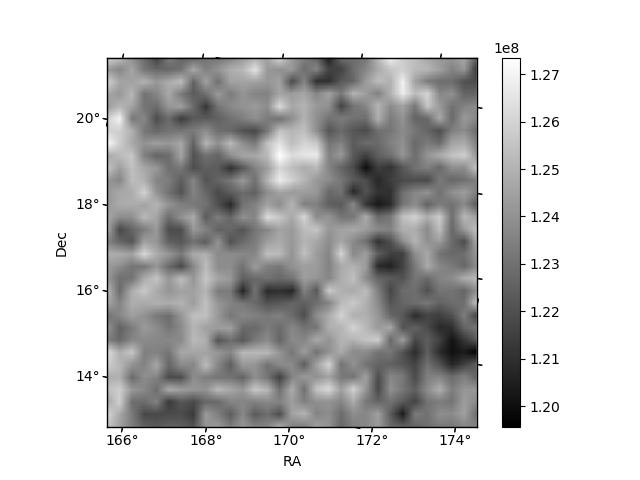
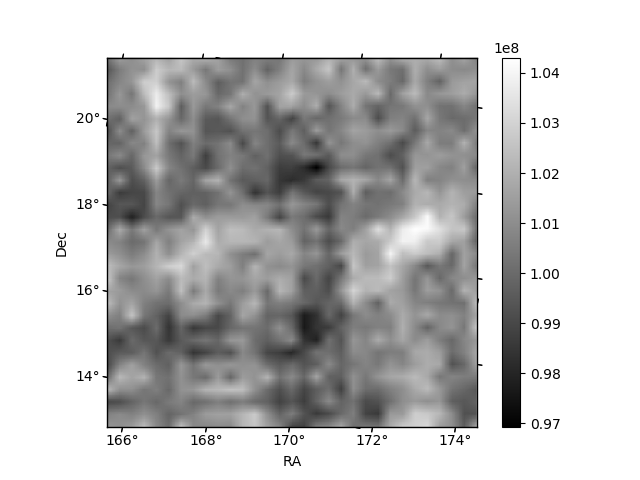
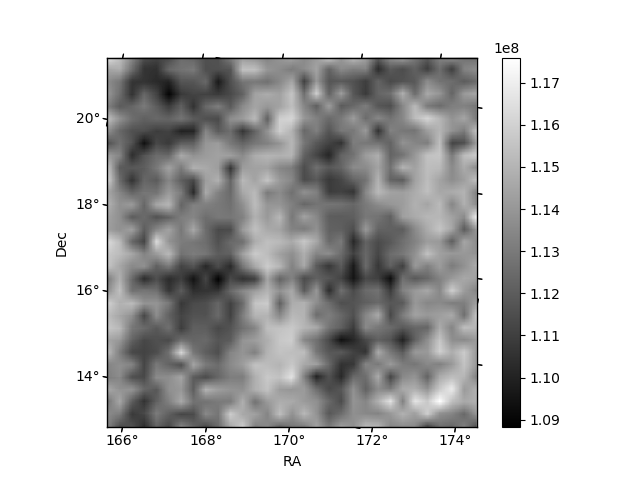
Histogram calculated using DETX and DETY for each event in the final _common_clean file
| Quadrant A | 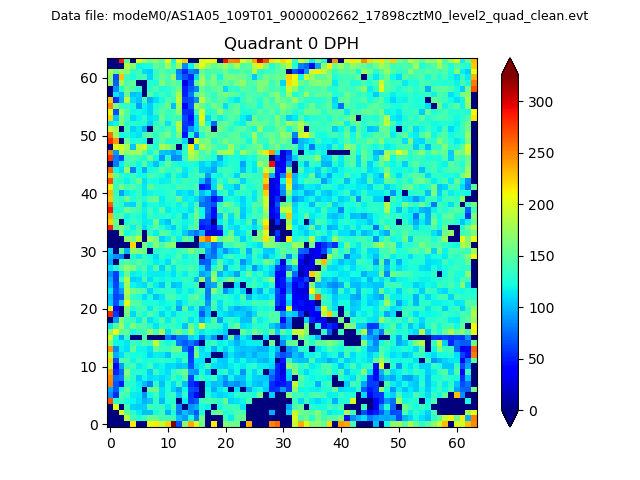 |
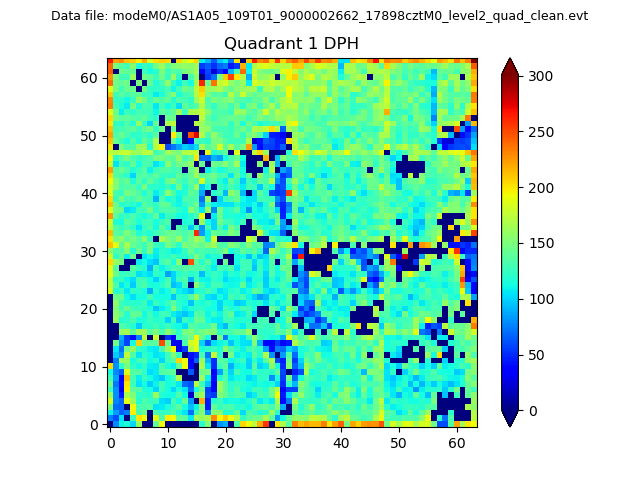 |
Quadrant B |
|---|---|---|---|
| Quadrant D | 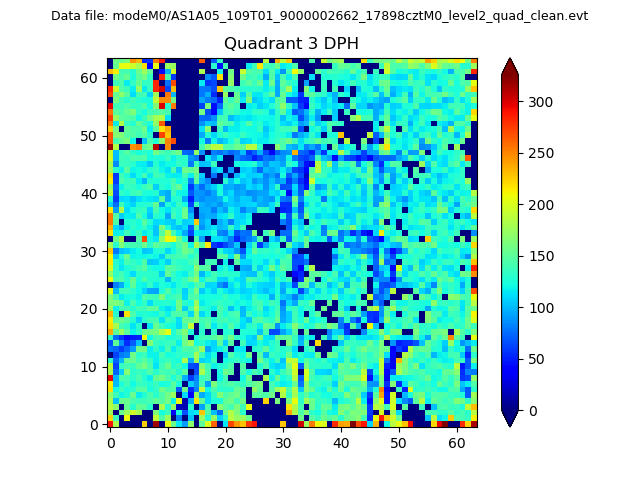 |
 |
Quadrant C |
| Plot type | Count rate plots | Images |
|---|---|---|
| Comparison with Poisson distribution Blue bars denote a histogram of data divided into 1 sec bins. Red curve is a Poisson curve with rate = median count rate of data. |
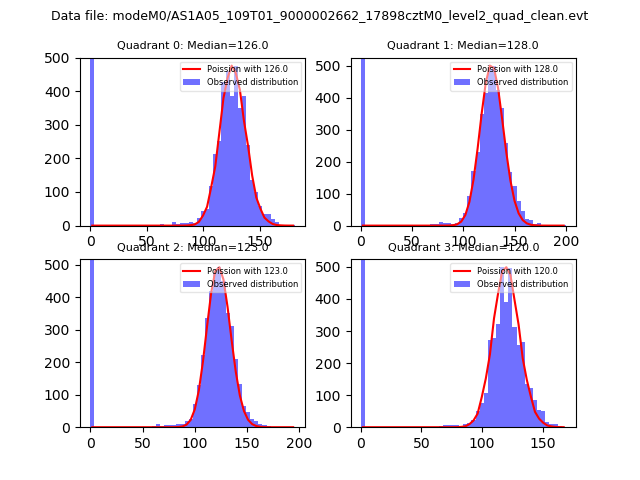 |
 |
| Quadrant-wise count rates Data is divided into 100 sec bins |
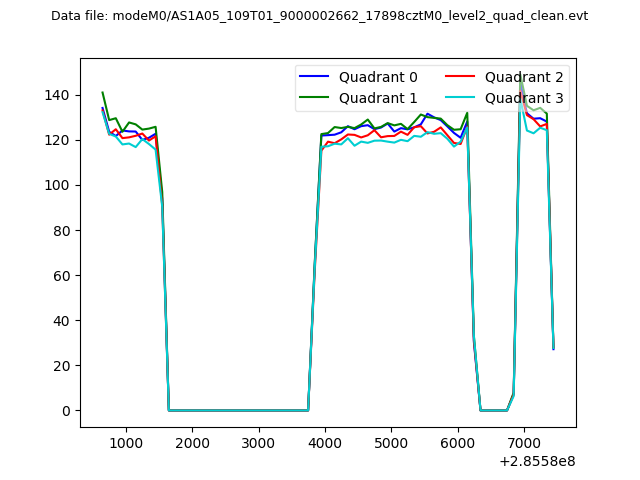 |
|
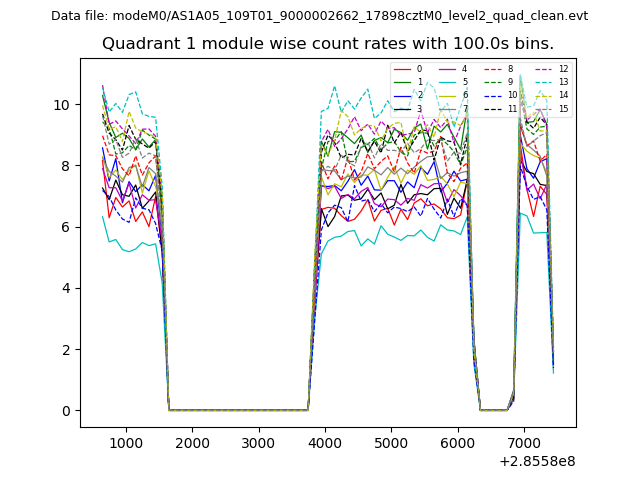
| Module-wise count rates for Quadrant A Data is divided into 100 sec bins |
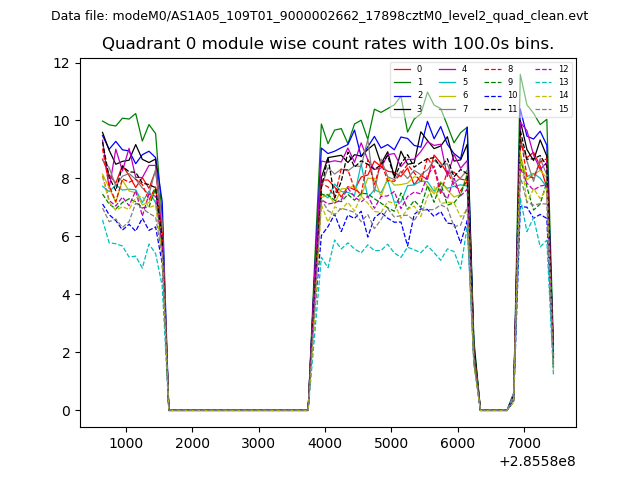 |
 |
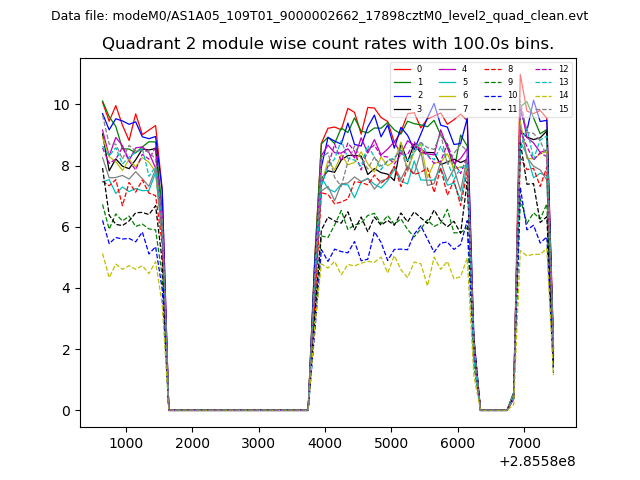
| Module-wise count rates for Quadrant B Data is divided into 100 sec bins |
 |
 |
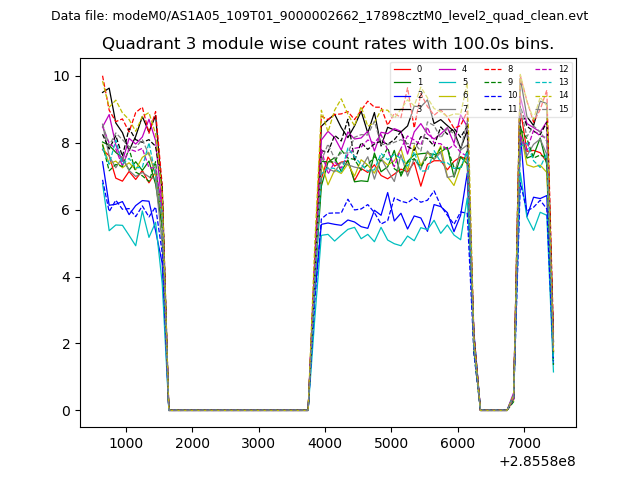
| Module-wise count rates for Quadrant C Data is divided into 100 sec bins |
 |
 |
| Module-wise count rates for Quadrant D Data is divided into 100 sec bins |
 |
 |
| Parameter | Plot |
|---|---|
| CZT HV Monitor | 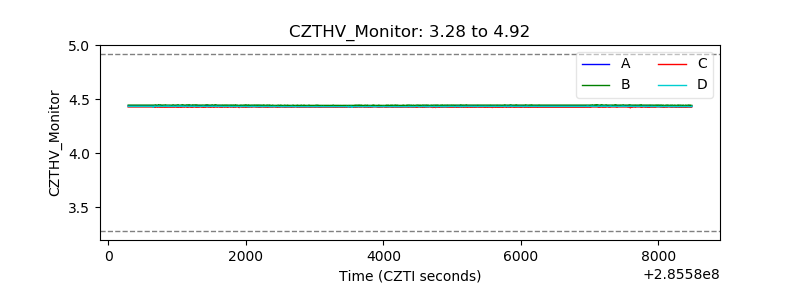 |
| D_VDD | 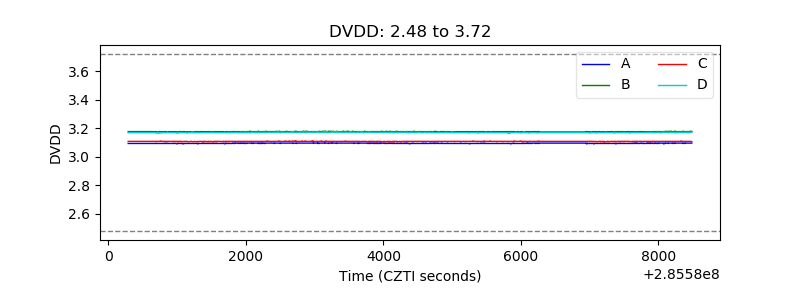 |
| Temperature 1 | 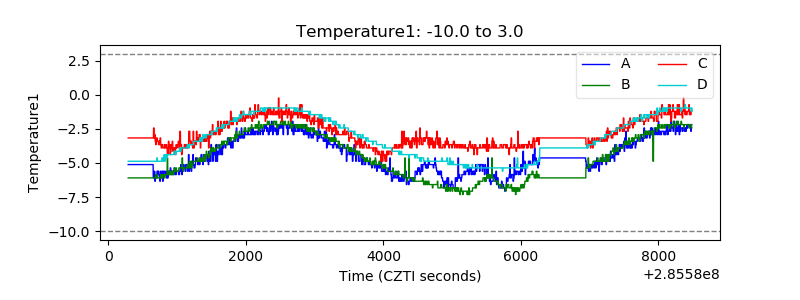 |
| Veto HV Monitor | 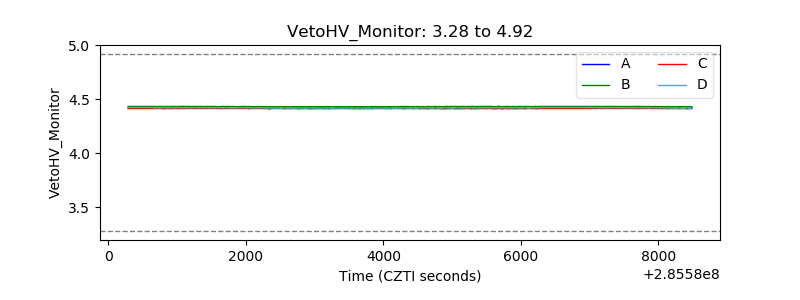 |
| Veto LLD | 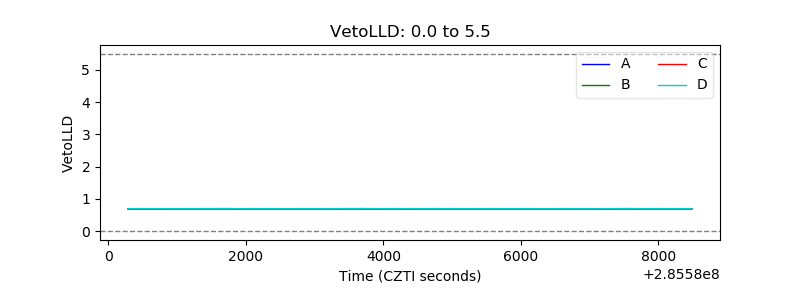 |
| Alpha Counter | 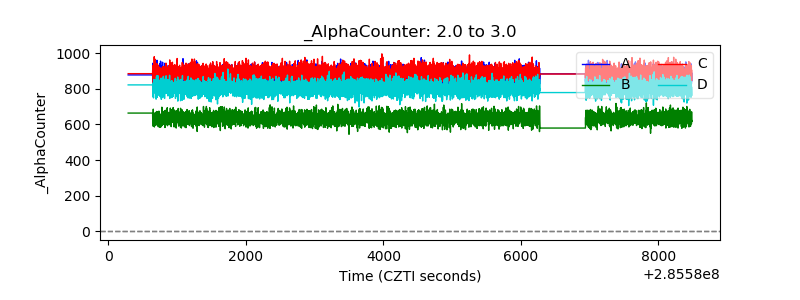 |
| _CPM_Rate | 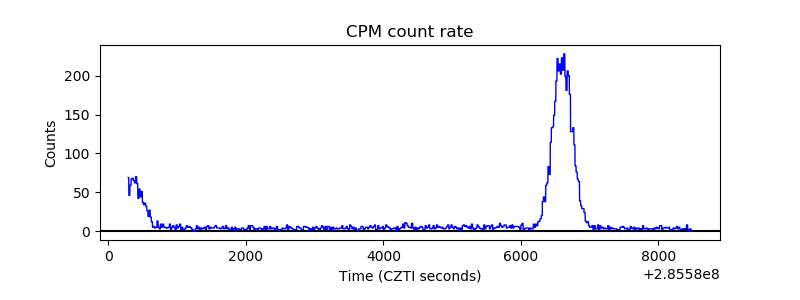 |
| CZT Counter | 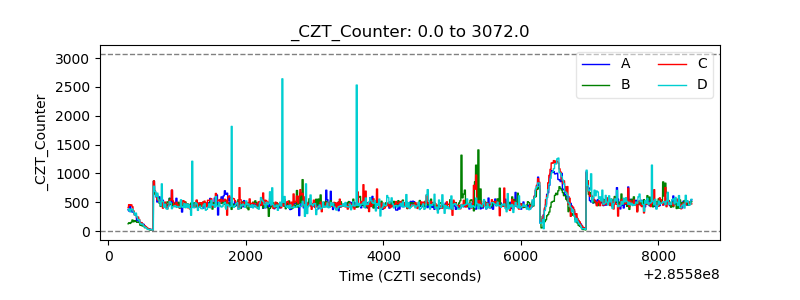 |
| +2.5 Volts monitor | 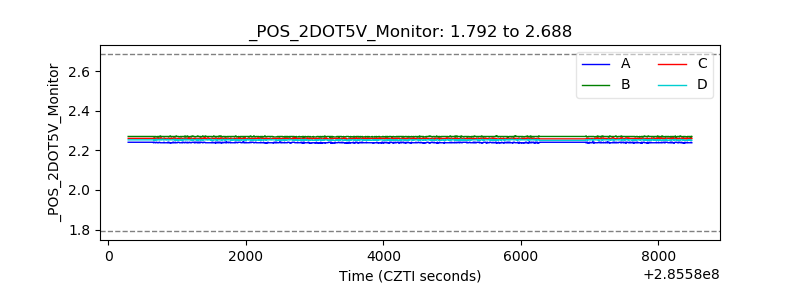 |
| +5 Volts monitor |  |
| _ROLL_ROT | 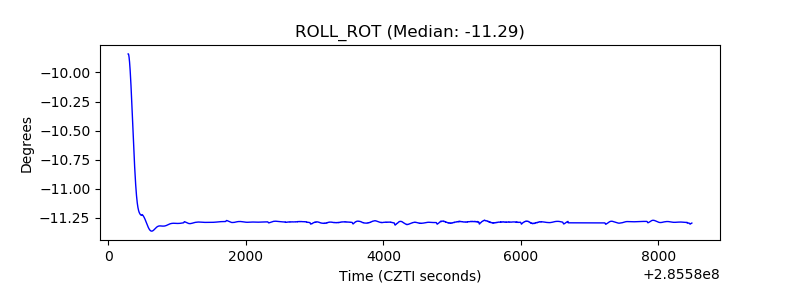 |
| _Roll_DEC | 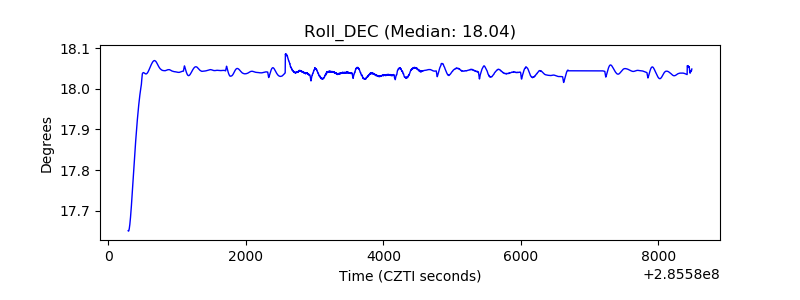 |
| _Roll_RA | 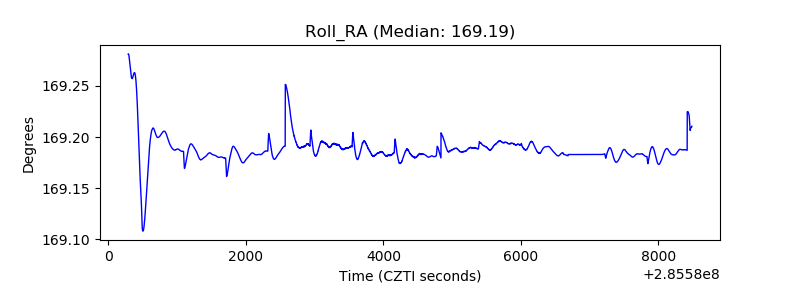 |
| Veto Counter | 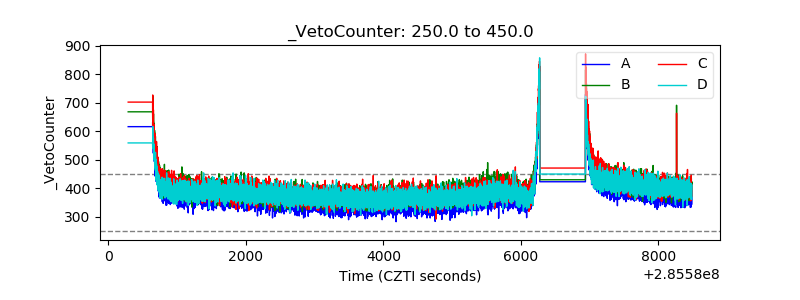 |