| Param | Original file | Final file |
|---|---|---|
| Filename | modeM0/AS1A05_109T01_9000002662_17899cztM0_level2.evt | modeM0/AS1A05_109T01_9000002662_17899cztM0_level2_quad_clean.evt |
| Size (bytes) | 460,995,840 | 65,620,800 |
| Size | 439.6 MB | 62.6 MB |
| Events in quadrant A | 3,299,584 | 382,518 |
| Events in quadrant B | 3,508,666 | 388,372 |
| Events in quadrant C | 3,365,078 | 372,908 |
| Events in quadrant D | 3,325,854 | 369,063 |
| Mode M0 | |||
|---|---|---|---|
| Quadrant | BADHDUFLAG | Total packets | Discarded packets |
| A | 0 | 14149 | 2 |
| B | 0 | 14611 | 1 |
| C | 0 | 14215 | 1 |
| D | 0 | 14339 | 1 |
| Mode SS | |||
|---|---|---|---|
| Quadrant | BADHDUFLAG | Total packets | Discarded packets |
| A | 0 | 138 | 0 |
| B | 0 | 138 | 0 |
| C | 0 | 138 | 0 |
| D | 0 | 138 | 0 |
| Mode M9 | |||
|---|---|---|---|
| Quadrant | BADHDUFLAG | Total packets | Discarded packets |
| A | 0 | 8 | 0 |
| B | 0 | 8 | 0 |
| C | 0 | 8 | 0 |
| D | 0 | 8 | 0 |
| Quadrant | Total seconds | Saturated seconds | Saturation percentage |
|---|---|---|---|
| A | 6799 | 73 | 1.073687% |
| B | 6800 | 94 | 1.382353% |
| C | 6800 | 120 | 1.764706% |
| D | 6800 | 55 | 0.808824% |
Noise dominated data is calculated using 1-second bins in cleaned event files. If a bin has >2000 counts, and if more than 50% of those come from <1% of pixels, then it is considered to be noise-dominated and hence unusable.
| Quadrant | # 1 sec bins | Bins with >0 counts | Bins with >2000 counts | High rate bins dominated by noise | Noise dominated (total time) | Noise dominated (detector-on time) | Marked lightcurve |
|---|---|---|---|---|---|---|---|
| A | 7639 | 6799 | 2 | 2 | 0.03% | 0.03% | 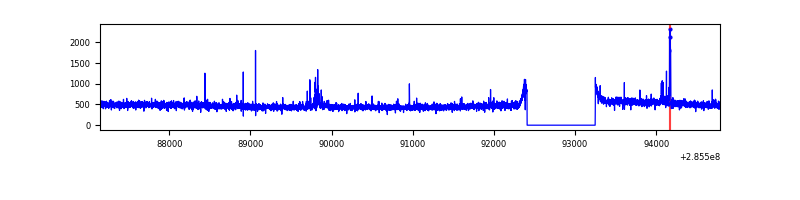 |
| B | 7640 | 6800 | 21 | 21 | 0.27% | 0.31% | 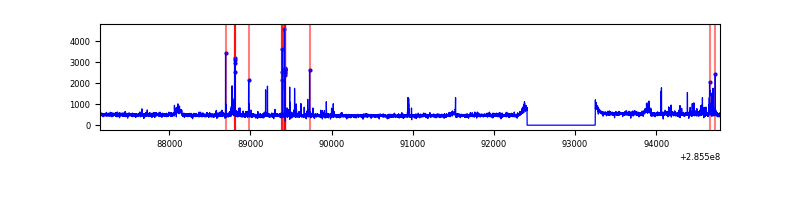 |
| C | 7640 | 6800 | 22 | 22 | 0.29% | 0.32% | 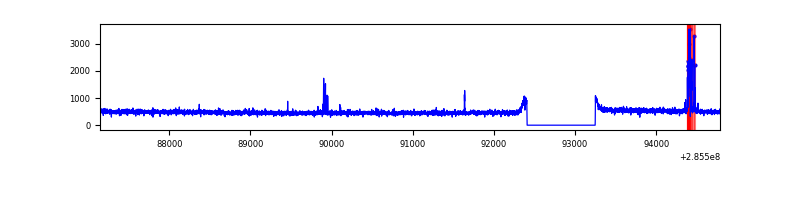 |
| D | 7640 | 6800 | 6 | 6 | 0.08% | 0.09% | 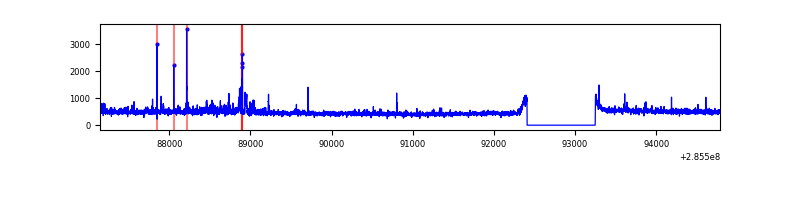 |
Top three noisy pixels from each quadrant. If the there are fewer than three noisy pixels in the level2.evt file, extra rows are filled as -1
| Pixel properties | Quadrant properties | ||||||
|---|---|---|---|---|---|---|---|
| Quadrant | DetID | PixID | Counts | Sigma | Mean | Median | Sigma |
| A | 15 | 174 | 89592 | 516.14 | 835 | 816 | 172.0 |
| A | 0 | 226 | 7150 | 36.83 | 835 | 816 | 172.0 |
| A | 3 | 137 | 6473 | 32.89 | 835 | 816 | 172.0 |
| B | 4 | 216 | 73492 | 451.64 | 829 | 807 | 160.9 |
| B | 4 | 80 | 47130 | 287.84 | 829 | 807 | 160.9 |
| B | 0 | 189 | 45245 | 276.12 | 829 | 807 | 160.9 |
| C | 14 | 238 | 124343 | 655.35 | 799 | 804 | 188.5 |
| C | 9 | 54 | 83012 | 436.1 | 799 | 804 | 188.5 |
| C | 9 | 160 | 17048 | 86.17 | 799 | 804 | 188.5 |
| D | 12 | 110 | 113866 | 564.95 | 817 | 793 | 200.1 |
| D | 13 | 168 | 52378 | 257.73 | 817 | 793 | 200.1 |
| D | 2 | 234 | 26387 | 127.88 | 817 | 793 | 200.1 |
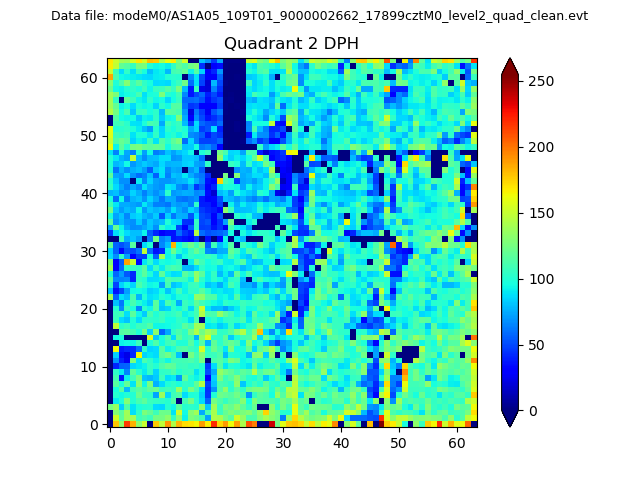
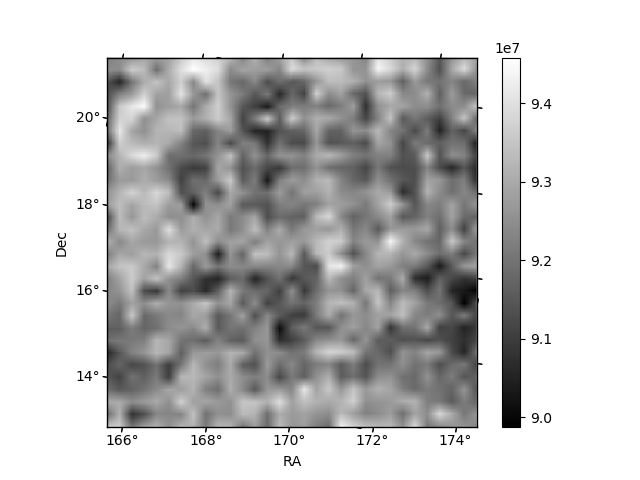
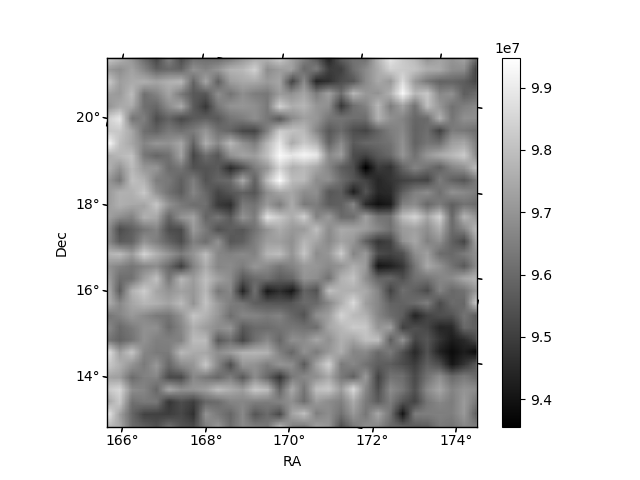
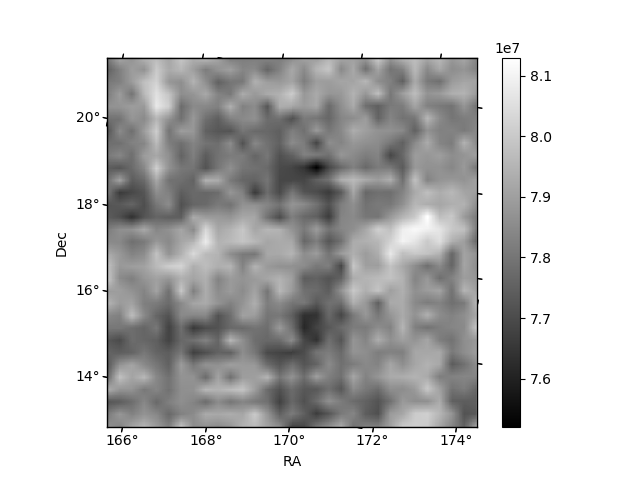
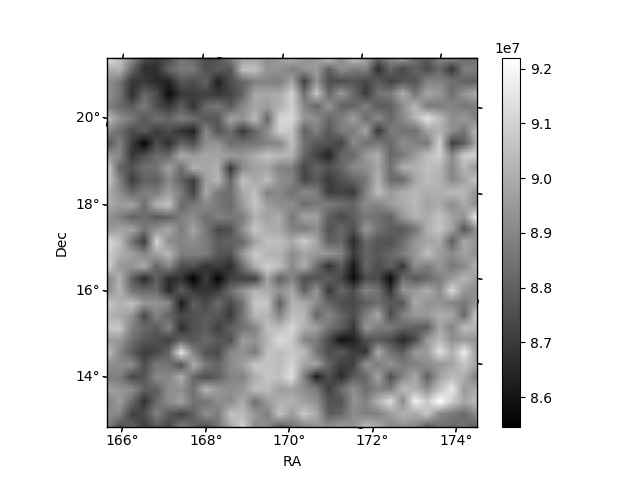
Histogram calculated using DETX and DETY for each event in the final _common_clean file
| Quadrant A |  |
 |
Quadrant B |
|---|---|---|---|
| Quadrant D | 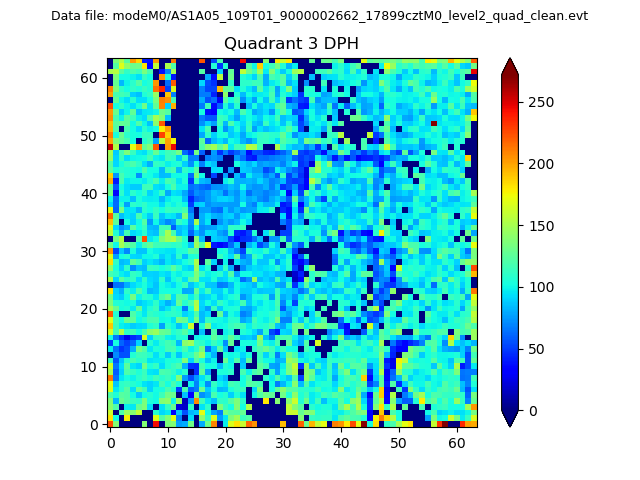 |
 |
Quadrant C |
| Plot type | Count rate plots | Images |
|---|---|---|
| Comparison with Poisson distribution Blue bars denote a histogram of data divided into 1 sec bins. Red curve is a Poisson curve with rate = median count rate of data. |
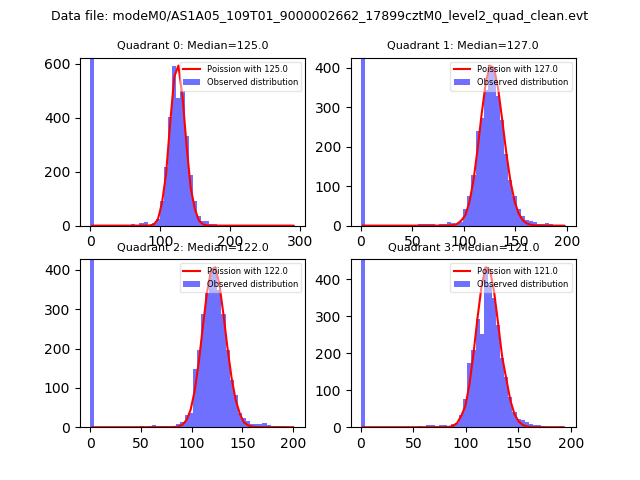 |
 |
| Quadrant-wise count rates Data is divided into 100 sec bins |
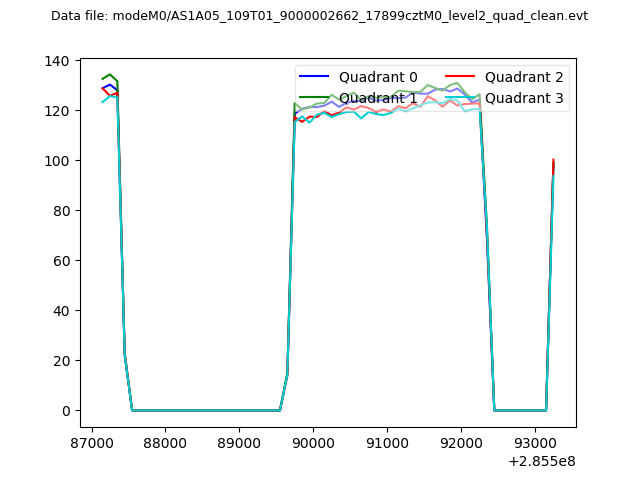 |
|
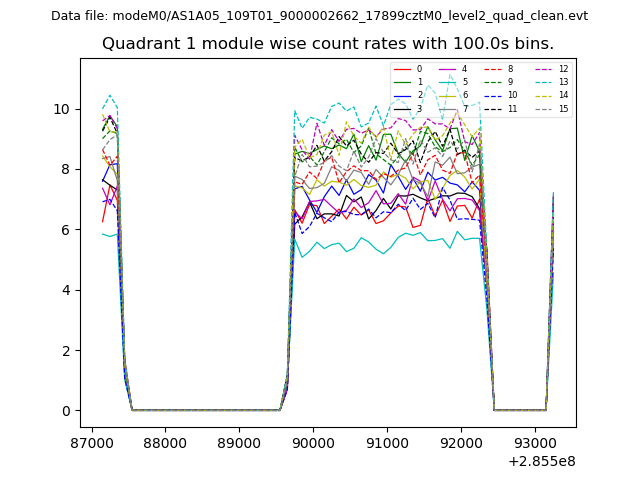
| Module-wise count rates for Quadrant A Data is divided into 100 sec bins |
 |
 |
| Module-wise count rates for Quadrant B Data is divided into 100 sec bins |
 |
 |
| Module-wise count rates for Quadrant C Data is divided into 100 sec bins |
 |
 |
| Module-wise count rates for Quadrant D Data is divided into 100 sec bins |
 |
 |
| Parameter | Plot |
|---|---|
| CZT HV Monitor | 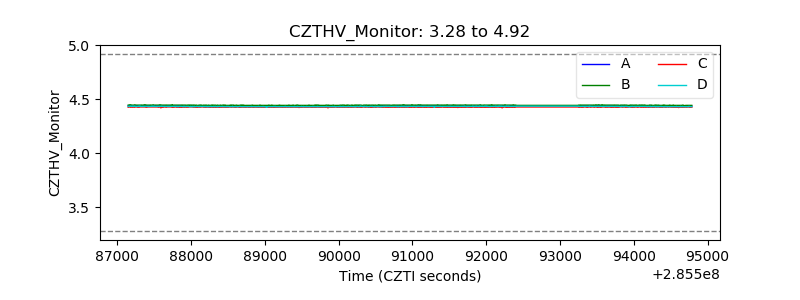 |
| D_VDD | 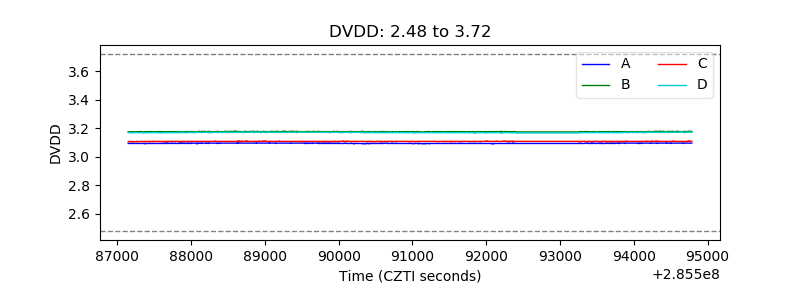 |
| Temperature 1 | 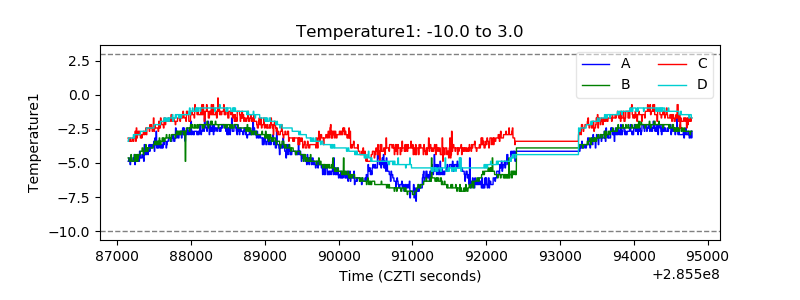 |
| Veto HV Monitor | 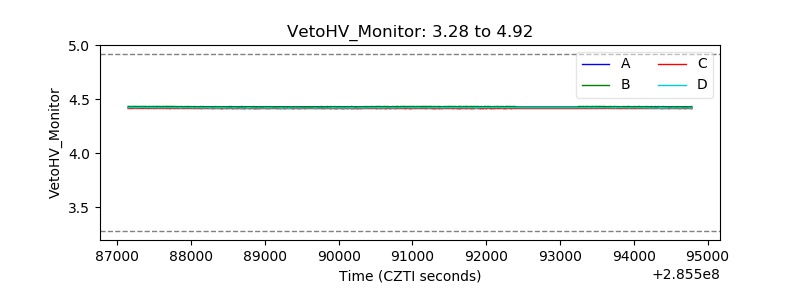 |
| Veto LLD | 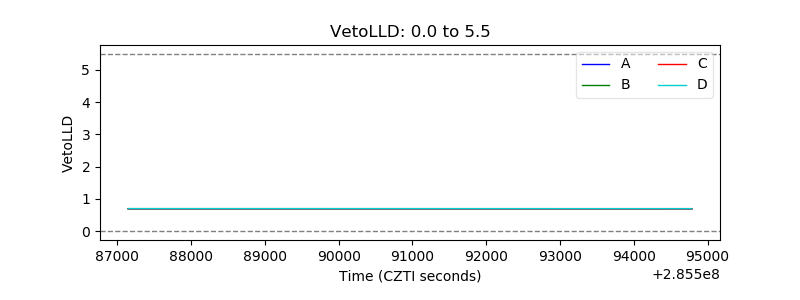 |
| Alpha Counter | 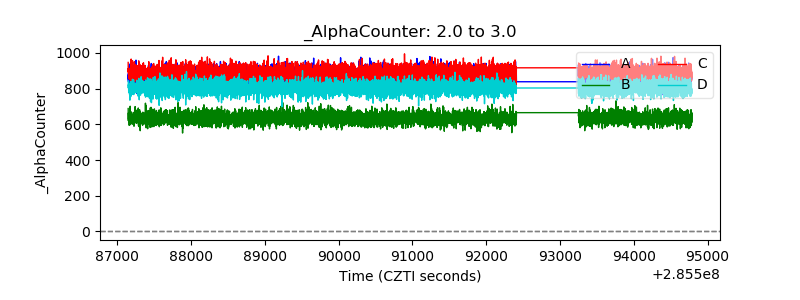 |
| _CPM_Rate | 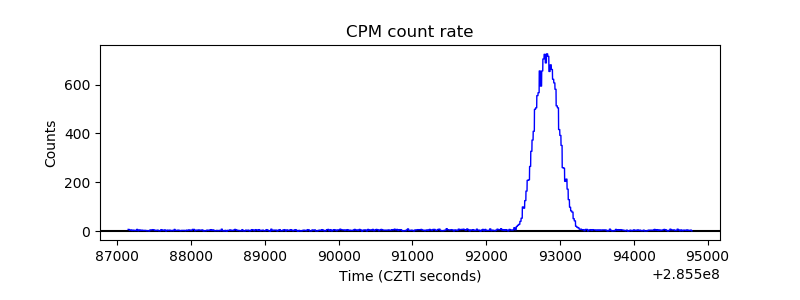 |
| CZT Counter | 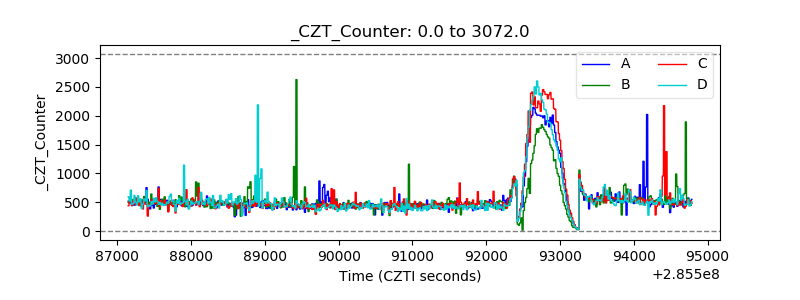 |
| +2.5 Volts monitor |  |
| +5 Volts monitor |  |
| _ROLL_ROT | 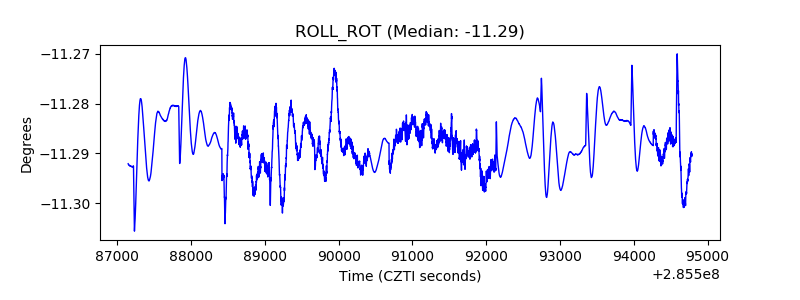 |
| _Roll_DEC | 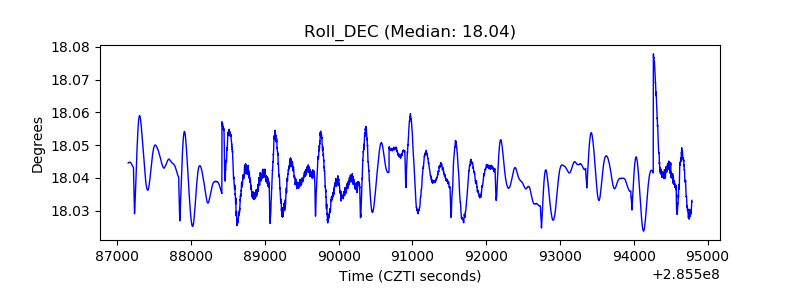 |
| _Roll_RA | 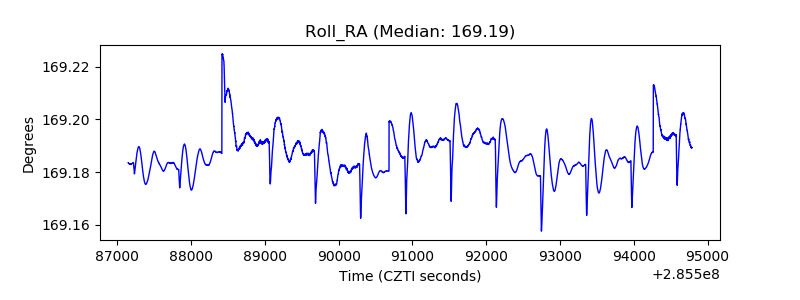 |
| Veto Counter | 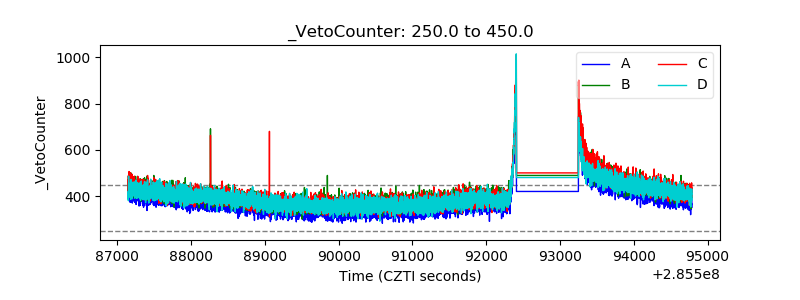 |