| Param | Original file | Final file |
|---|---|---|
| Filename | modeM0/AS1A05_109T01_9000002662_17900cztM0_level2.evt | modeM0/AS1A05_109T01_9000002662_17900cztM0_level2_quad_clean.evt |
| Size (bytes) | 468,872,640 | 65,237,760 |
| Size | 447.2 MB | 62.2 MB |
| Events in quadrant A | 3,321,196 | 381,488 |
| Events in quadrant B | 3,505,115 | 386,953 |
| Events in quadrant C | 3,450,649 | 371,404 |
| Events in quadrant D | 3,465,658 | 366,138 |
| Mode M0 | |||
|---|---|---|---|
| Quadrant | BADHDUFLAG | Total packets | Discarded packets |
| A | 0 | 14239 | 2 |
| B | 0 | 14710 | 2 |
| C | 0 | 14465 | 2 |
| D | 0 | 14667 | 2 |
| Mode SS | |||
|---|---|---|---|
| Quadrant | BADHDUFLAG | Total packets | Discarded packets |
| A | 0 | 138 | 0 |
| B | 0 | 138 | 0 |
| C | 0 | 138 | 0 |
| D | 0 | 138 | 0 |
| Mode M9 | |||
|---|---|---|---|
| Quadrant | BADHDUFLAG | Total packets | Discarded packets |
| A | 0 | 15 | 0 |
| B | 0 | 16 | 0 |
| C | 0 | 16 | 0 |
| D | 0 | 16 | 0 |
| Quadrant | Total seconds | Saturated seconds | Saturation percentage |
|---|---|---|---|
| A | 6726 | 79 | 1.174547% |
| B | 6726 | 92 | 1.367826% |
| C | 6726 | 135 | 2.007136% |
| D | 6726 | 61 | 0.906928% |
Noise dominated data is calculated using 1-second bins in cleaned event files. If a bin has >2000 counts, and if more than 50% of those come from <1% of pixels, then it is considered to be noise-dominated and hence unusable.
| Quadrant | # 1 sec bins | Bins with >0 counts | Bins with >2000 counts | High rate bins dominated by noise | Noise dominated (total time) | Noise dominated (detector-on time) | Marked lightcurve |
|---|---|---|---|---|---|---|---|
| A | 7746 | 6726 | 2 | 2 | 0.03% | 0.03% | 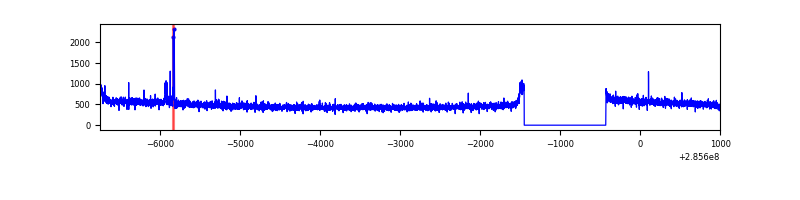 |
| B | 7746 | 6726 | 7 | 7 | 0.09% | 0.10% | 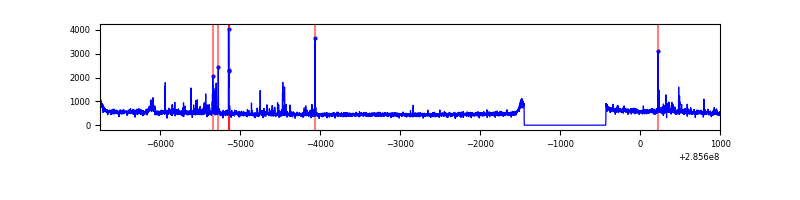 |
| C | 7746 | 6726 | 22 | 22 | 0.28% | 0.33% | 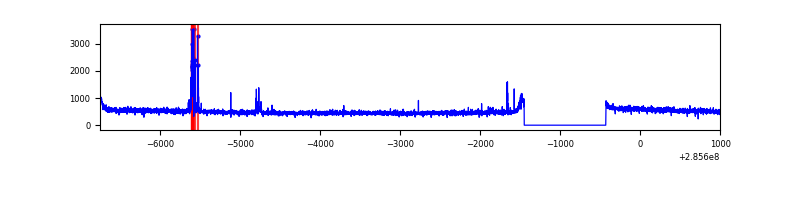 |
| D | 7746 | 6726 | 11 | 11 | 0.14% | 0.16% | 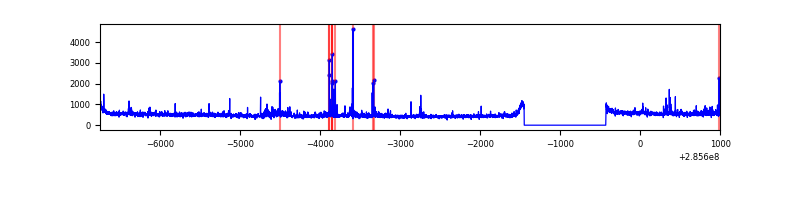 |
Top three noisy pixels from each quadrant. If the there are fewer than three noisy pixels in the level2.evt file, extra rows are filled as -1
| Pixel properties | Quadrant properties | ||||||
|---|---|---|---|---|---|---|---|
| Quadrant | DetID | PixID | Counts | Sigma | Mean | Median | Sigma |
| A | 15 | 174 | 53319 | 303.43 | 851 | 832 | 173.0 |
| A | 0 | 226 | 7316 | 37.48 | 851 | 832 | 173.0 |
| A | 3 | 137 | 6423 | 32.32 | 851 | 832 | 173.0 |
| B | 4 | 216 | 57678 | 348.49 | 848 | 826 | 163.1 |
| B | 0 | 189 | 32272 | 192.76 | 848 | 826 | 163.1 |
| B | 10 | 247 | 30070 | 179.26 | 848 | 826 | 163.1 |
| C | 14 | 238 | 127234 | 654.77 | 820 | 826 | 193.1 |
| C | 9 | 54 | 107820 | 554.21 | 820 | 826 | 193.1 |
| C | 3 | 233 | 13266 | 64.44 | 820 | 826 | 193.1 |
| D | 13 | 168 | 123778 | 600.47 | 837 | 813 | 204.8 |
| D | 1 | 52 | 56604 | 272.44 | 837 | 813 | 204.8 |
| D | 7 | 96 | 46924 | 225.17 | 837 | 813 | 204.8 |
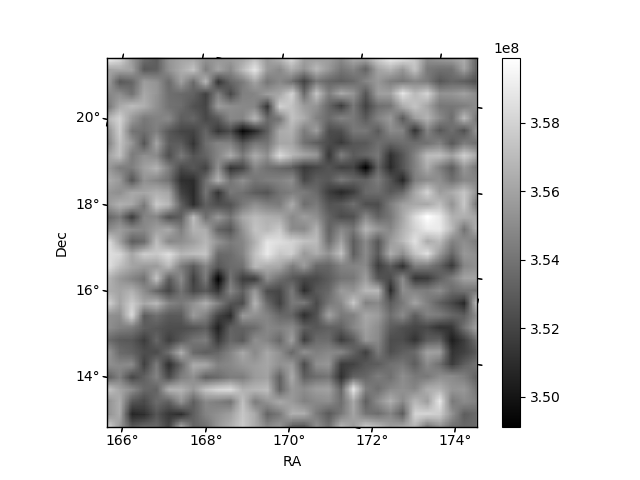
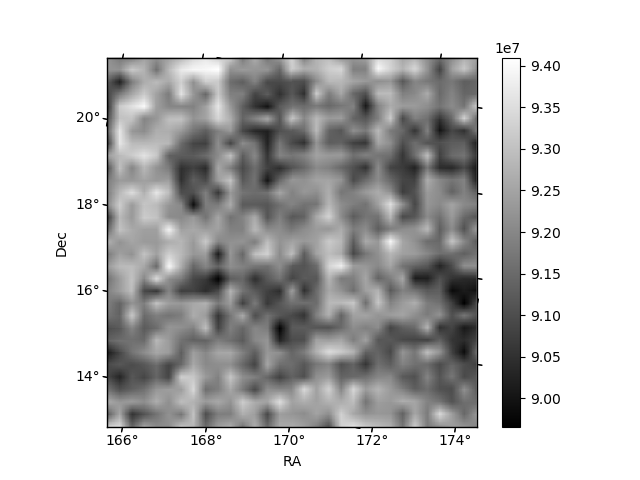
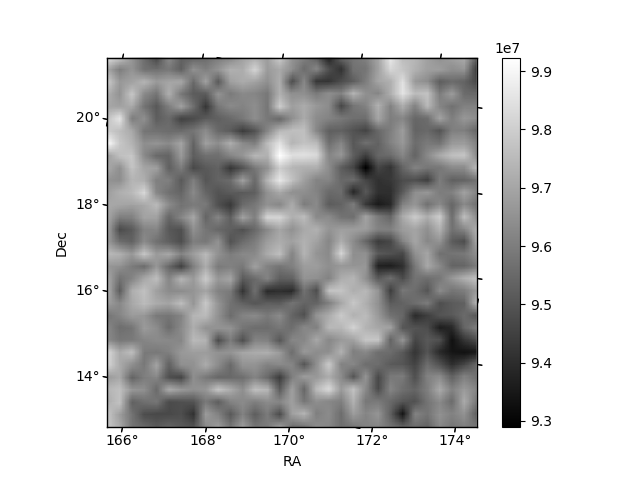
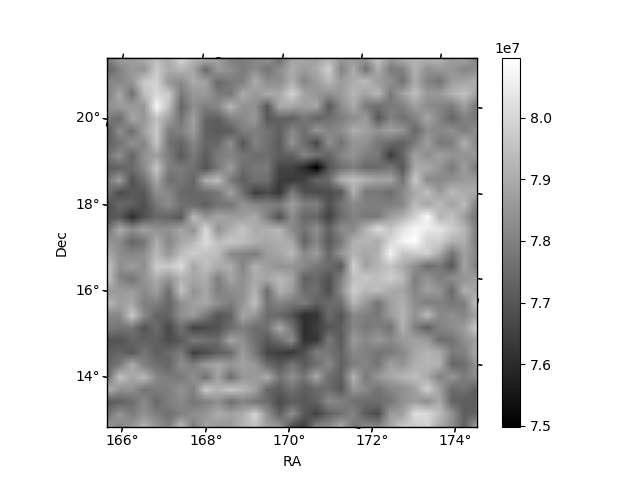
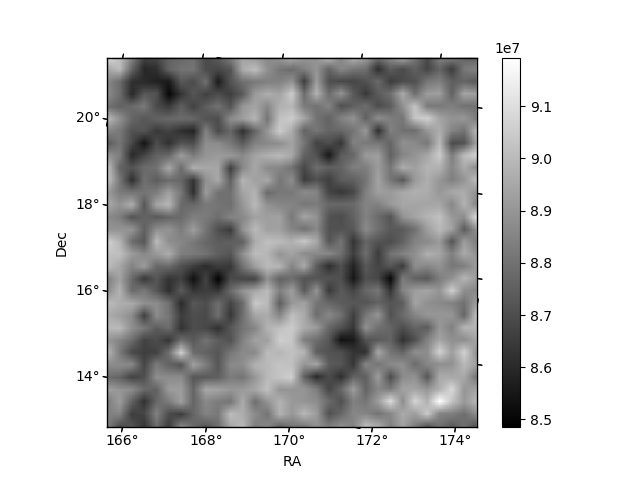
Histogram calculated using DETX and DETY for each event in the final _common_clean file
| Quadrant A | 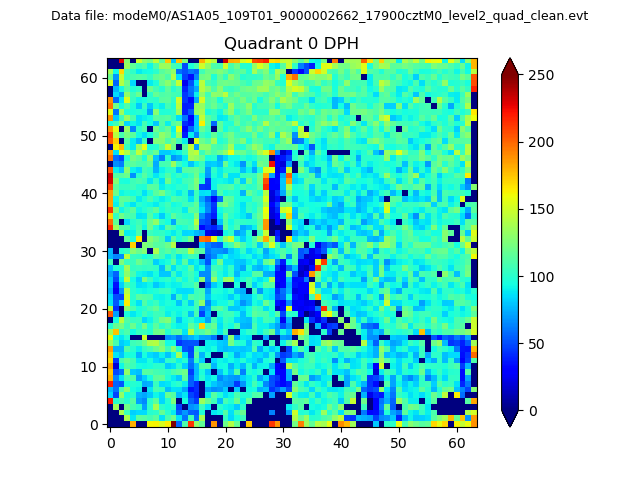 |
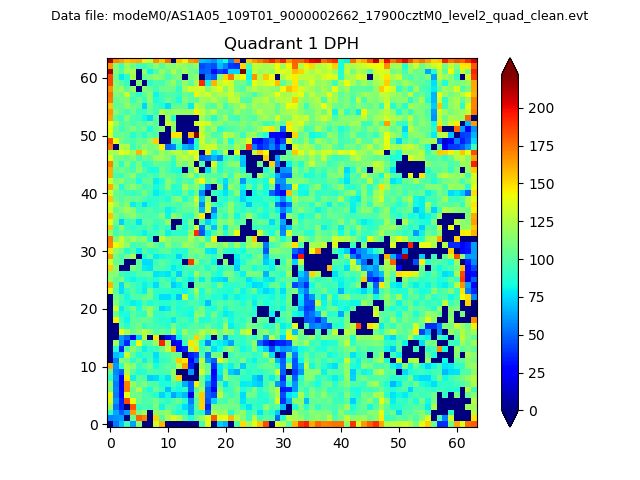 |
Quadrant B |
|---|---|---|---|
| Quadrant D | 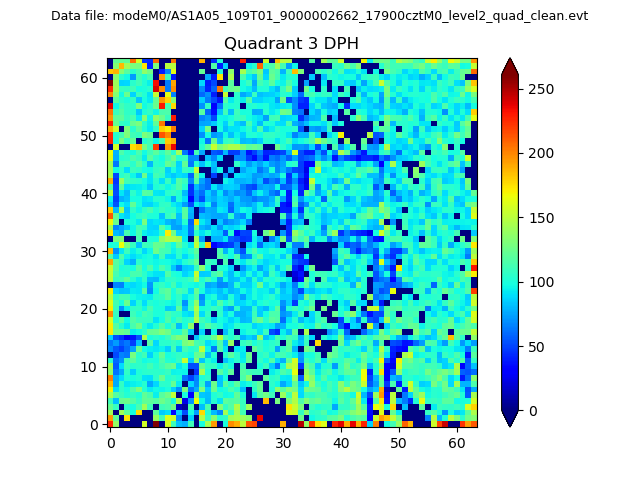 |
 |
Quadrant C |
| Plot type | Count rate plots | Images |
|---|---|---|
| Comparison with Poisson distribution Blue bars denote a histogram of data divided into 1 sec bins. Red curve is a Poisson curve with rate = median count rate of data. |
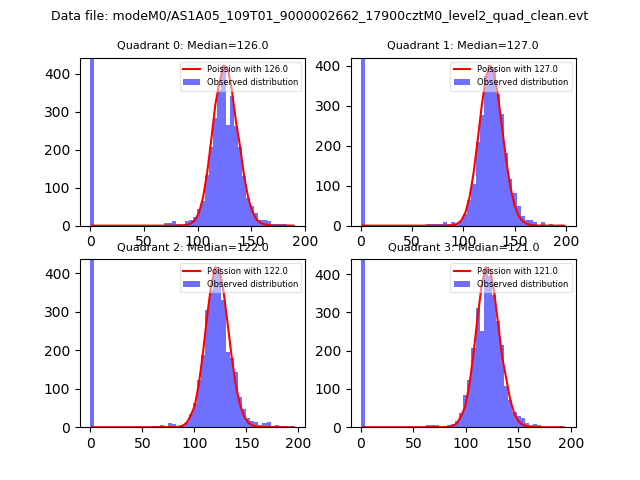 |
 |
| Quadrant-wise count rates Data is divided into 100 sec bins |
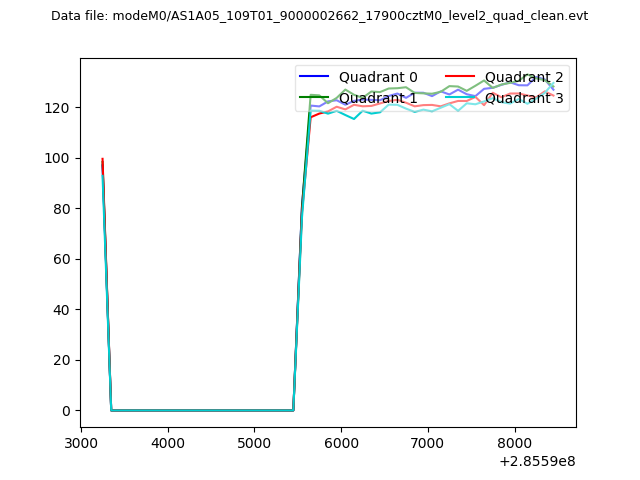 |
|
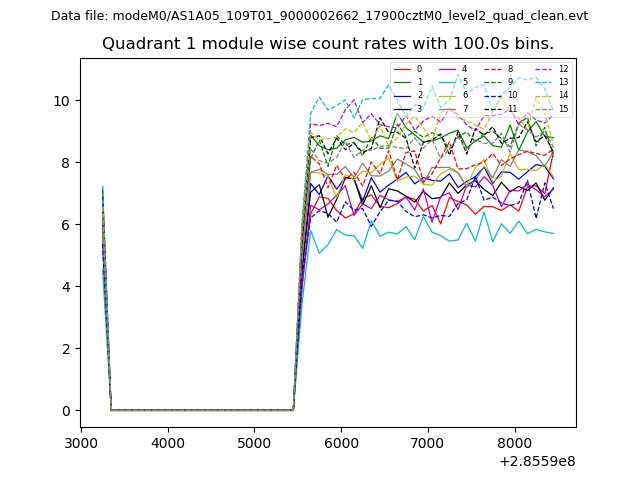
| Module-wise count rates for Quadrant A Data is divided into 100 sec bins |
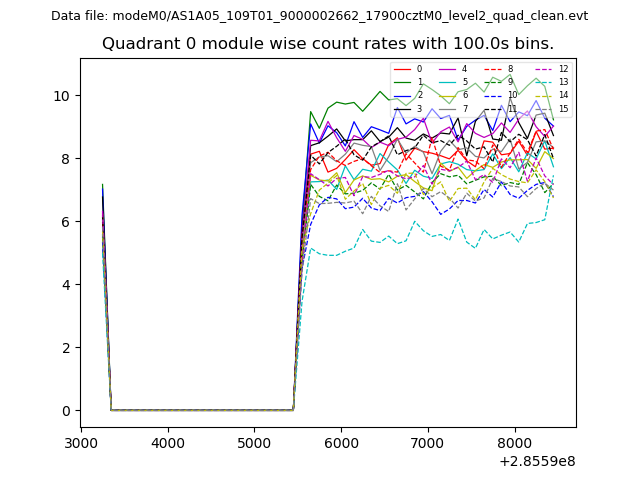 |
 |
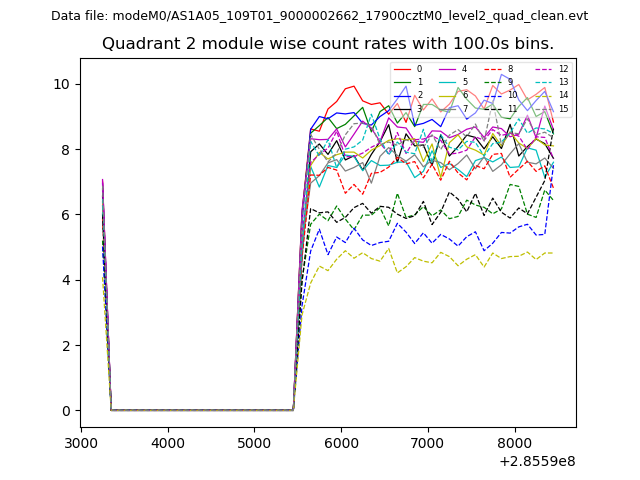
| Module-wise count rates for Quadrant B Data is divided into 100 sec bins |
 |
 |
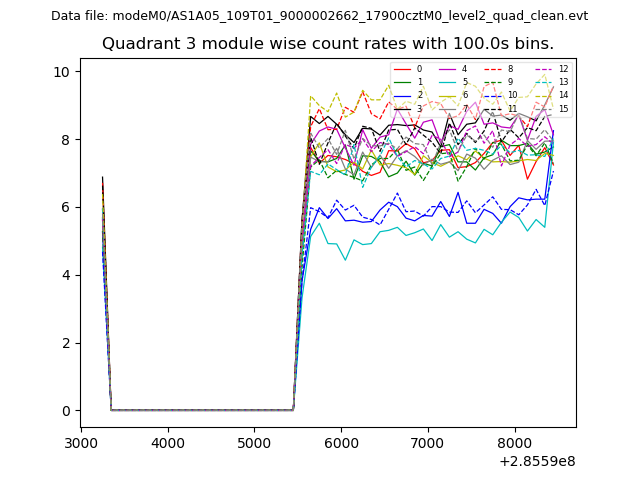
| Module-wise count rates for Quadrant C Data is divided into 100 sec bins |
 |
 |
| Module-wise count rates for Quadrant D Data is divided into 100 sec bins |
 |
 |
| Parameter | Plot |
|---|---|
| CZT HV Monitor | 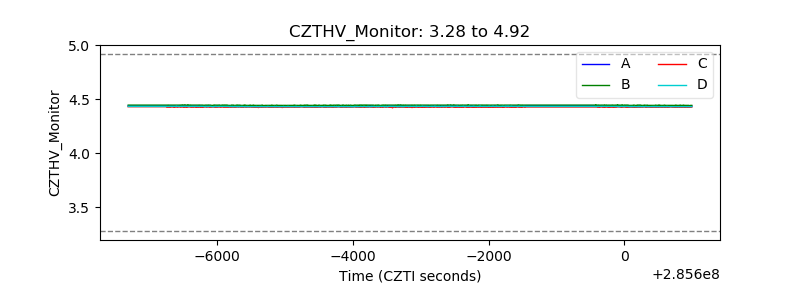 |
| D_VDD | 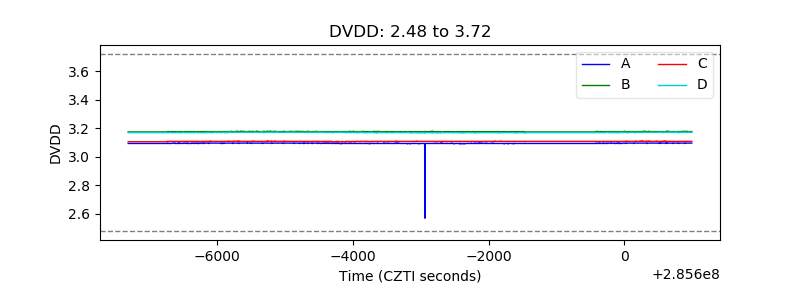 |
| Temperature 1 | 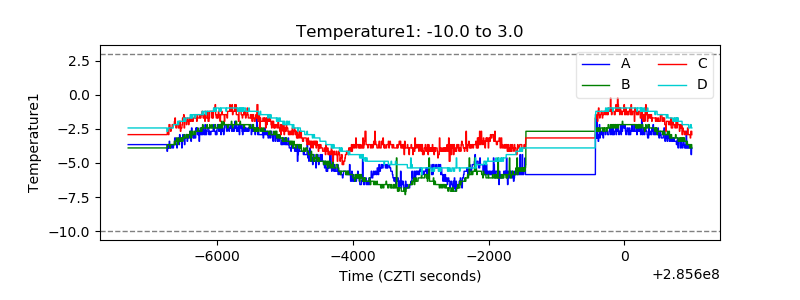 |
| Veto HV Monitor | 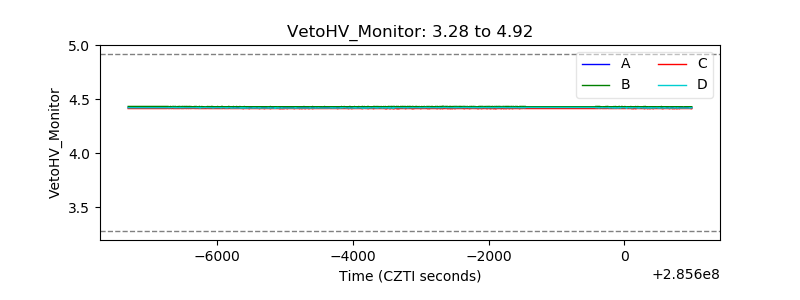 |
| Veto LLD | 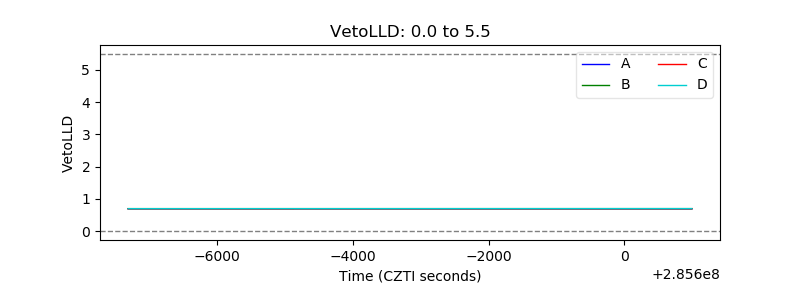 |
| Alpha Counter | 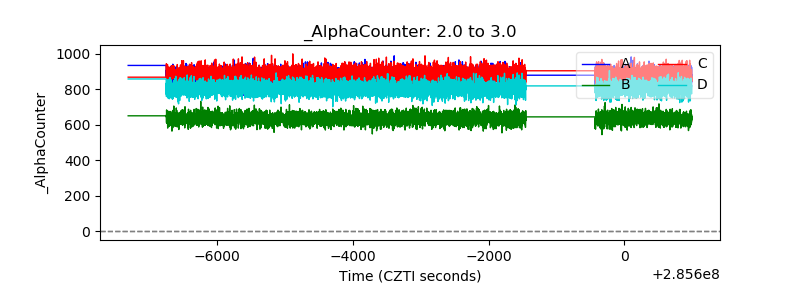 |
| _CPM_Rate | 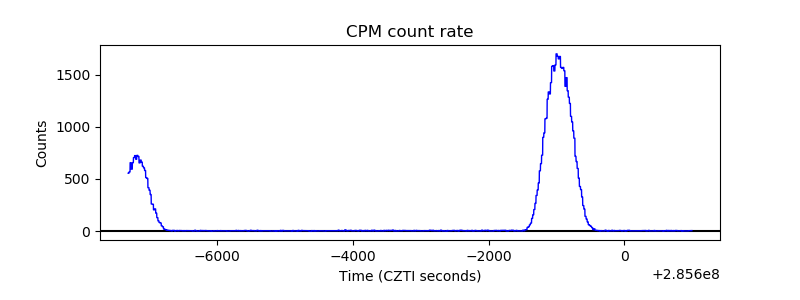 |
| CZT Counter | 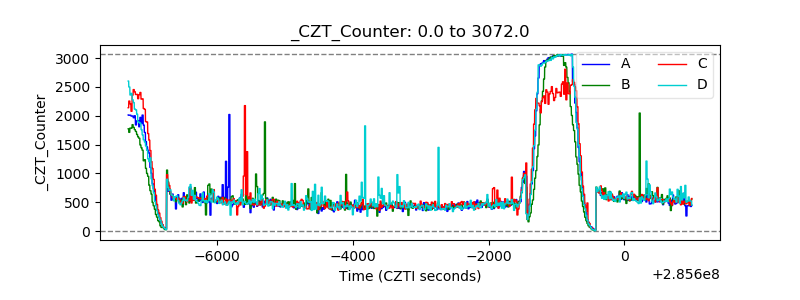 |
| +2.5 Volts monitor |  |
| +5 Volts monitor |  |
| _ROLL_ROT | 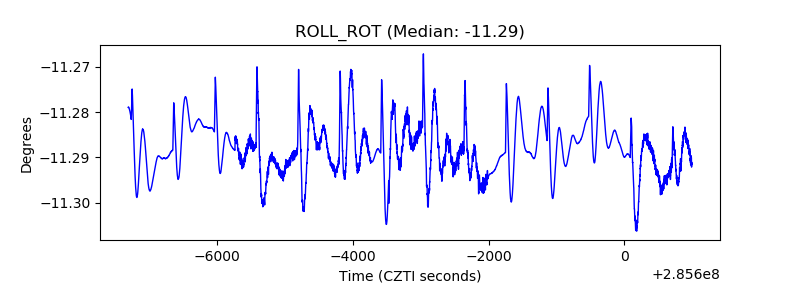 |
| _Roll_DEC | 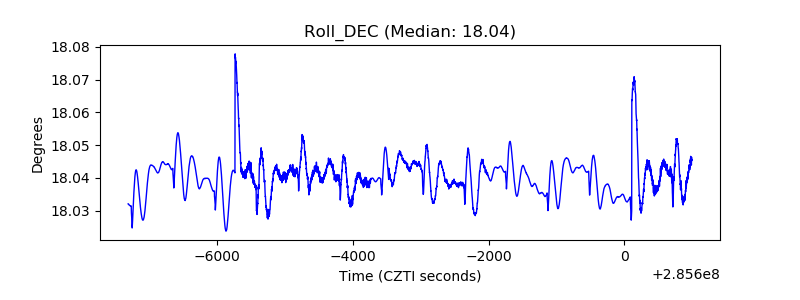 |
| _Roll_RA | 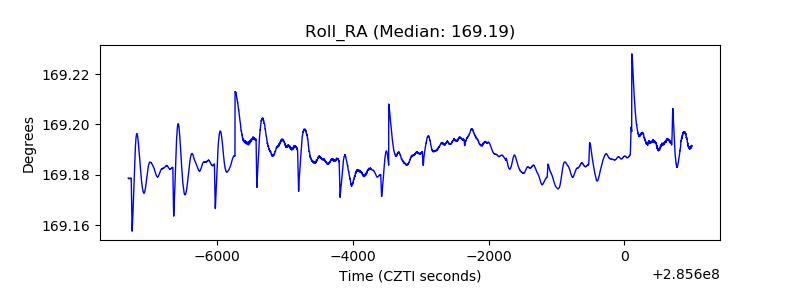 |
| Veto Counter | 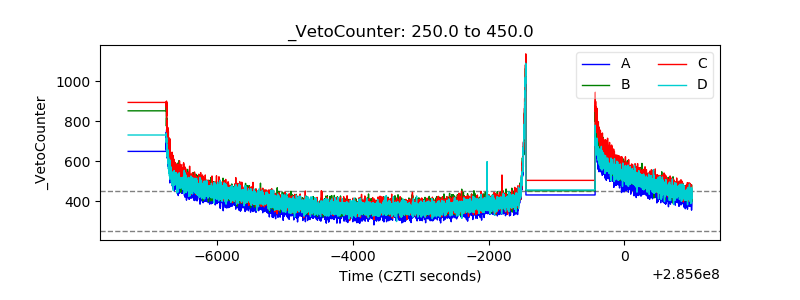 |