| Param | Original file | Final file |
|---|---|---|
| Filename | modeM0/AS1A05_109T01_9000002662_17902cztM0_level2.evt | modeM0/AS1A05_109T01_9000002662_17902cztM0_level2_quad_clean.evt |
| Size (bytes) | 464,431,680 | 69,690,240 |
| Size | 442.9 MB | 66.5 MB |
| Events in quadrant A | 3,232,183 | 418,710 |
| Events in quadrant B | 3,404,492 | 426,390 |
| Events in quadrant C | 3,313,479 | 410,323 |
| Events in quadrant D | 3,677,930 | 405,462 |
| Mode M0 | |||
|---|---|---|---|
| Quadrant | BADHDUFLAG | Total packets | Discarded packets |
| A | 0 | 13863 | 2 |
| B | 0 | 14440 | 2 |
| C | 0 | 14079 | 2 |
| D | 0 | 15292 | 2 |
| Mode SS | |||
|---|---|---|---|
| Quadrant | BADHDUFLAG | Total packets | Discarded packets |
| A | 0 | 130 | 0 |
| B | 0 | 130 | 0 |
| C | 0 | 130 | 0 |
| D | 0 | 130 | 0 |
| Mode M9 | |||
|---|---|---|---|
| Quadrant | BADHDUFLAG | Total packets | Discarded packets |
| A | 0 | 13 | 0 |
| B | 0 | 14 | 0 |
| C | 0 | 14 | 0 |
| D | 0 | 14 | 0 |
| Quadrant | Total seconds | Saturated seconds | Saturation percentage |
|---|---|---|---|
| A | 6443 | 56 | 0.869160% |
| B | 6443 | 71 | 1.101971% |
| C | 6443 | 89 | 1.381344% |
| D | 6443 | 78 | 1.210616% |
Noise dominated data is calculated using 1-second bins in cleaned event files. If a bin has >2000 counts, and if more than 50% of those come from <1% of pixels, then it is considered to be noise-dominated and hence unusable.
| Quadrant | # 1 sec bins | Bins with >0 counts | Bins with >2000 counts | High rate bins dominated by noise | Noise dominated (total time) | Noise dominated (detector-on time) | Marked lightcurve |
|---|---|---|---|---|---|---|---|
| A | 7598 | 6444 | 0 | 0 | 0.00% | 0.00% | 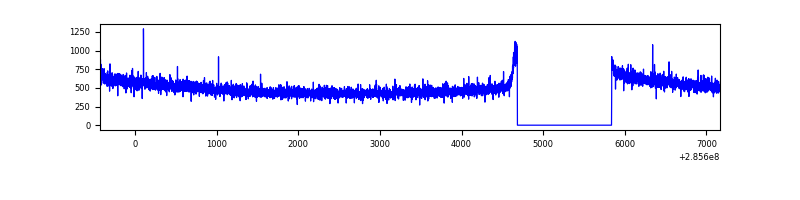 |
| B | 7598 | 6443 | 2 | 2 | 0.03% | 0.03% | 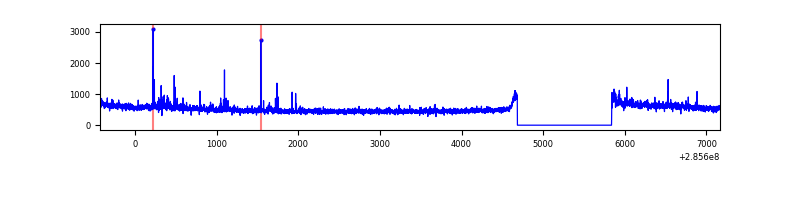 |
| C | 7598 | 6443 | 0 | 0 | 0.00% | 0.00% | 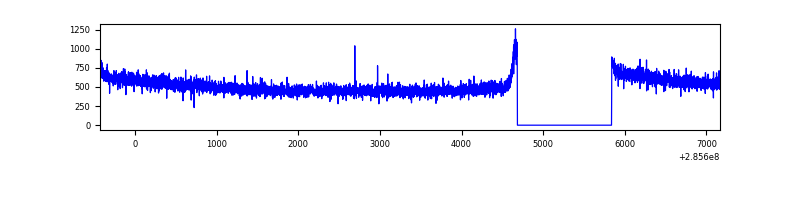 |
| D | 7598 | 6444 | 28 | 28 | 0.37% | 0.43% | 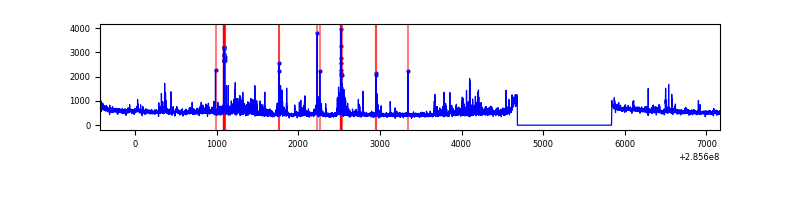 |
Top three noisy pixels from each quadrant. If the there are fewer than three noisy pixels in the level2.evt file, extra rows are filled as -1
| Pixel properties | Quadrant properties | ||||||
|---|---|---|---|---|---|---|---|
| Quadrant | DetID | PixID | Counts | Sigma | Mean | Median | Sigma |
| A | 15 | 174 | 11190 | 60.97 | 838 | 821 | 170.1 |
| A | 0 | 226 | 7319 | 38.21 | 838 | 821 | 170.1 |
| A | 3 | 137 | 6188 | 31.56 | 838 | 821 | 170.1 |
| B | 4 | 216 | 42436 | 261.2 | 840 | 821 | 159.3 |
| B | 0 | 189 | 35044 | 214.8 | 840 | 821 | 159.3 |
| B | 12 | 111 | 18181 | 108.96 | 840 | 821 | 159.3 |
| C | 14 | 238 | 126969 | 663.71 | 814 | 822 | 190.1 |
| C | 3 | 233 | 6263 | 28.63 | 814 | 822 | 190.1 |
| C | 13 | 61 | 5731 | 25.83 | 814 | 822 | 190.1 |
| D | 12 | 110 | 330991 | 1634.65 | 826 | 803 | 202.0 |
| D | 13 | 168 | 76687 | 375.68 | 826 | 803 | 202.0 |
| D | 10 | 70 | 76648 | 375.48 | 826 | 803 | 202.0 |
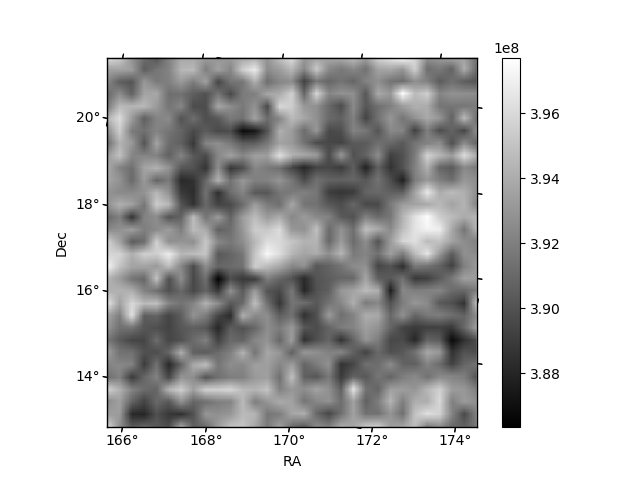
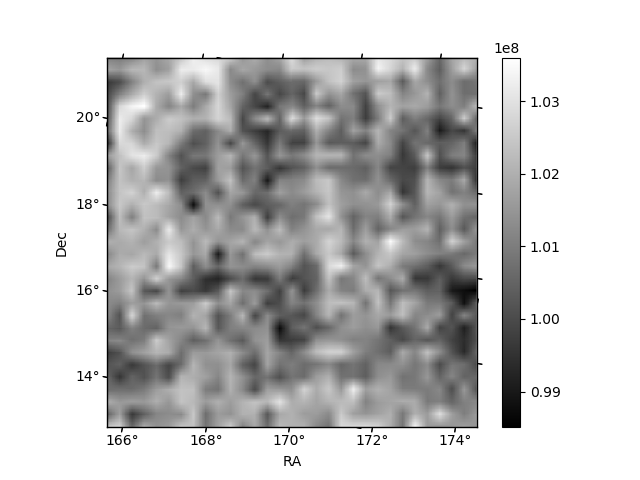
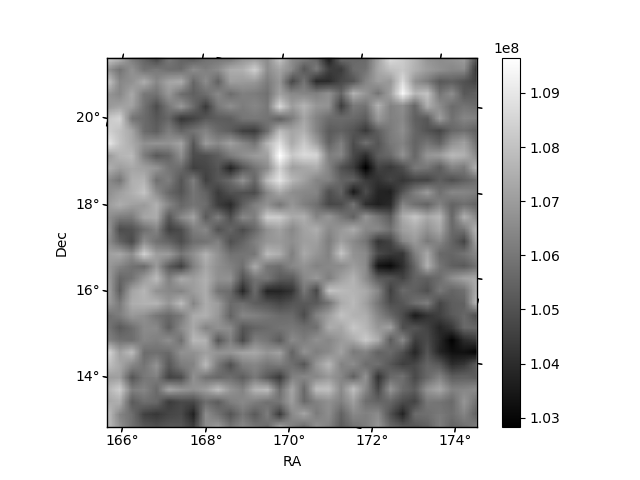
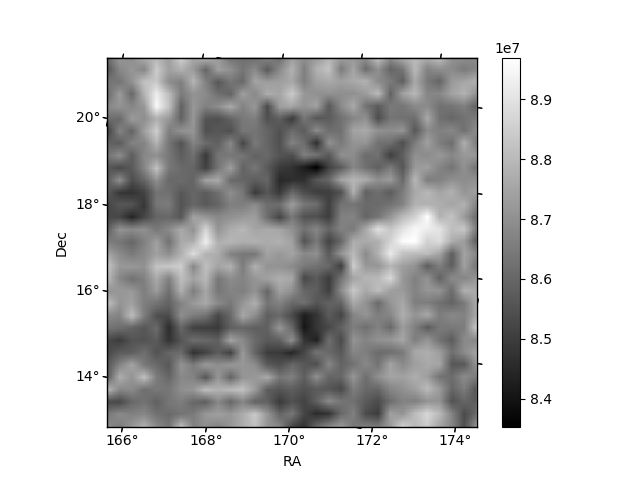
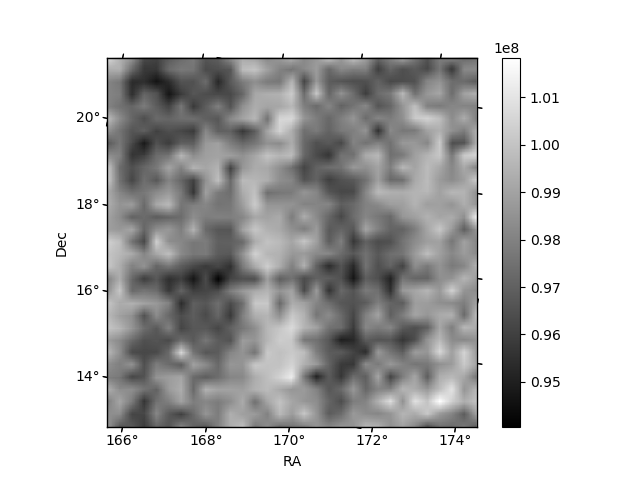
Histogram calculated using DETX and DETY for each event in the final _common_clean file
| Quadrant A | 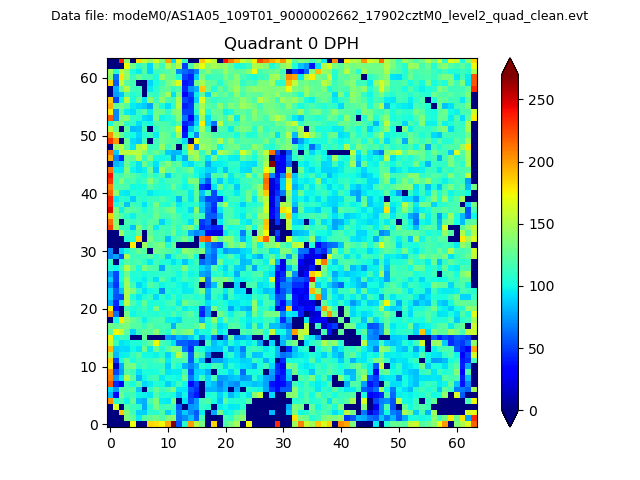 |
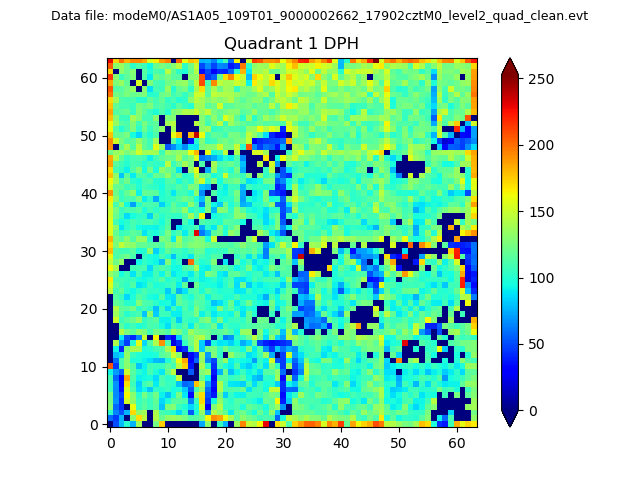 |
Quadrant B |
|---|---|---|---|
| Quadrant D | 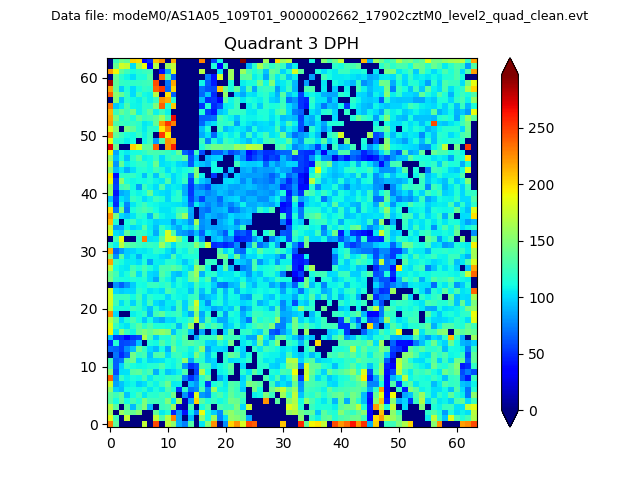 |
 |
Quadrant C |
| Plot type | Count rate plots | Images |
|---|---|---|
| Comparison with Poisson distribution Blue bars denote a histogram of data divided into 1 sec bins. Red curve is a Poisson curve with rate = median count rate of data. |
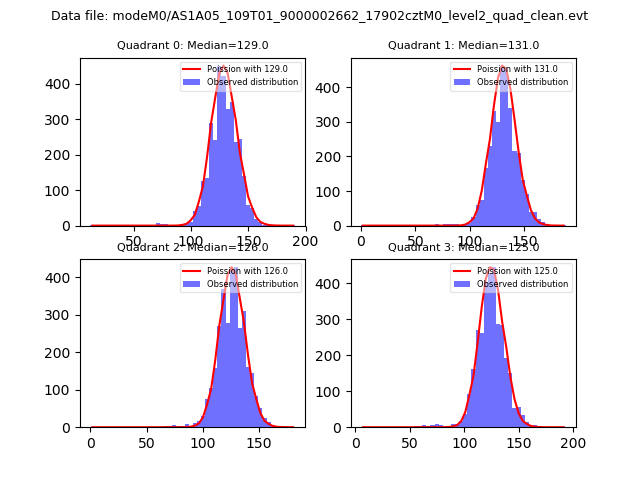 |
 |
| Quadrant-wise count rates Data is divided into 100 sec bins |
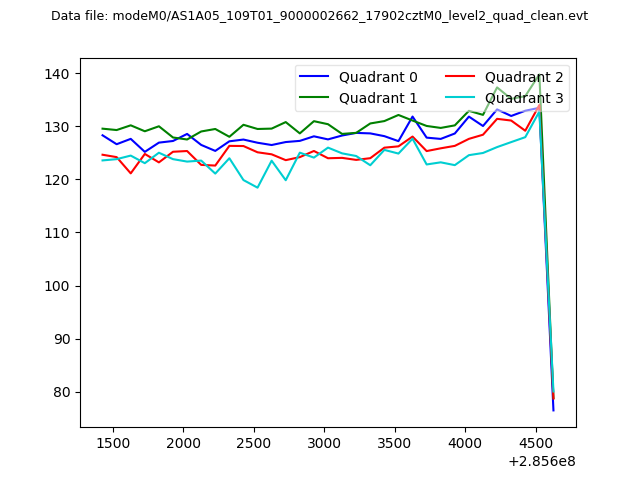 |
|
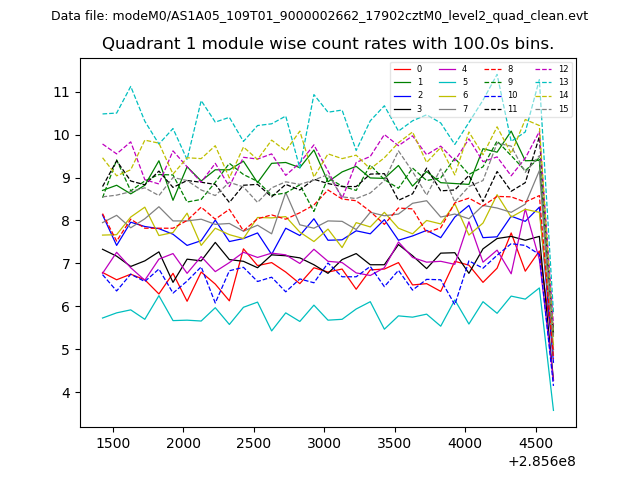
| Module-wise count rates for Quadrant A Data is divided into 100 sec bins |
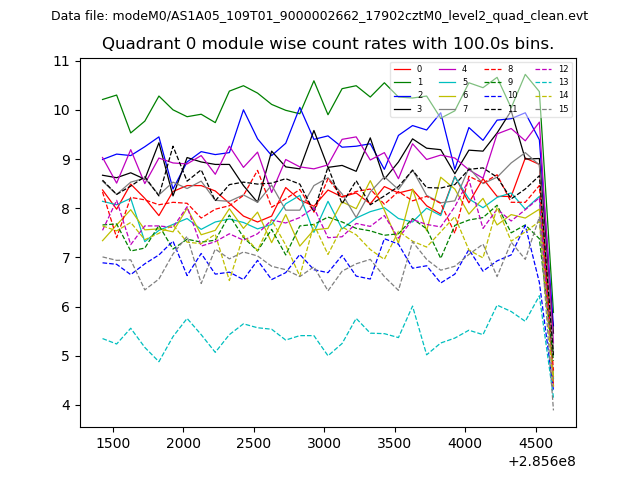 |
 |
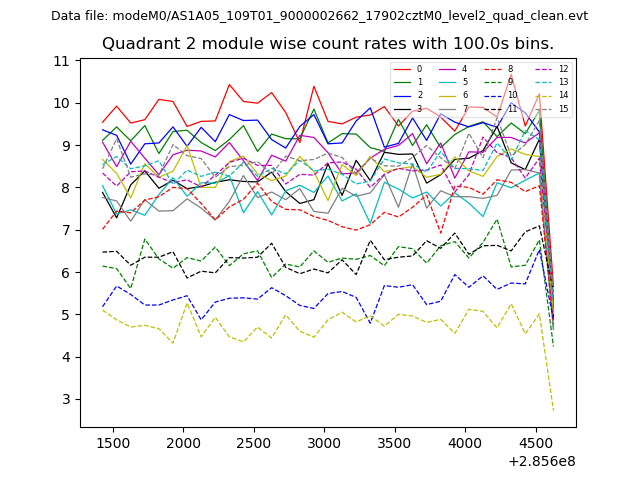
| Module-wise count rates for Quadrant B Data is divided into 100 sec bins |
 |
 |
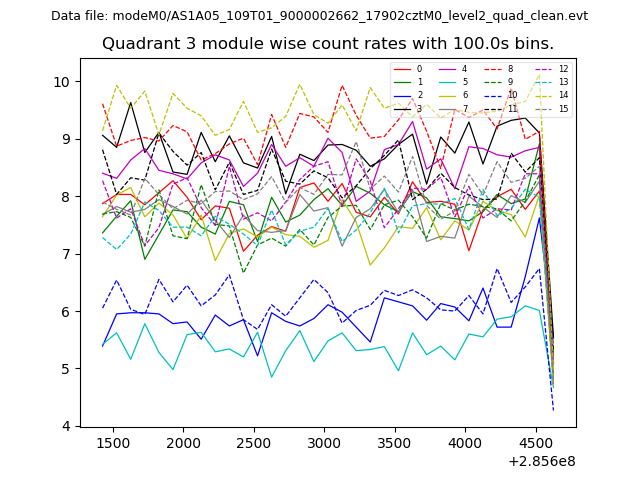
| Module-wise count rates for Quadrant C Data is divided into 100 sec bins |
 |
 |
| Module-wise count rates for Quadrant D Data is divided into 100 sec bins |
 |
 |
| Parameter | Plot |
|---|---|
| CZT HV Monitor | 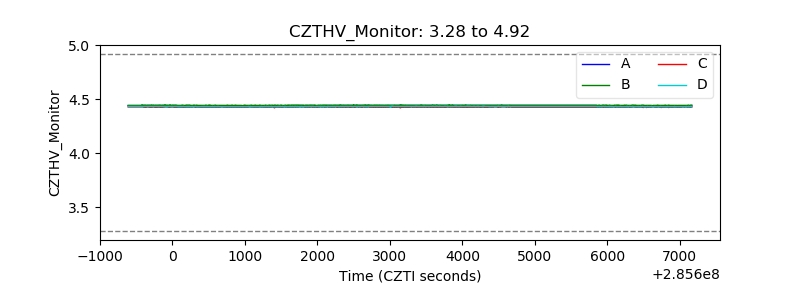 |
| D_VDD | 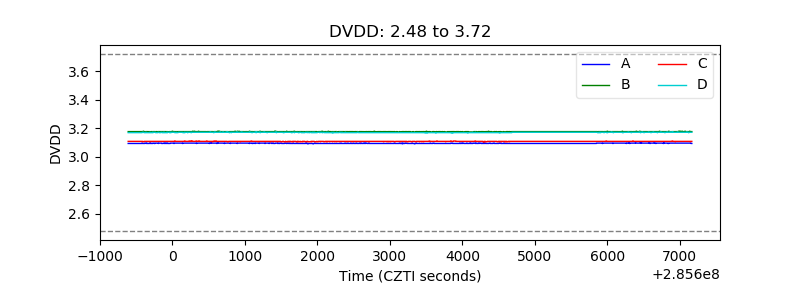 |
| Temperature 1 | 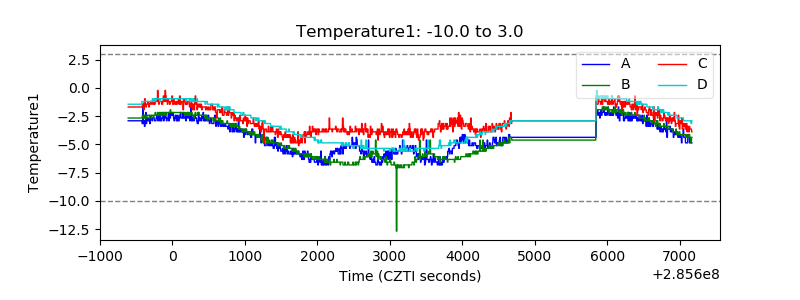 |
| Veto HV Monitor | 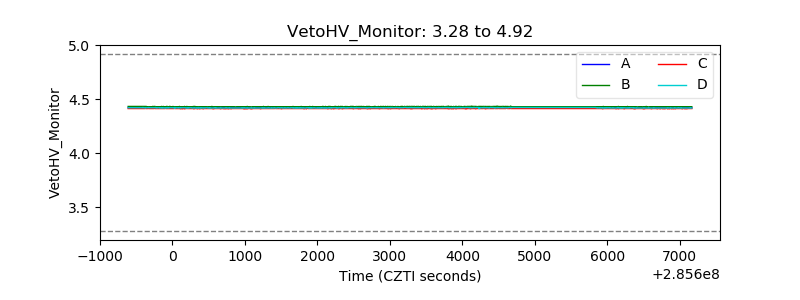 |
| Veto LLD | 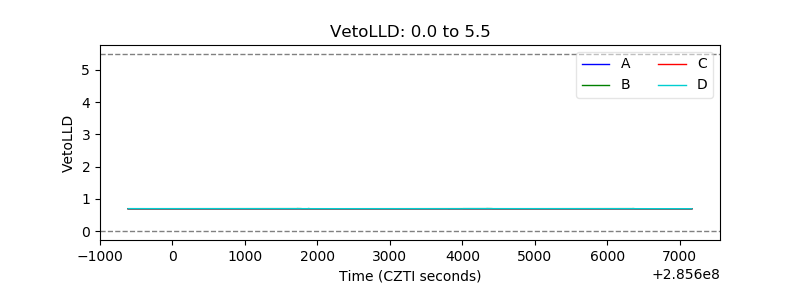 |
| Alpha Counter | 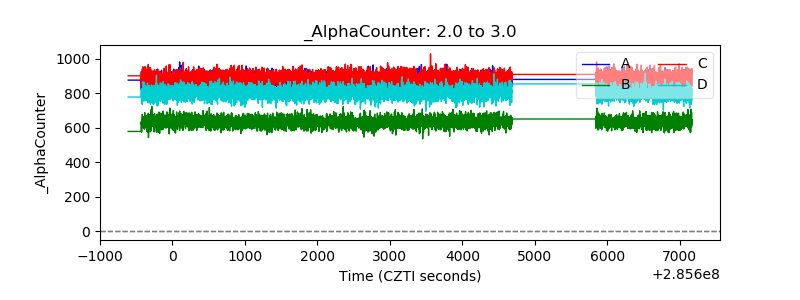 |
| _CPM_Rate | 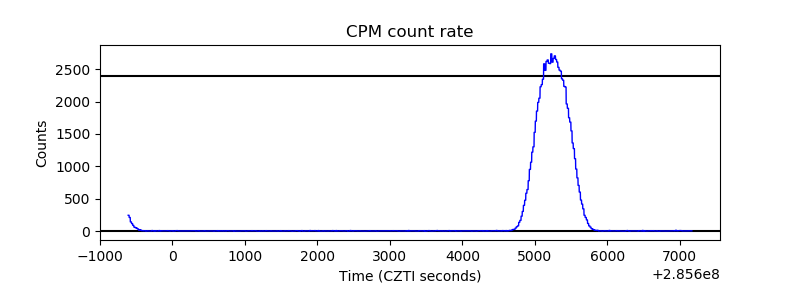 |
| CZT Counter |  |
| +2.5 Volts monitor |  |
| +5 Volts monitor |  |
| _ROLL_ROT | 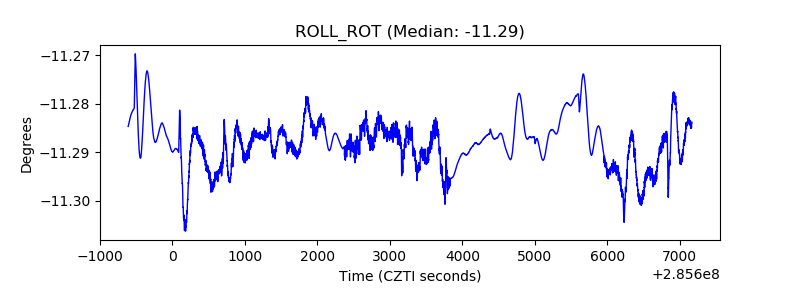 |
| _Roll_DEC | 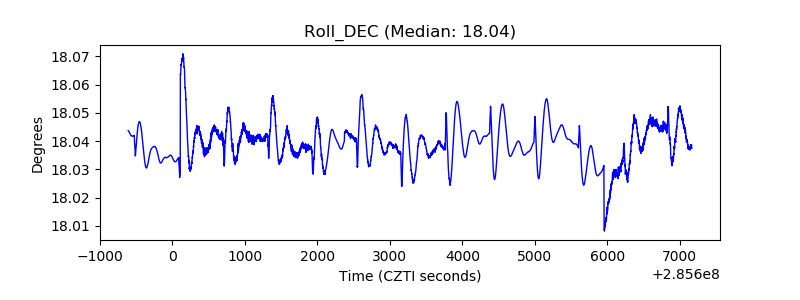 |
| _Roll_RA | 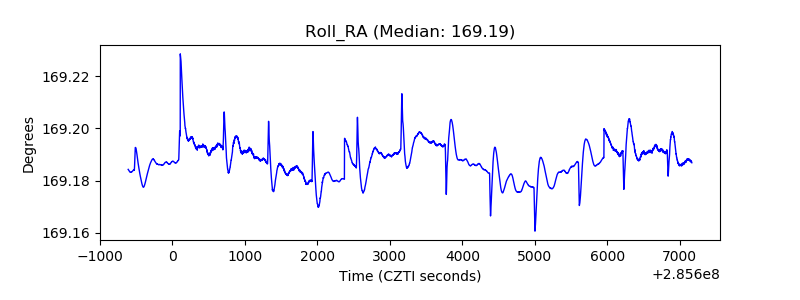 |
| Veto Counter | 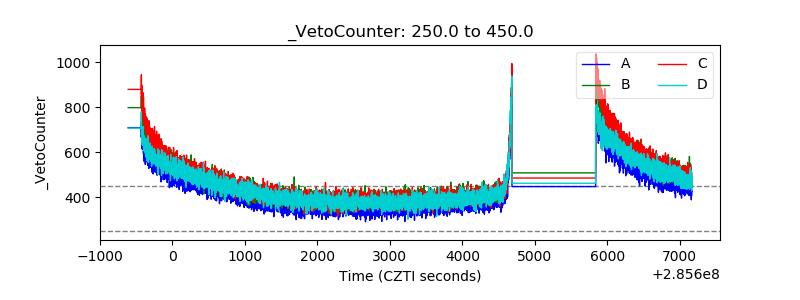 |