| Param | Original file | Final file |
|---|---|---|
| Filename | modeM0/AS1A05_109T01_9000002662_17903cztM0_level2.evt | modeM0/AS1A05_109T01_9000002662_17903cztM0_level2_quad_clean.evt |
| Size (bytes) | 466,856,640 | 83,016,000 |
| Size | 445.2 MB | 79.2 MB |
| Events in quadrant A | 3,428,443 | 516,566 |
| Events in quadrant B | 3,480,281 | 533,904 |
| Events in quadrant C | 3,356,651 | 516,358 |
| Events in quadrant D | 3,443,979 | 505,757 |
| Mode M0 | |||
|---|---|---|---|
| Quadrant | BADHDUFLAG | Total packets | Discarded packets |
| A | 0 | 14409 | 2 |
| B | 0 | 14592 | 2 |
| C | 0 | 14142 | 3 |
| D | 0 | 14576 | 2 |
| Mode SS | |||
|---|---|---|---|
| Quadrant | BADHDUFLAG | Total packets | Discarded packets |
| A | 0 | 130 | 0 |
| B | 0 | 130 | 0 |
| C | 0 | 130 | 0 |
| D | 0 | 130 | 0 |
| Mode M9 | |||
|---|---|---|---|
| Quadrant | BADHDUFLAG | Total packets | Discarded packets |
| A | 0 | 22 | 0 |
| B | 0 | 23 | 0 |
| C | 0 | 23 | 0 |
| D | 0 | 23 | 0 |
| Quadrant | Total seconds | Saturated seconds | Saturation percentage |
|---|---|---|---|
| A | 6319 | 116 | 1.835734% |
| B | 6319 | 59 | 0.933692% |
| C | 6318 | 96 | 1.519468% |
| D | 6318 | 52 | 0.823045% |
Noise dominated data is calculated using 1-second bins in cleaned event files. If a bin has >2000 counts, and if more than 50% of those come from <1% of pixels, then it is considered to be noise-dominated and hence unusable.
| Quadrant | # 1 sec bins | Bins with >0 counts | Bins with >2000 counts | High rate bins dominated by noise | Noise dominated (total time) | Noise dominated (detector-on time) | Marked lightcurve |
|---|---|---|---|---|---|---|---|
| A | 7584 | 6320 | 55 | 55 | 0.73% | 0.87% | 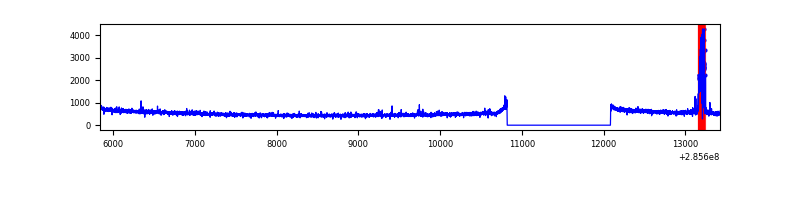 |
| B | 7584 | 6320 | 1 | 1 | 0.01% | 0.02% | 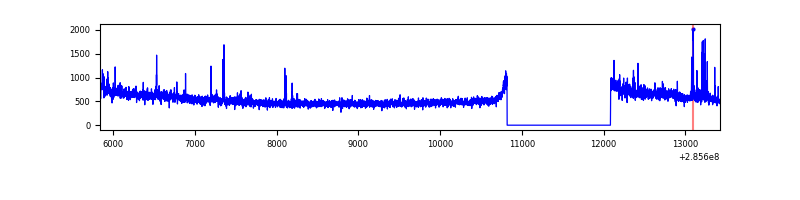 |
| C | 7583 | 6319 | 2 | 2 | 0.03% | 0.03% | 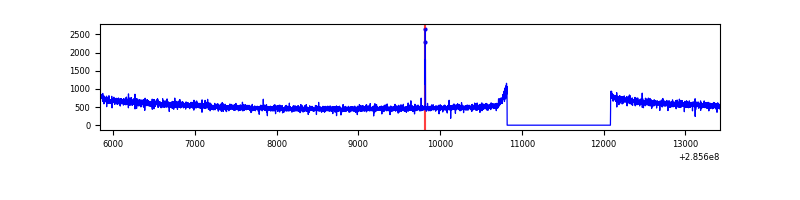 |
| D | 7583 | 6319 | 7 | 7 | 0.09% | 0.11% | 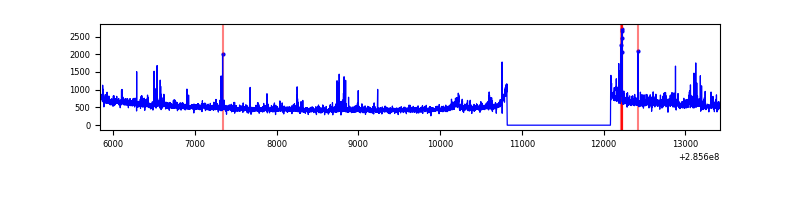 |
Top three noisy pixels from each quadrant. If the there are fewer than three noisy pixels in the level2.evt file, extra rows are filled as -1
| Pixel properties | Quadrant properties | ||||||
|---|---|---|---|---|---|---|---|
| Quadrant | DetID | PixID | Counts | Sigma | Mean | Median | Sigma |
| A | 15 | 174 | 194529 | 1145.36 | 841 | 823 | 169.1 |
| A | 0 | 226 | 7437 | 39.1 | 841 | 823 | 169.1 |
| A | 12 | 194 | 6150 | 31.5 | 841 | 823 | 169.1 |
| B | 0 | 189 | 80776 | 501.53 | 850 | 831 | 159.4 |
| B | 0 | 197 | 31135 | 190.11 | 850 | 831 | 159.4 |
| B | 12 | 111 | 17855 | 106.8 | 850 | 831 | 159.4 |
| C | 14 | 238 | 128321 | 667.66 | 823 | 831 | 191.0 |
| C | 9 | 54 | 7950 | 37.28 | 823 | 831 | 191.0 |
| C | 3 | 233 | 6455 | 29.45 | 823 | 831 | 191.0 |
| D | 5 | 222 | 64353 | 313.78 | 833 | 811 | 202.5 |
| D | 12 | 110 | 57679 | 280.82 | 833 | 811 | 202.5 |
| D | 13 | 168 | 51167 | 248.66 | 833 | 811 | 202.5 |
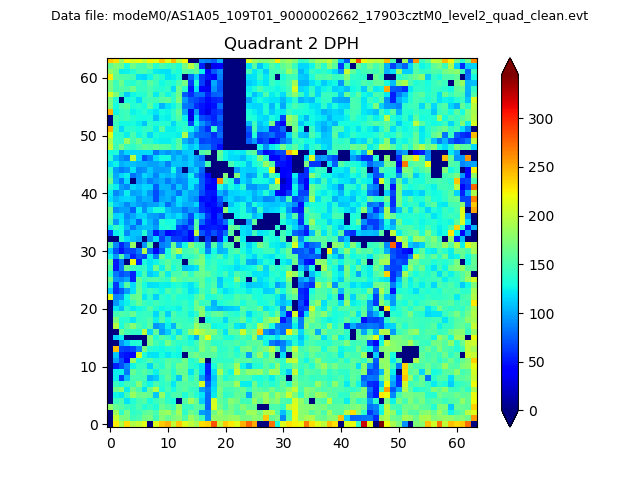
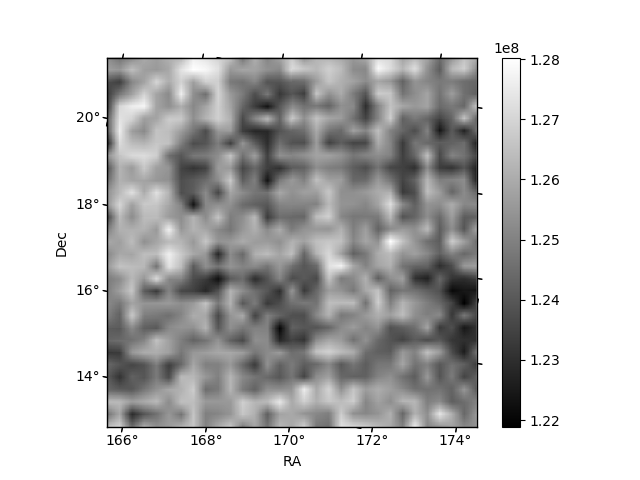
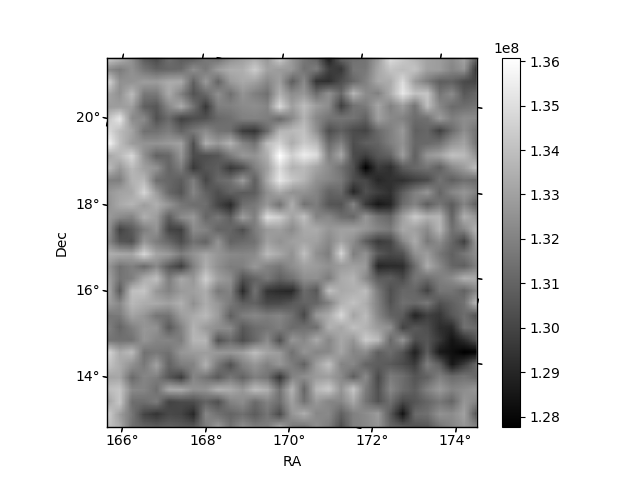
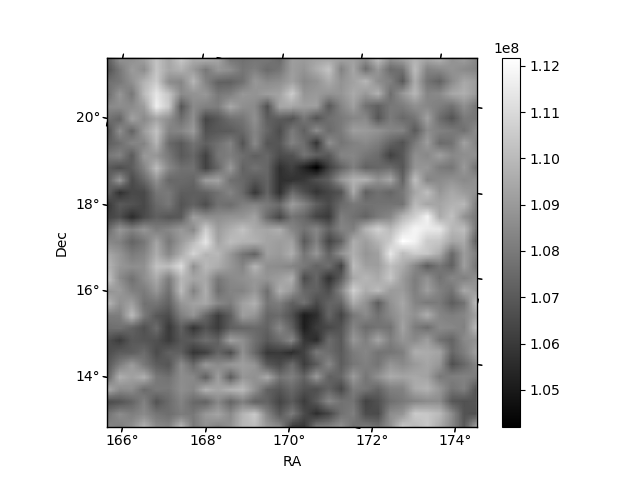
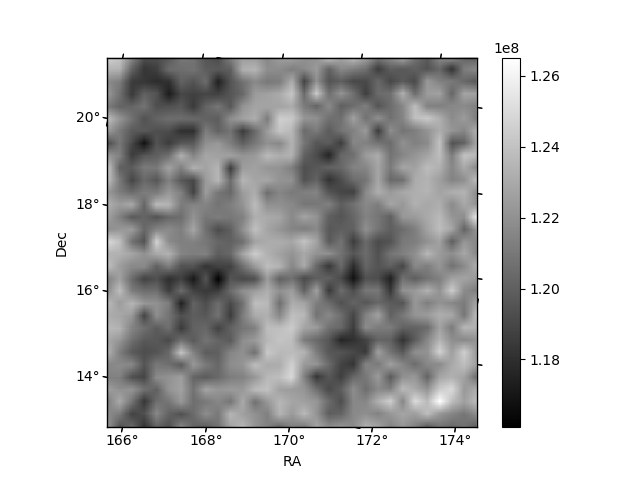
Histogram calculated using DETX and DETY for each event in the final _common_clean file
| Quadrant A | 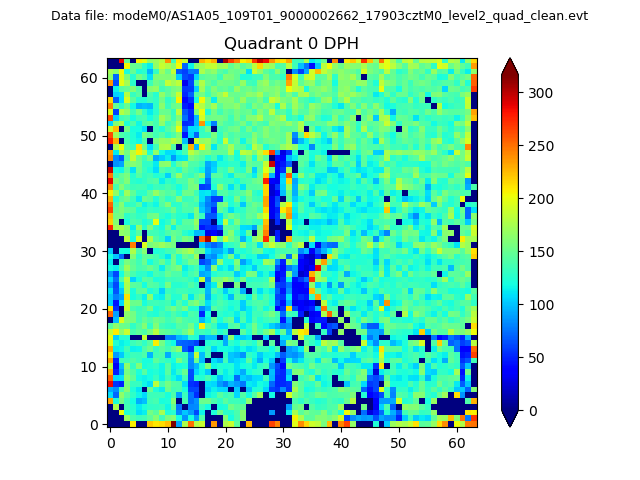 |
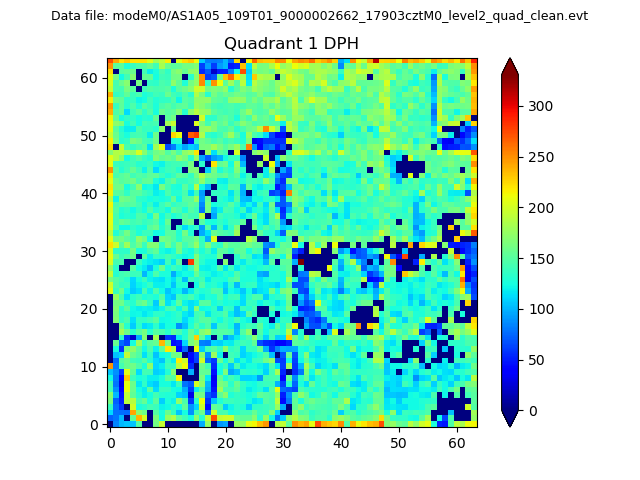 |
Quadrant B |
|---|---|---|---|
| Quadrant D | 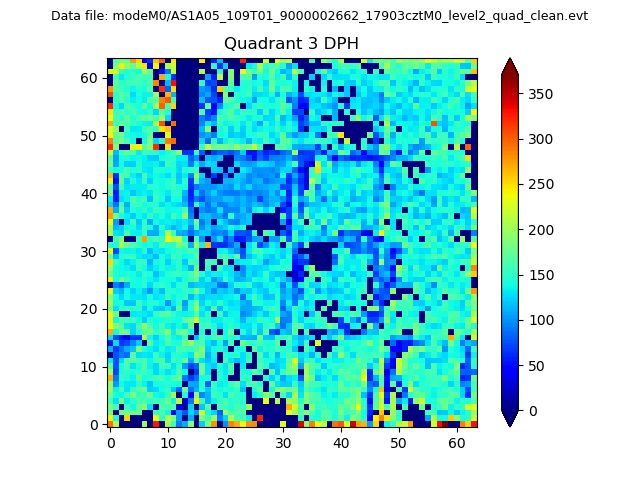 |
 |
Quadrant C |
| Plot type | Count rate plots | Images |
|---|---|---|
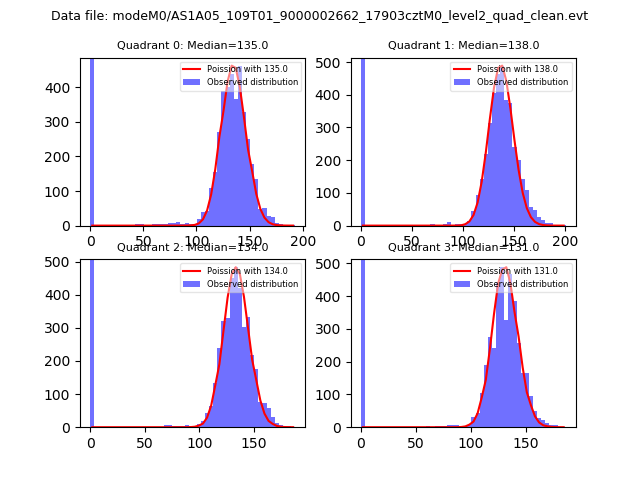
| Comparison with Poisson distribution Blue bars denote a histogram of data divided into 1 sec bins. Red curve is a Poisson curve with rate = median count rate of data. |
 |
 |
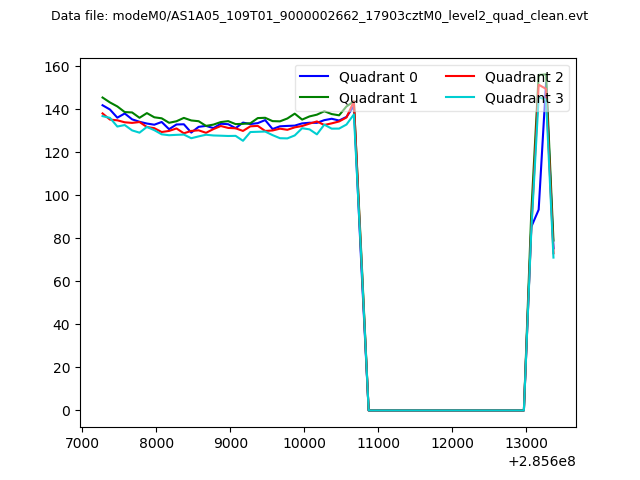
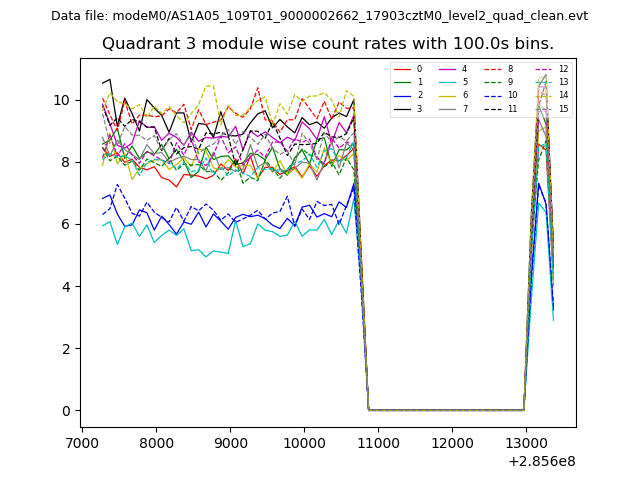
| Quadrant-wise count rates Data is divided into 100 sec bins |
 |
|
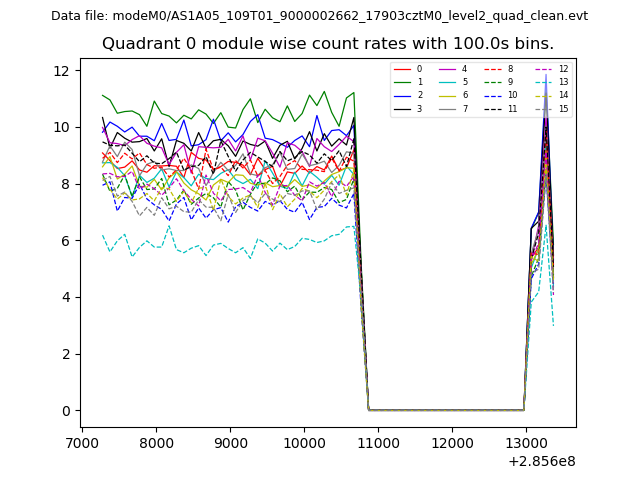
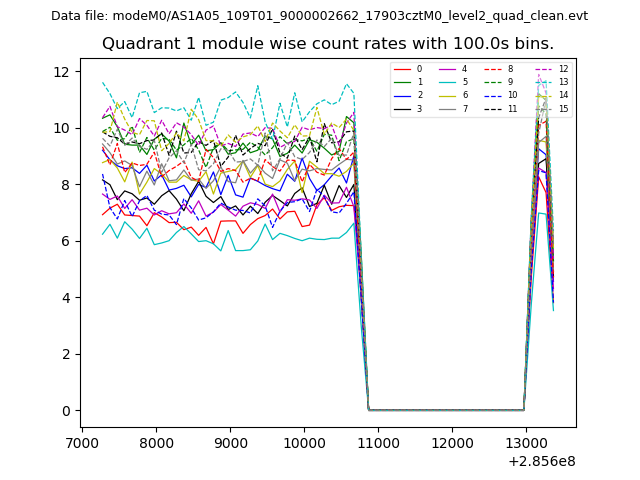
| Module-wise count rates for Quadrant A Data is divided into 100 sec bins |
 |
 |
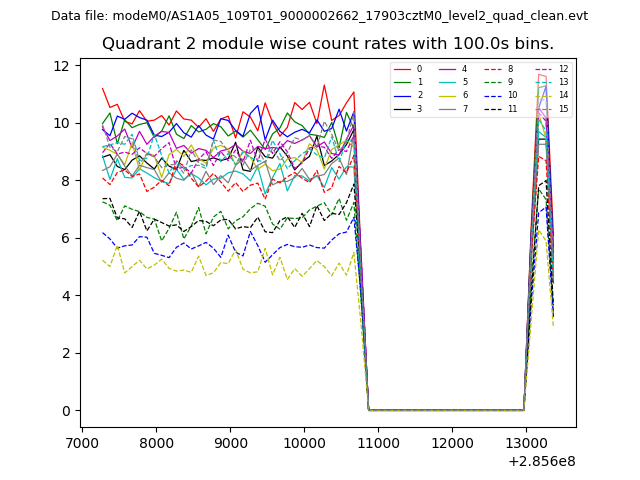
| Module-wise count rates for Quadrant B Data is divided into 100 sec bins |
 |
 |
| Module-wise count rates for Quadrant C Data is divided into 100 sec bins |
 |
 |
| Module-wise count rates for Quadrant D Data is divided into 100 sec bins |
 |
 |
| Parameter | Plot |
|---|---|
| CZT HV Monitor | 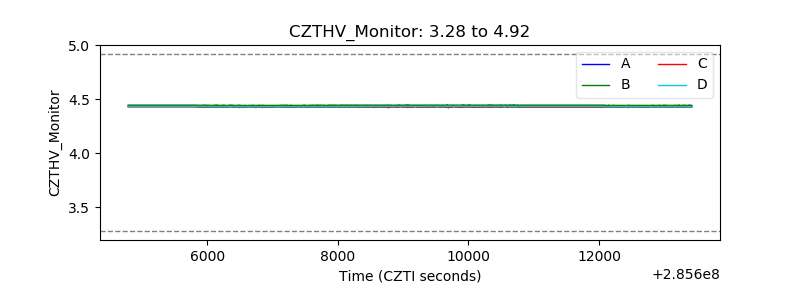 |
| D_VDD | 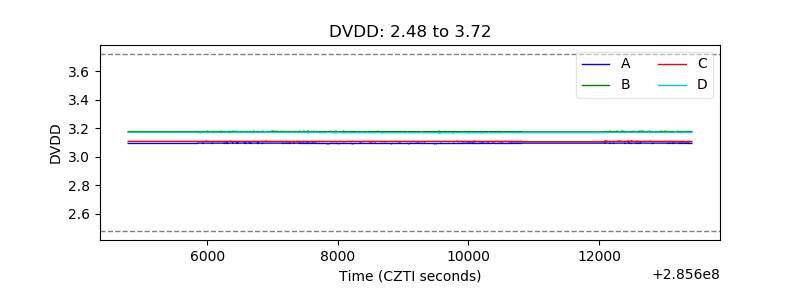 |
| Temperature 1 | 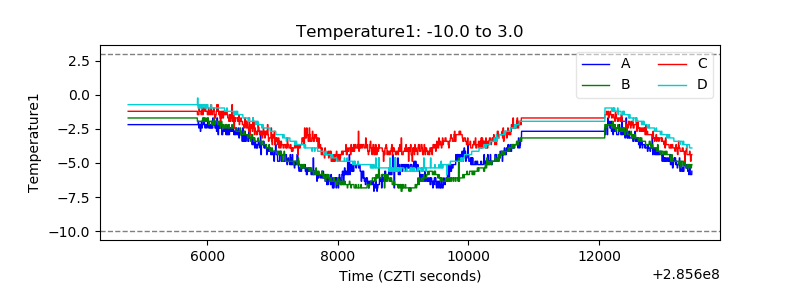 |
| Veto HV Monitor | 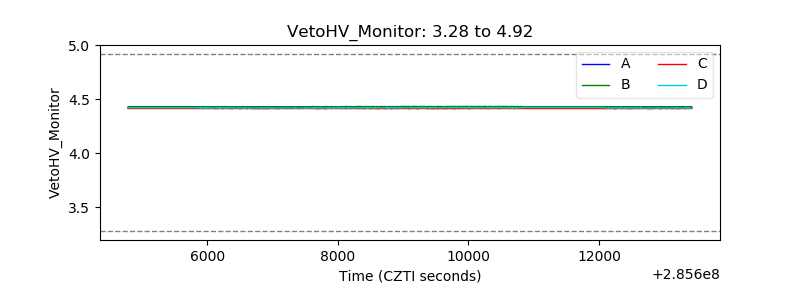 |
| Veto LLD | 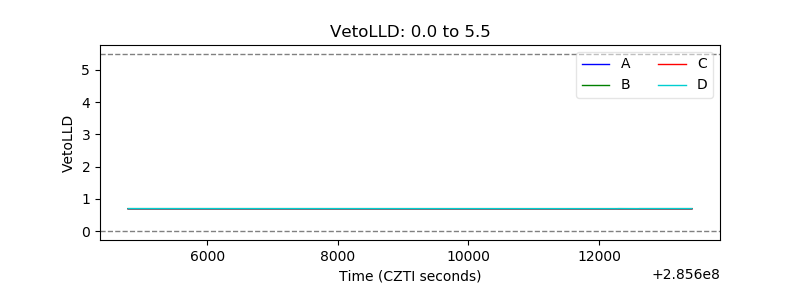 |
| Alpha Counter | 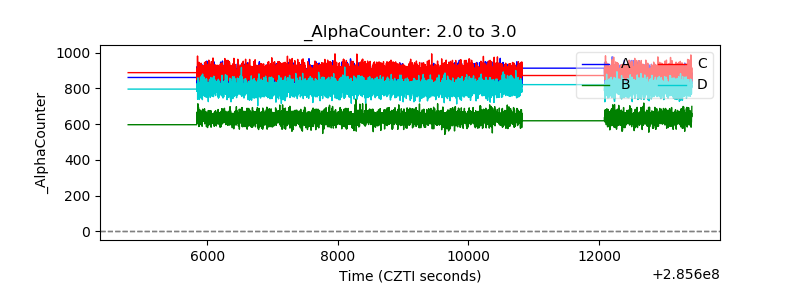 |
| _CPM_Rate | 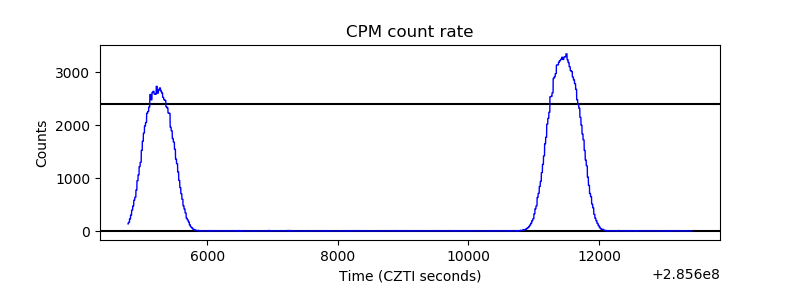 |
| CZT Counter | 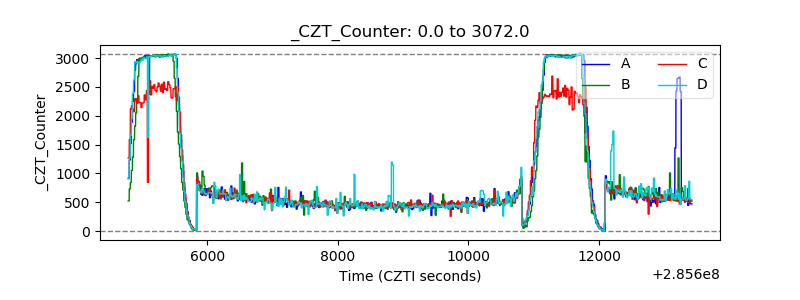 |
| +2.5 Volts monitor |  |
| +5 Volts monitor |  |
| _ROLL_ROT |  |
| _Roll_DEC | 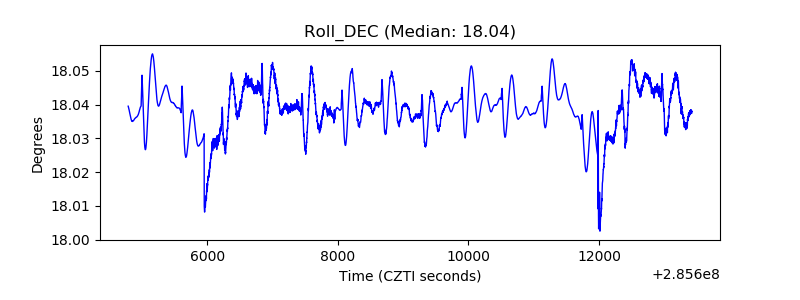 |
| _Roll_RA | 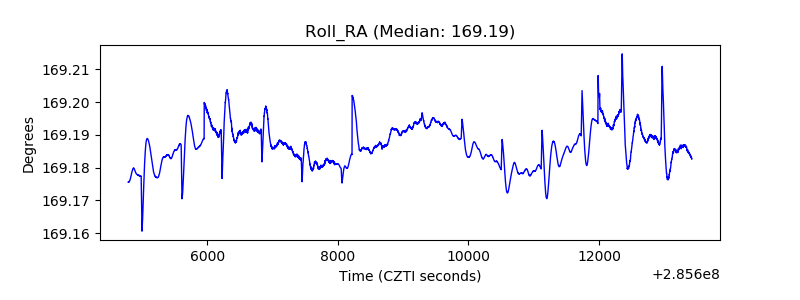 |
| Veto Counter | 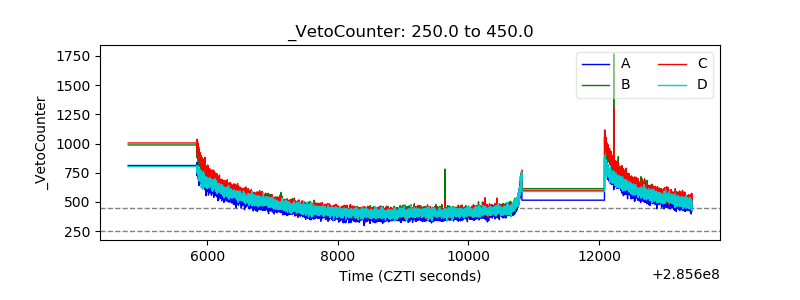 |