| Param | Original file | Final file |
|---|---|---|
| Filename | modeM0/AS1A05_109T01_9000002662_17904cztM0_level2.evt | modeM0/AS1A05_109T01_9000002662_17904cztM0_level2_quad_clean.evt |
| Size (bytes) | 190,247,040 | 35,703,360 |
| Size | 181.4 MB | 34.0 MB |
| Events in quadrant A | 1,372,025 | 223,980 |
| Events in quadrant B | 1,353,520 | 237,188 |
| Events in quadrant C | 1,265,744 | 226,907 |
| Events in quadrant D | 1,603,979 | 218,722 |
| Mode M0 | |||
|---|---|---|---|
| Quadrant | BADHDUFLAG | Total packets | Discarded packets |
| A | 0 | 5672 | 0 |
| B | 0 | 5625 | 0 |
| C | 0 | 5291 | 0 |
| D | 0 | 6420 | 0 |
| Mode SS | |||
|---|---|---|---|
| Quadrant | BADHDUFLAG | Total packets | Discarded packets |
| A | 0 | 48 | 0 |
| B | 0 | 48 | 0 |
| C | 0 | 48 | 0 |
| D | 0 | 48 | 0 |
| Quadrant | Total seconds | Saturated seconds | Saturation percentage |
|---|---|---|---|
| A | 2418 | 67 | 2.770885% |
| B | 2419 | 11 | 0.454733% |
| C | 2419 | 17 | 0.702770% |
| D | 2419 | 16 | 0.661430% |
Noise dominated data is calculated using 1-second bins in cleaned event files. If a bin has >2000 counts, and if more than 50% of those come from <1% of pixels, then it is considered to be noise-dominated and hence unusable.
| Quadrant | # 1 sec bins | Bins with >0 counts | Bins with >2000 counts | High rate bins dominated by noise | Noise dominated (total time) | Noise dominated (detector-on time) | Marked lightcurve |
|---|---|---|---|---|---|---|---|
| A | 2418 | 2418 | 55 | 55 | 2.27% | 2.27% |  |
| B | 2419 | 2419 | 2 | 2 | 0.08% | 0.08% |  |
| C | 2419 | 2419 | 0 | 0 | 0.00% | 0.00% |  |
| D | 2419 | 2419 | 17 | 17 | 0.70% | 0.70% |  |
Top three noisy pixels from each quadrant. If the there are fewer than three noisy pixels in the level2.evt file, extra rows are filled as -1
| Pixel properties | Quadrant properties | ||||||
|---|---|---|---|---|---|---|---|
| Quadrant | DetID | PixID | Counts | Sigma | Mean | Median | Sigma |
| A | 15 | 174 | 172480 | 2690.03 | 312 | 306 | 64.0 |
| A | 0 | 226 | 2696 | 37.34 | 312 | 306 | 64.0 |
| A | 12 | 194 | 2191 | 29.45 | 312 | 306 | 64.0 |
| B | 0 | 189 | 36579 | 594.22 | 321 | 314 | 61.0 |
| B | 0 | 197 | 27551 | 446.29 | 321 | 314 | 61.0 |
| B | 0 | 244 | 18224 | 293.46 | 321 | 314 | 61.0 |
| C | 14 | 238 | 49687 | 671.81 | 311 | 315 | 73.5 |
| C | 13 | 61 | 2217 | 25.88 | 311 | 315 | 73.5 |
| C | 3 | 233 | 1575 | 17.14 | 311 | 315 | 73.5 |
| D | 5 | 222 | 217723 | 2841.03 | 310 | 300 | 76.5 |
| D | 12 | 110 | 155269 | 2024.96 | 310 | 300 | 76.5 |
| D | 13 | 168 | 29058 | 375.77 | 310 | 300 | 76.5 |
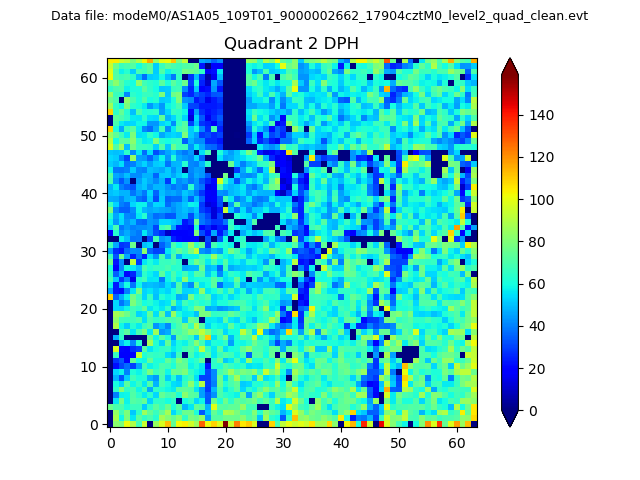
Histogram calculated using DETX and DETY for each event in the final _common_clean file
| Quadrant A | 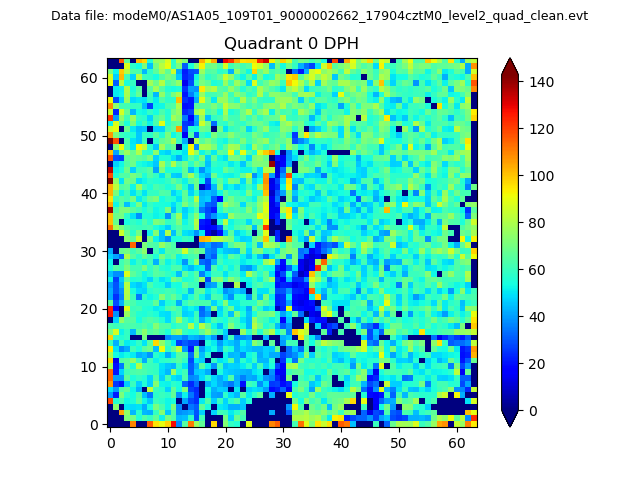 |
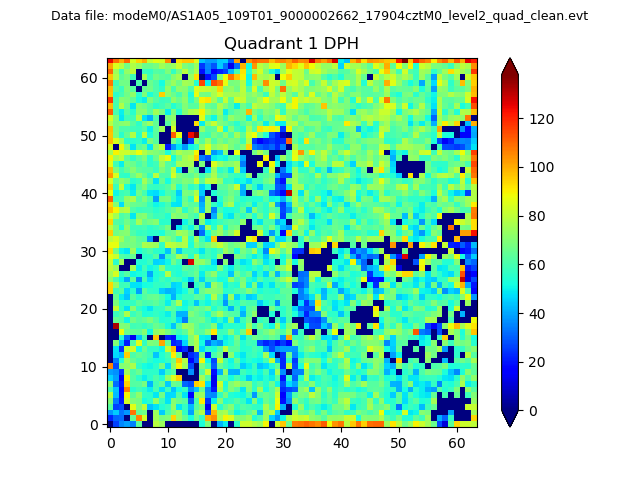 |
Quadrant B |
|---|---|---|---|
| Quadrant D | 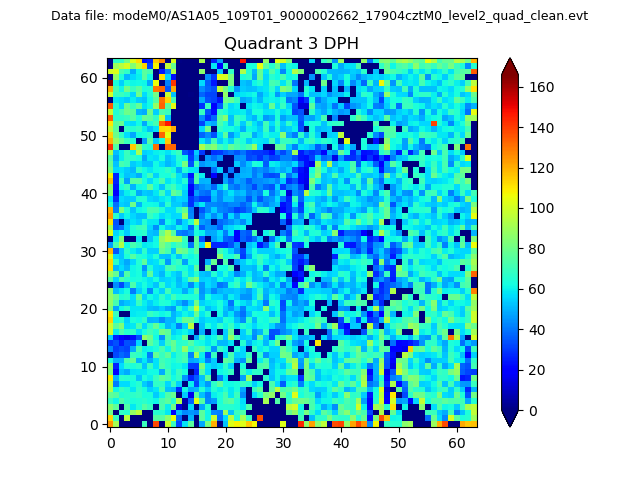 |
 |
Quadrant C |
| Plot type | Count rate plots | Images |
|---|---|---|
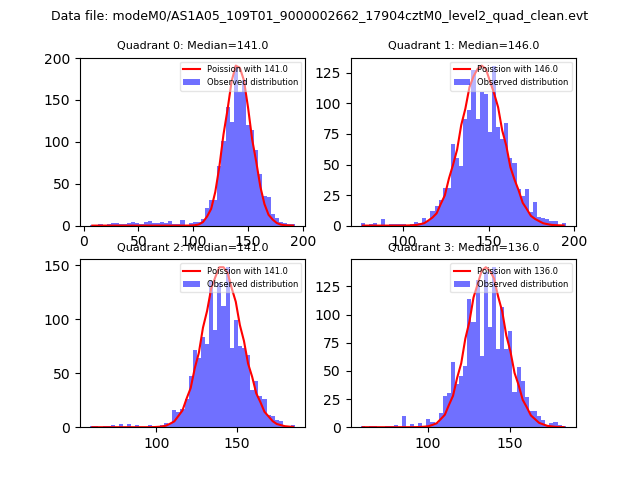
| Comparison with Poisson distribution Blue bars denote a histogram of data divided into 1 sec bins. Red curve is a Poisson curve with rate = median count rate of data. |
 |
 |
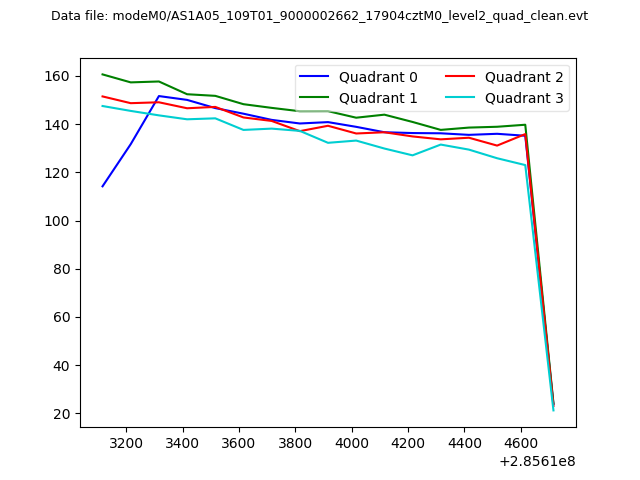
| Quadrant-wise count rates Data is divided into 100 sec bins |
 |
|
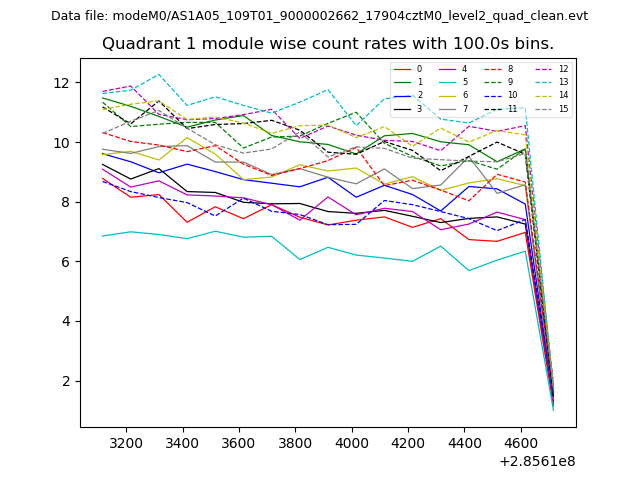
| Module-wise count rates for Quadrant A Data is divided into 100 sec bins |
 |
 |
| Module-wise count rates for Quadrant B Data is divided into 100 sec bins |
 |
 |
| Module-wise count rates for Quadrant C Data is divided into 100 sec bins |
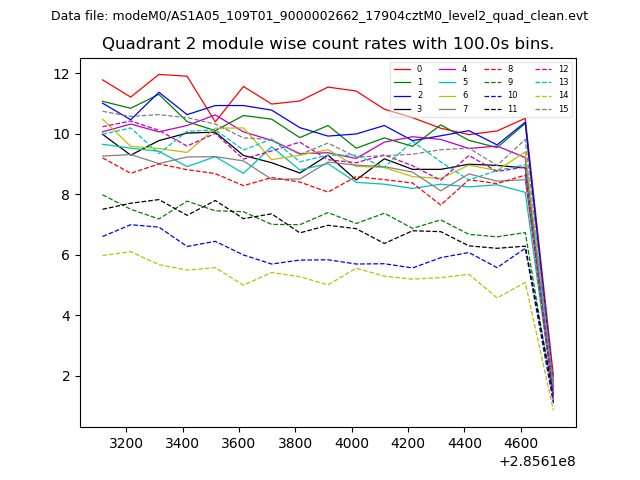 |
 |
| Module-wise count rates for Quadrant D Data is divided into 100 sec bins |
 |
 |
| Parameter | Plot |
|---|---|
| CZT HV Monitor | 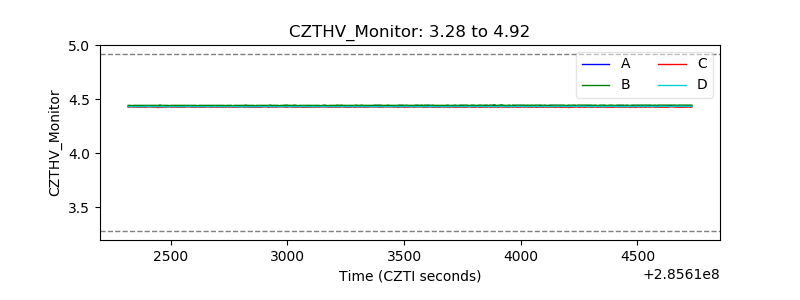 |
| D_VDD | 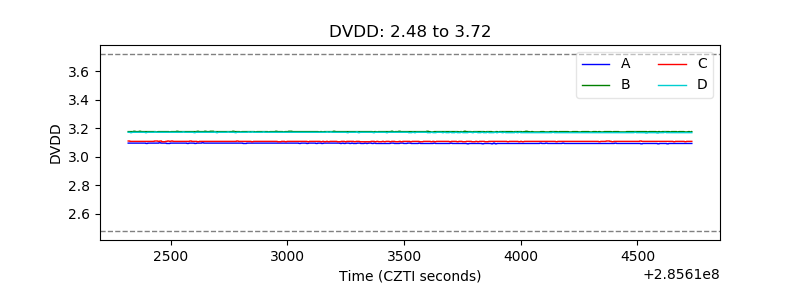 |
| Temperature 1 | 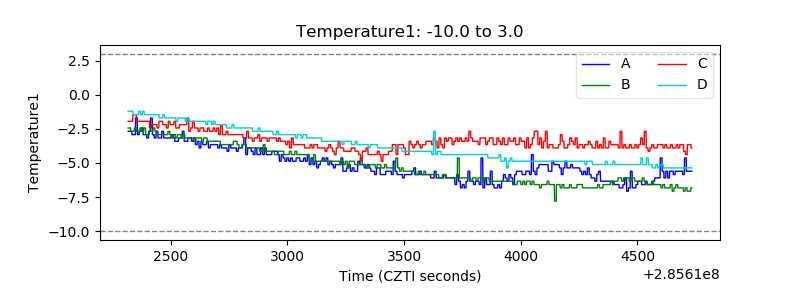 |
| Veto HV Monitor | 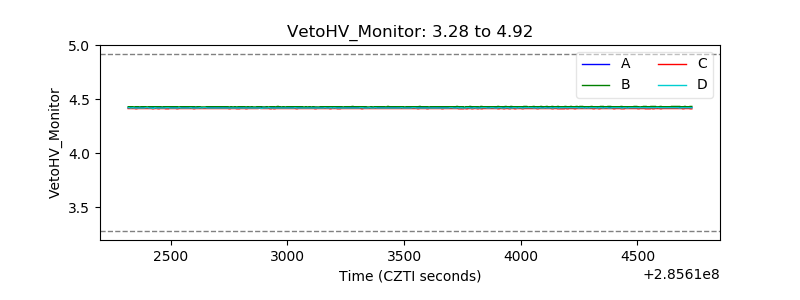 |
| Veto LLD | 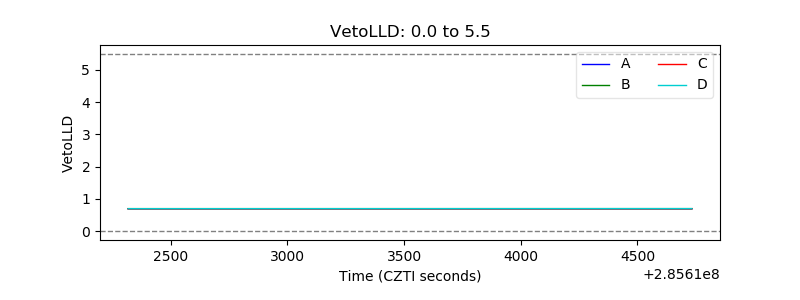 |
| Alpha Counter | 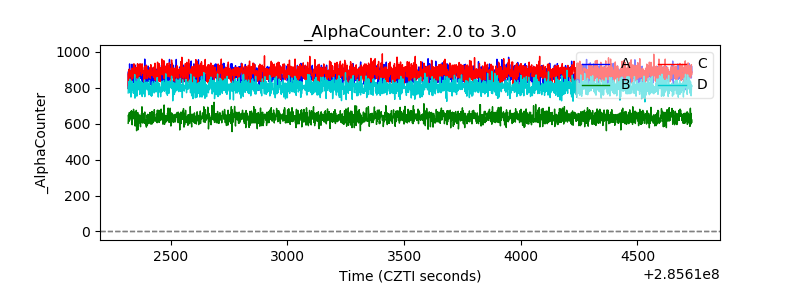 |
| _CPM_Rate | 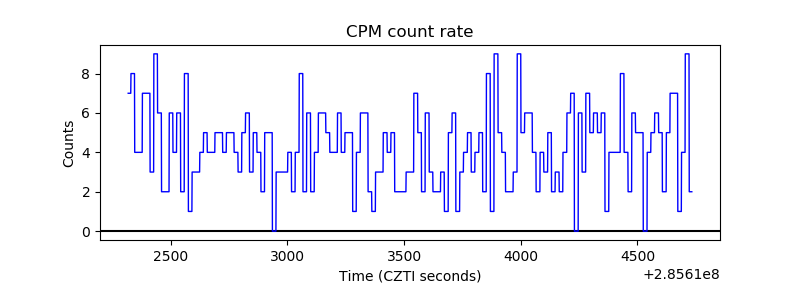 |
| CZT Counter | 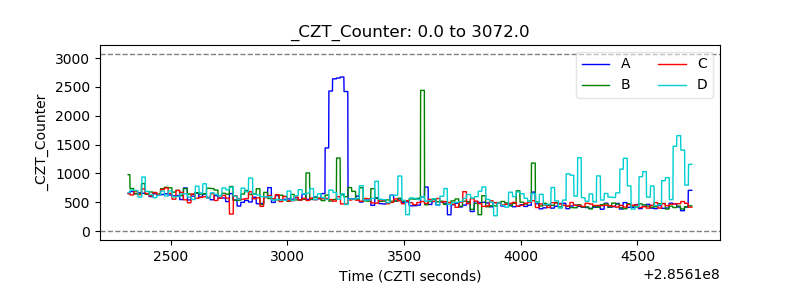 |
| +2.5 Volts monitor | 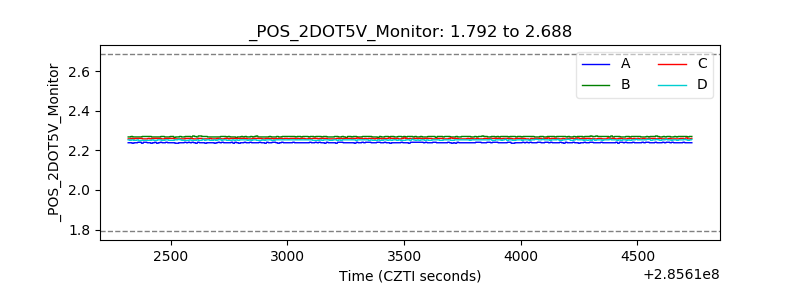 |
| +5 Volts monitor |  |
| _ROLL_ROT |  |
| _Roll_DEC | 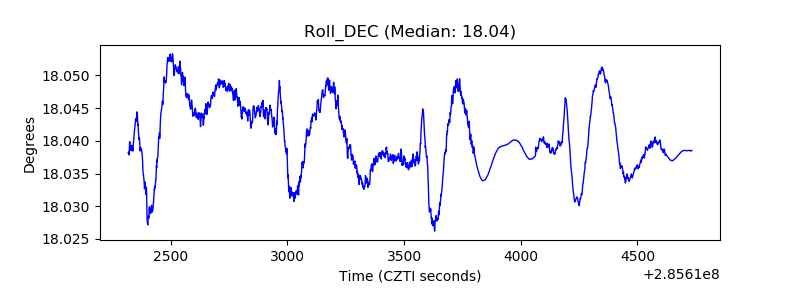 |
| _Roll_RA | 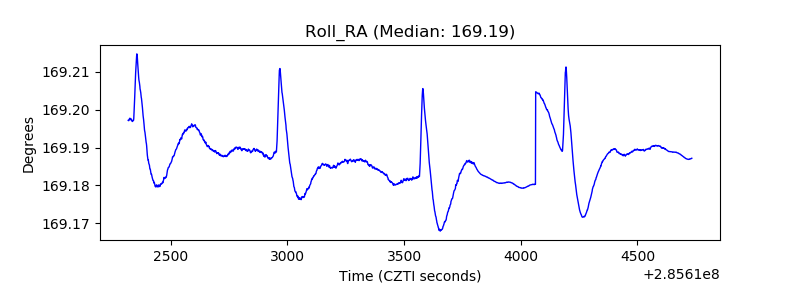 |
| Veto Counter |  |