| Param | Original file | Final file |
|---|---|---|
| Filename | modeM0/AS1A05_227T07_9000002666_17908cztM0_level2.evt | modeM0/AS1A05_227T07_9000002666_17908cztM0_level2_quad_clean.evt |
| Size (bytes) | 90,161,280 | 22,625,280 |
| Size | 86.0 MB | 21.6 MB |
| Events in quadrant A | 588,880 | 151,940 |
| Events in quadrant B | 668,455 | 156,825 |
| Events in quadrant C | 601,865 | 150,312 |
| Events in quadrant D | 793,082 | 141,353 |
| Mode M9 | |||
|---|---|---|---|
| Quadrant | BADHDUFLAG | Total packets | Discarded packets |
| A | 0 | 11 | 0 |
| B | 0 | 11 | 0 |
| C | 0 | 11 | 0 |
| D | 0 | 11 | 0 |
| Mode M0 | |||
|---|---|---|---|
| Quadrant | BADHDUFLAG | Total packets | Discarded packets |
| A | 0 | 2483 | 1 |
| B | 0 | 2714 | 1 |
| C | 0 | 2479 | 1 |
| D | 0 | 3116 | 1 |
| Mode SS | |||
|---|---|---|---|
| Quadrant | BADHDUFLAG | Total packets | Discarded packets |
| A | 0 | 22 | 0 |
| B | 0 | 22 | 0 |
| C | 0 | 22 | 0 |
| D | 0 | 22 | 0 |
| Quadrant | Total seconds | Saturated seconds | Saturation percentage |
|---|---|---|---|
| A | 1114 | 20 | 1.795332% |
| B | 1114 | 31 | 2.782765% |
| C | 1115 | 36 | 3.228700% |
| D | 1115 | 69 | 6.188341% |
Noise dominated data is calculated using 1-second bins in cleaned event files. If a bin has >2000 counts, and if more than 50% of those come from <1% of pixels, then it is considered to be noise-dominated and hence unusable.
| Quadrant | # 1 sec bins | Bins with >0 counts | Bins with >2000 counts | High rate bins dominated by noise | Noise dominated (total time) | Noise dominated (detector-on time) | Marked lightcurve |
|---|---|---|---|---|---|---|---|
| A | 2164 | 1115 | 0 | 0 | 0.00% | 0.00% | 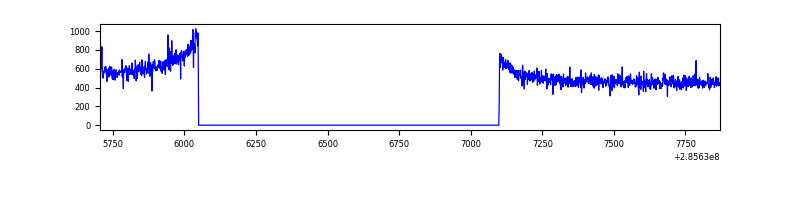 |
| B | 2164 | 1115 | 1 | 1 | 0.05% | 0.09% | 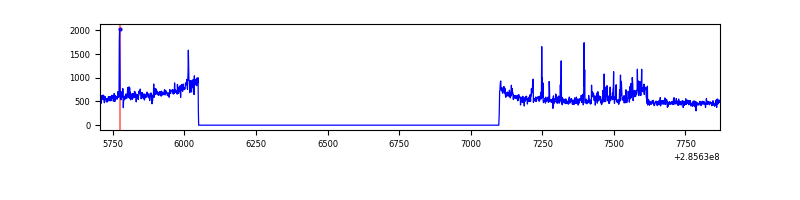 |
| C | 2165 | 1116 | 0 | 0 | 0.00% | 0.00% | 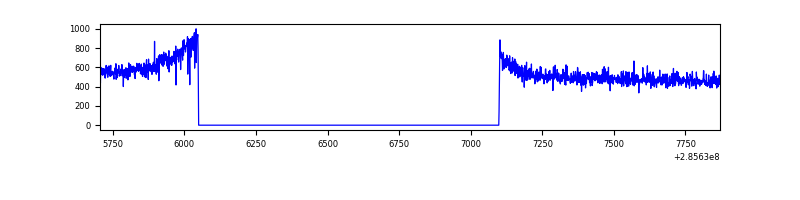 |
| D | 2165 | 1116 | 28 | 28 | 1.29% | 2.51% | 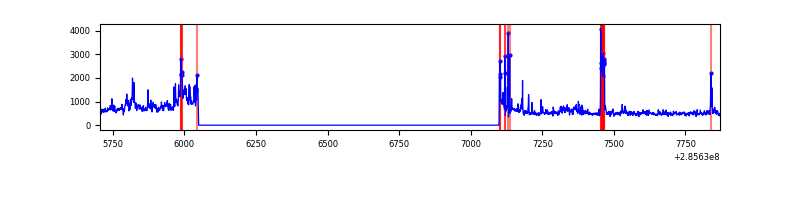 |
Top three noisy pixels from each quadrant. If the there are fewer than three noisy pixels in the level2.evt file, extra rows are filled as -1
| Pixel properties | Quadrant properties | ||||||
|---|---|---|---|---|---|---|---|
| Quadrant | DetID | PixID | Counts | Sigma | Mean | Median | Sigma |
| A | 4 | 2 | 3989 | 117.67 | 151 | 147 | 32.7 |
| A | 0 | 226 | 1330 | 36.23 | 151 | 147 | 32.7 |
| A | 12 | 194 | 1177 | 31.55 | 151 | 147 | 32.7 |
| B | 0 | 189 | 27272 | 846.96 | 152 | 149 | 32.0 |
| B | 0 | 244 | 15505 | 479.52 | 152 | 149 | 32.0 |
| B | 0 | 197 | 6890 | 210.5 | 152 | 149 | 32.0 |
| C | 14 | 238 | 22074 | 592.22 | 148 | 148 | 37.0 |
| C | 3 | 233 | 2495 | 63.39 | 148 | 148 | 37.0 |
| C | 13 | 61 | 1024 | 23.66 | 148 | 148 | 37.0 |
| D | 5 | 222 | 84778 | 2199.48 | 146 | 142 | 38.5 |
| D | 15 | 0 | 55231 | 1431.63 | 146 | 142 | 38.5 |
| D | 2 | 165 | 31026 | 802.6 | 146 | 142 | 38.5 |
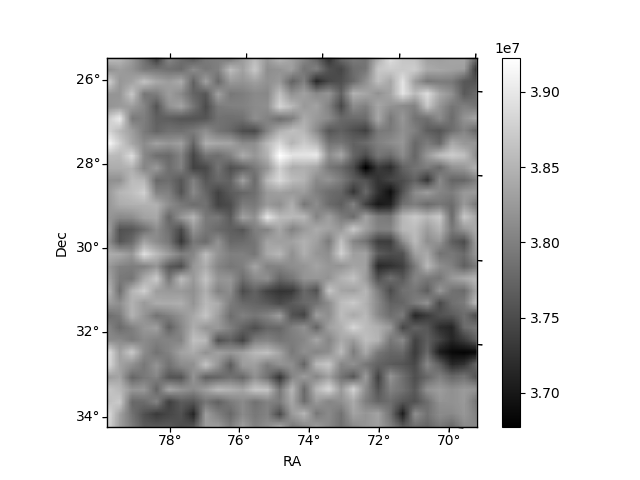
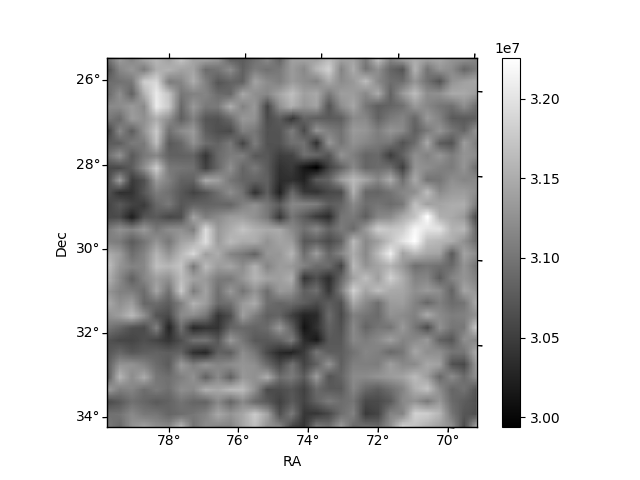
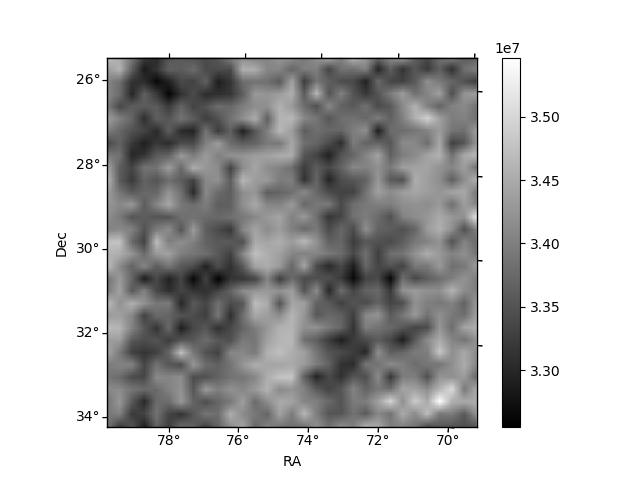
Histogram calculated using DETX and DETY for each event in the final _common_clean file
| Quadrant A | 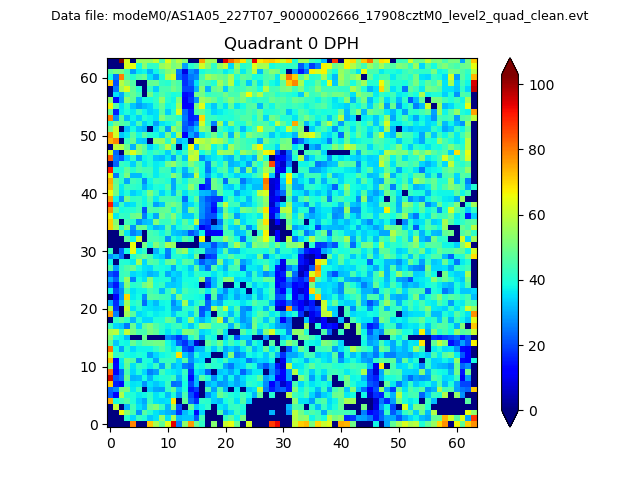 |
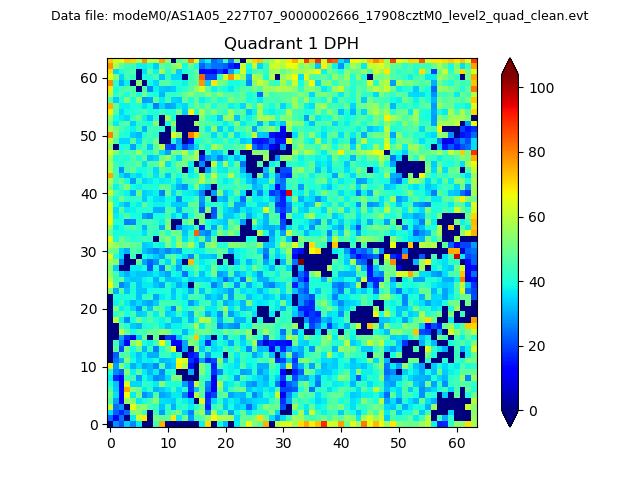 |
Quadrant B |
|---|---|---|---|
| Quadrant D | 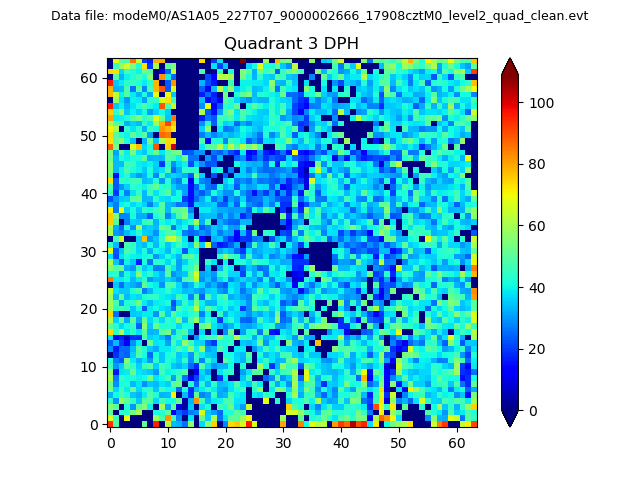 |
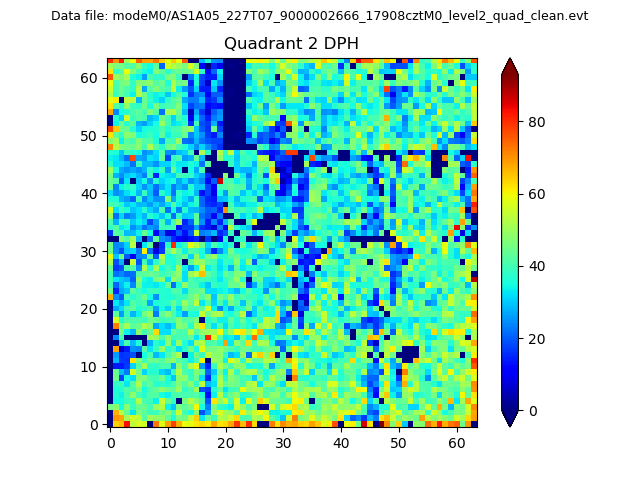 |
Quadrant C |
| Plot type | Count rate plots | Images |
|---|---|---|
| Comparison with Poisson distribution Blue bars denote a histogram of data divided into 1 sec bins. Red curve is a Poisson curve with rate = median count rate of data. |
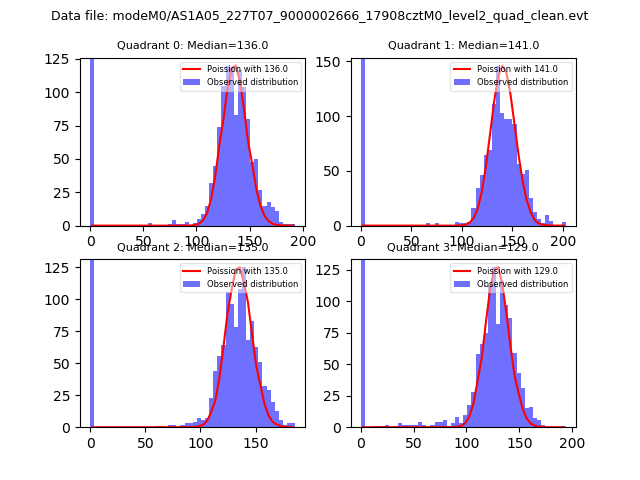 |
 |
| Quadrant-wise count rates Data is divided into 100 sec bins |
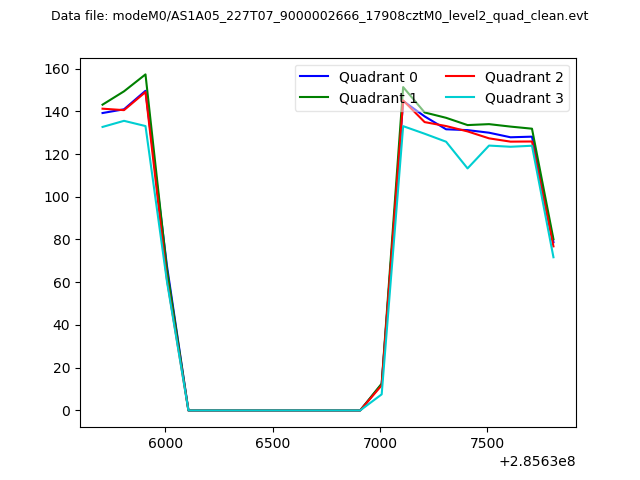 |
|
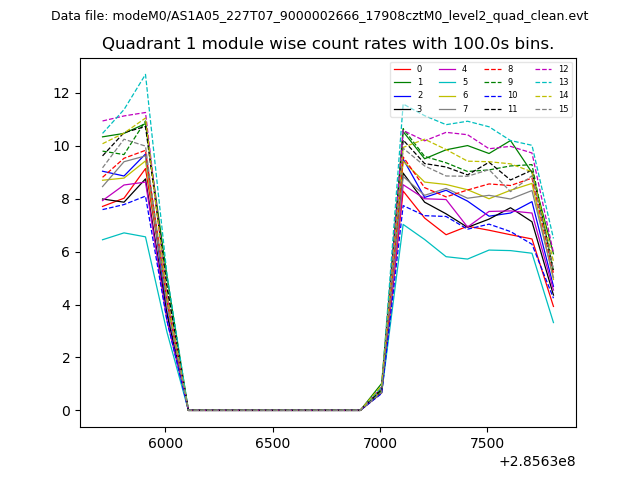
| Module-wise count rates for Quadrant A Data is divided into 100 sec bins |
 |
 |
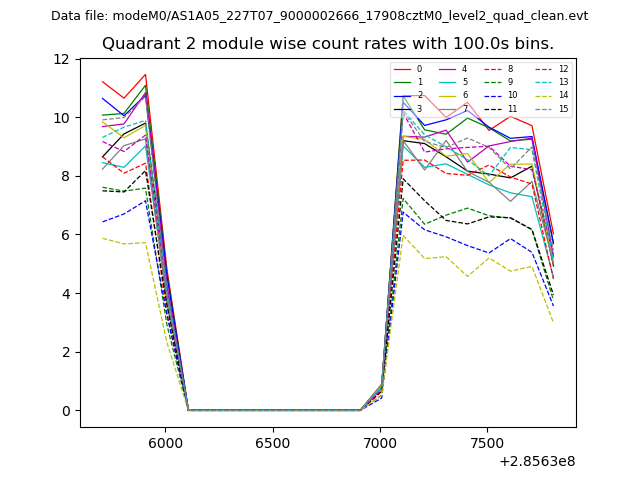
| Module-wise count rates for Quadrant B Data is divided into 100 sec bins |
 |
 |
| Module-wise count rates for Quadrant C Data is divided into 100 sec bins |
 |
 |
| Module-wise count rates for Quadrant D Data is divided into 100 sec bins |
 |
 |
| Parameter | Plot |
|---|---|
| CZT HV Monitor | 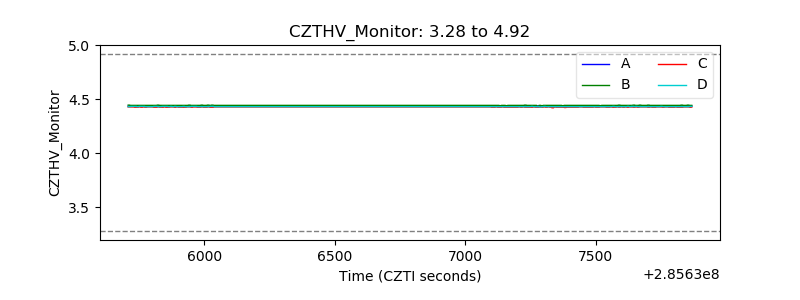 |
| D_VDD | 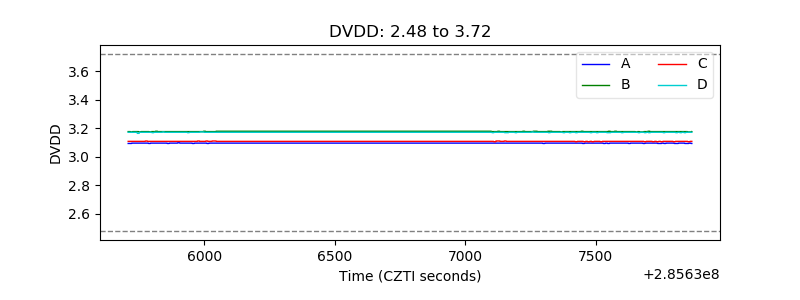 |
| Temperature 1 | 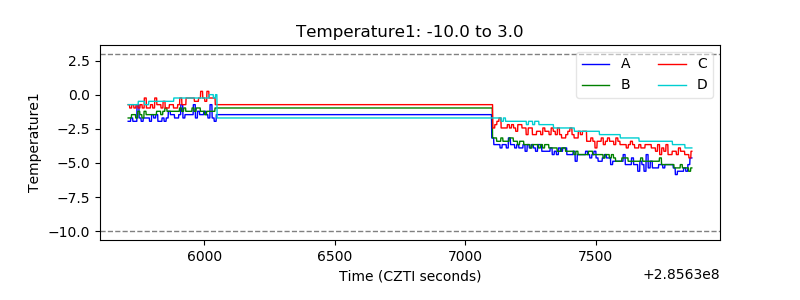 |
| Veto HV Monitor | 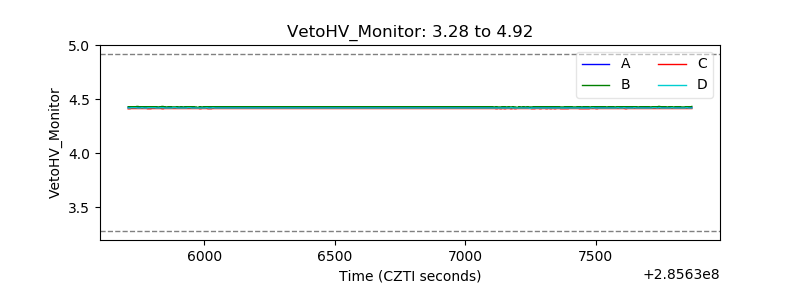 |
| Veto LLD | 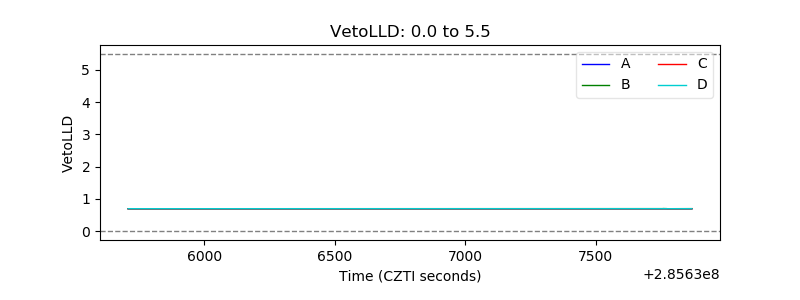 |
| Alpha Counter | 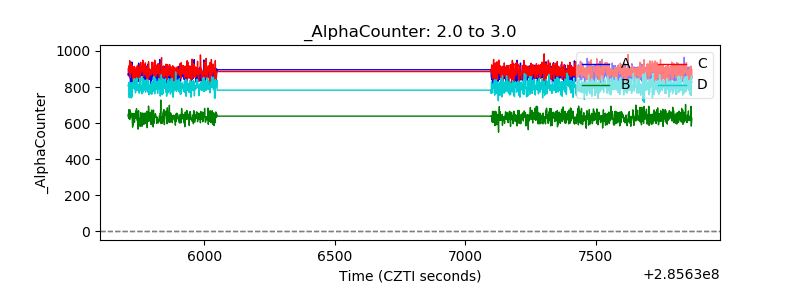 |
| _CPM_Rate | 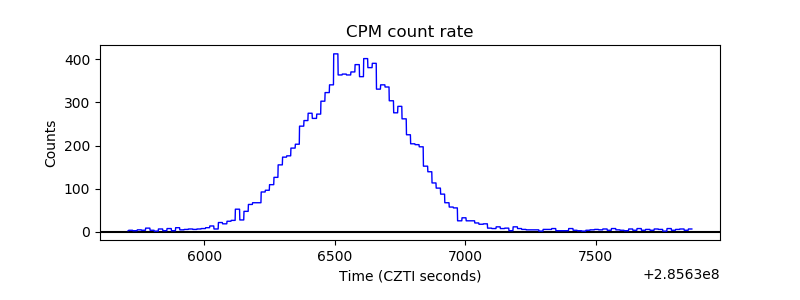 |
| CZT Counter | 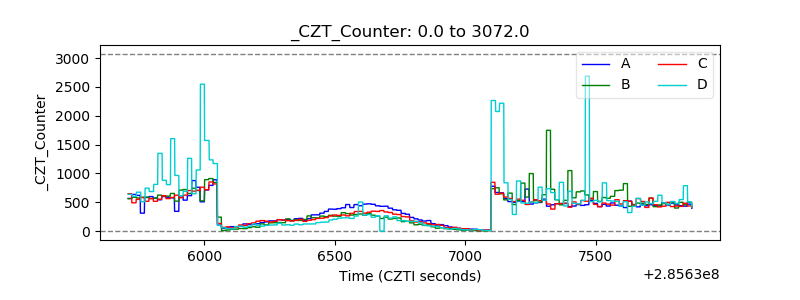 |
| +2.5 Volts monitor |  |
| +5 Volts monitor |  |
| _ROLL_ROT |  |
| _Roll_DEC | 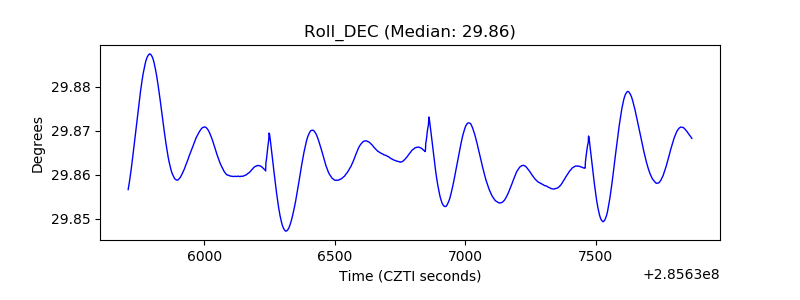 |
| _Roll_RA | 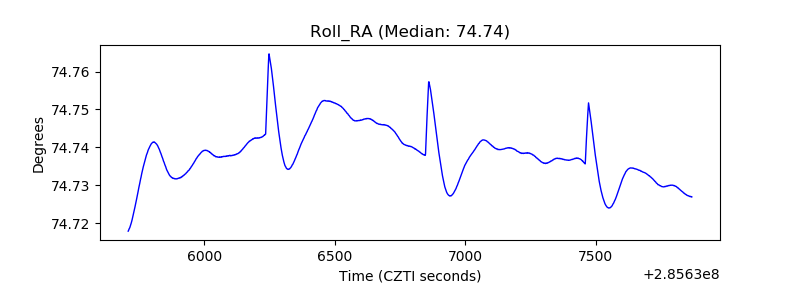 |
| Veto Counter |  |