| Param | Original file | Final file |
|---|---|---|
| Filename | modeM0/AS1C04_011T01_9000002664_17904cztM0_level2.evt | modeM0/AS1C04_011T01_9000002664_17904cztM0_level2_quad_clean.evt |
| Size (bytes) | 232,836,480 | 54,296,640 |
| Size | 222.1 MB | 51.8 MB |
| Events in quadrant A | 1,298,997 | 377,020 |
| Events in quadrant B | 1,431,936 | 389,591 |
| Events in quadrant C | 1,337,459 | 375,310 |
| Events in quadrant D | 2,810,521 | 321,482 |
| Mode SS | |||
|---|---|---|---|
| Quadrant | BADHDUFLAG | Total packets | Discarded packets |
| A | 0 | 52 | 0 |
| B | 0 | 52 | 0 |
| C | 0 | 52 | 0 |
| D | 0 | 52 | 0 |
| Mode M0 | |||
|---|---|---|---|
| Quadrant | BADHDUFLAG | Total packets | Discarded packets |
| A | 0 | 5455 | 1 |
| B | 0 | 5888 | 1 |
| C | 0 | 5629 | 1 |
| D | 0 | 10117 | 1 |
| Mode M9 | |||
|---|---|---|---|
| Quadrant | BADHDUFLAG | Total packets | Discarded packets |
| A | 0 | 13 | 0 |
| B | 0 | 13 | 0 |
| C | 0 | 13 | 0 |
| D | 0 | 13 | 0 |
| Quadrant | Total seconds | Saturated seconds | Saturation percentage |
|---|---|---|---|
| A | 2513 | 47 | 1.870275% |
| B | 2513 | 64 | 2.546757% |
| C | 2513 | 78 | 3.103860% |
| D | 2512 | 562 | 22.372611% |
Noise dominated data is calculated using 1-second bins in cleaned event files. If a bin has >2000 counts, and if more than 50% of those come from <1% of pixels, then it is considered to be noise-dominated and hence unusable.
| Quadrant | # 1 sec bins | Bins with >0 counts | Bins with >2000 counts | High rate bins dominated by noise | Noise dominated (total time) | Noise dominated (detector-on time) | Marked lightcurve |
|---|---|---|---|---|---|---|---|
| A | 3823 | 2514 | 0 | 0 | 0.00% | 0.00% | 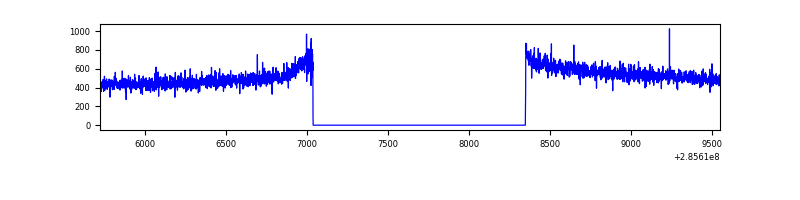 |
| B | 3823 | 2514 | 8 | 8 | 0.21% | 0.32% | 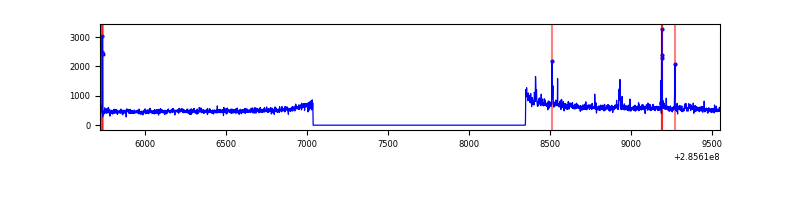 |
| C | 3823 | 2514 | 0 | 0 | 0.00% | 0.00% | 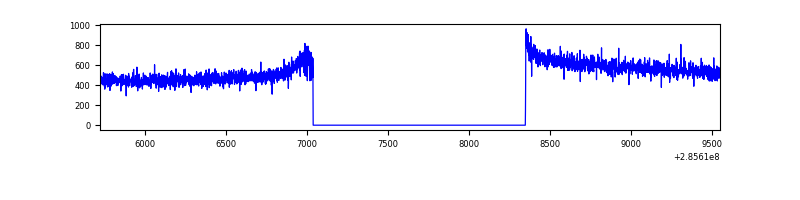 |
| D | 3822 | 2512 | 425 | 425 | 11.12% | 16.92% |  |
Top three noisy pixels from each quadrant. If the there are fewer than three noisy pixels in the level2.evt file, extra rows are filled as -1
| Pixel properties | Quadrant properties | ||||||
|---|---|---|---|---|---|---|---|
| Quadrant | DetID | PixID | Counts | Sigma | Mean | Median | Sigma |
| A | 0 | 226 | 2883 | 37.28 | 337 | 329 | 68.5 |
| A | 12 | 194 | 2561 | 32.58 | 337 | 329 | 68.5 |
| A | 3 | 137 | 2431 | 30.68 | 337 | 329 | 68.5 |
| B | 0 | 189 | 48033 | 745.99 | 339 | 330 | 63.9 |
| B | 7 | 220 | 17041 | 261.33 | 339 | 330 | 63.9 |
| B | 0 | 219 | 13893 | 212.1 | 339 | 330 | 63.9 |
| C | 14 | 238 | 51505 | 670.68 | 327 | 330 | 76.3 |
| C | 3 | 233 | 5917 | 73.22 | 327 | 330 | 76.3 |
| C | 5 | 218 | 3851 | 46.14 | 327 | 330 | 76.3 |
| D | 12 | 110 | 1470527 | 20223.27 | 297 | 289 | 72.7 |
| D | 5 | 222 | 115908 | 1590.35 | 297 | 289 | 72.7 |
| D | 7 | 223 | 37475 | 511.5 | 297 | 289 | 72.7 |
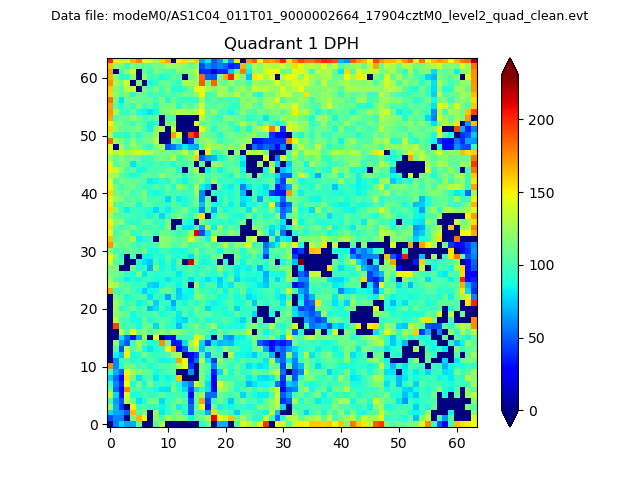
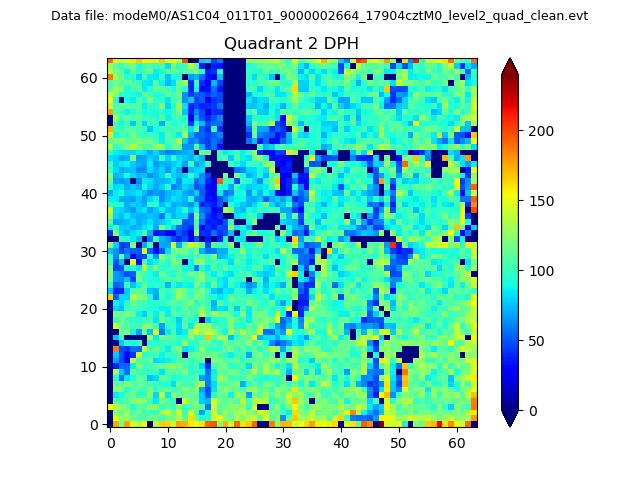
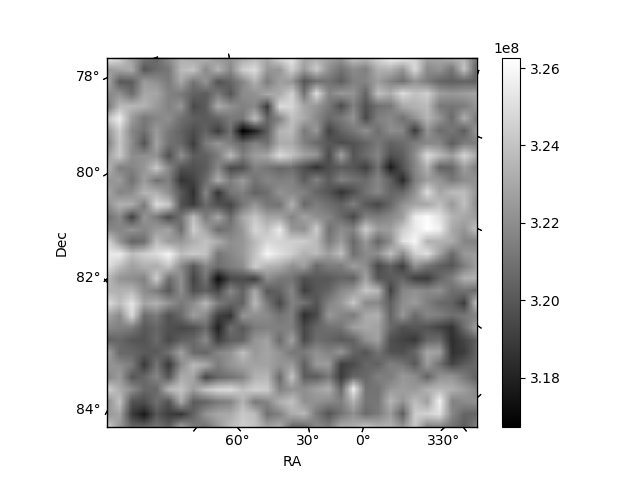
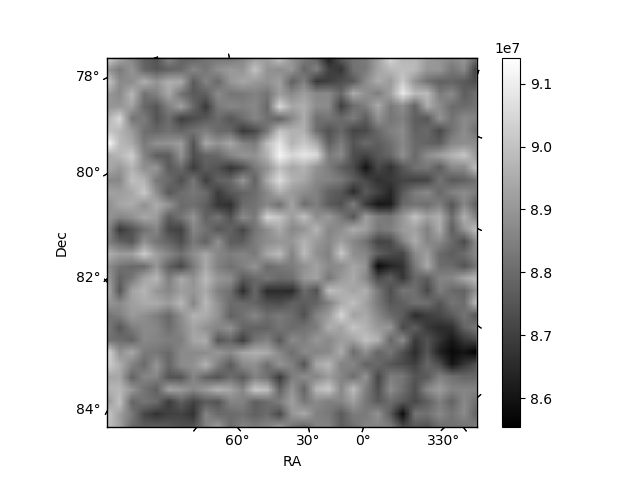
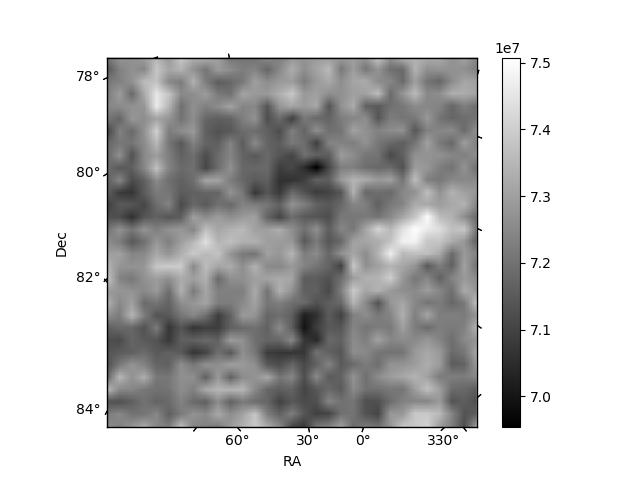
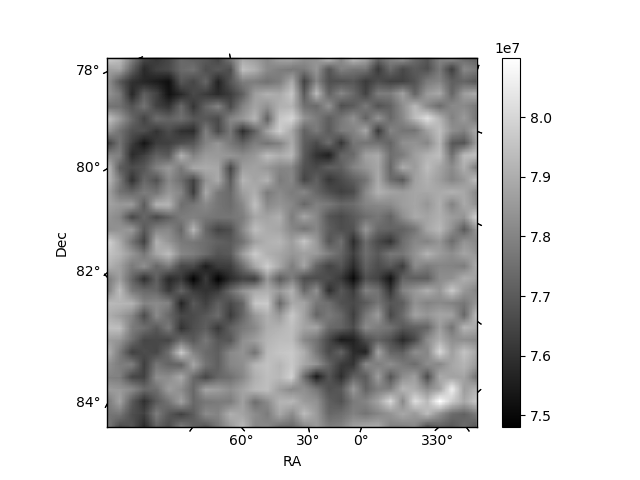
Histogram calculated using DETX and DETY for each event in the final _common_clean file
| Quadrant A | 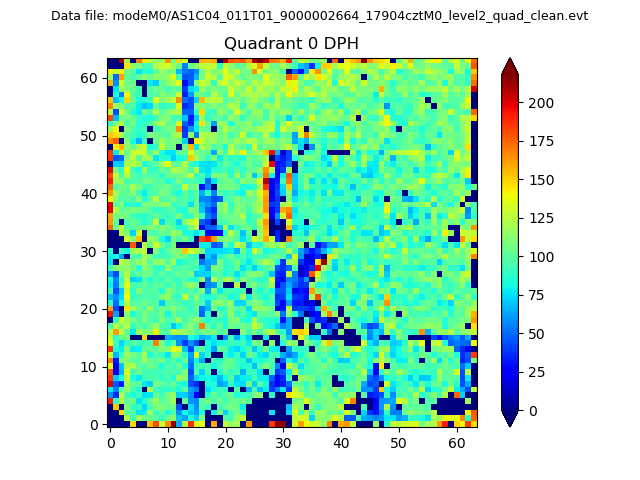 |
 |
Quadrant B |
|---|---|---|---|
| Quadrant D | 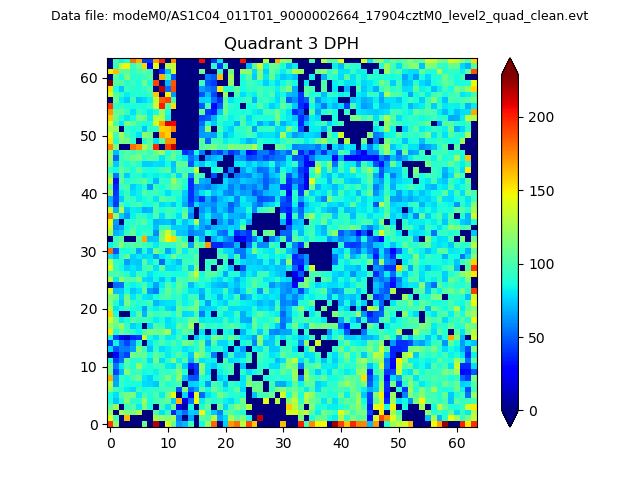 |
 |
Quadrant C |
| Plot type | Count rate plots | Images |
|---|---|---|
| Comparison with Poisson distribution Blue bars denote a histogram of data divided into 1 sec bins. Red curve is a Poisson curve with rate = median count rate of data. |
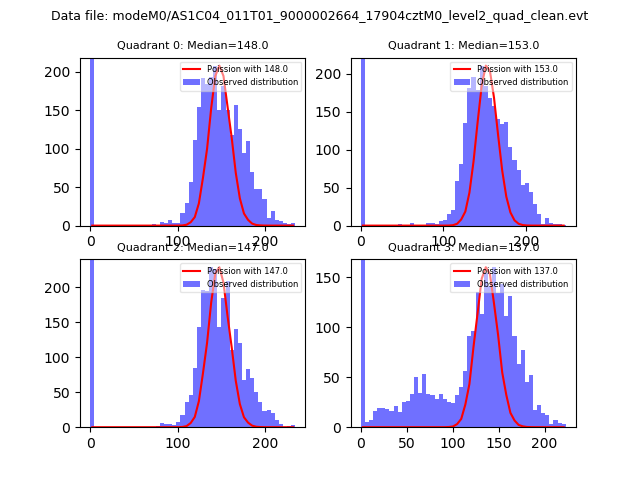 |
 |
| Quadrant-wise count rates Data is divided into 100 sec bins |
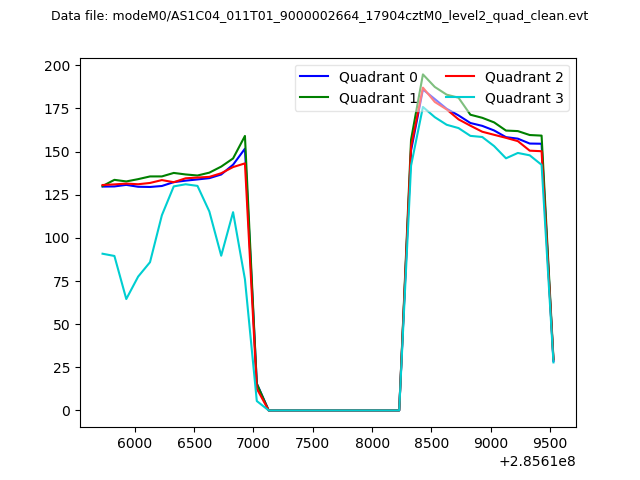 |
|
| Module-wise count rates for Quadrant A Data is divided into 100 sec bins |
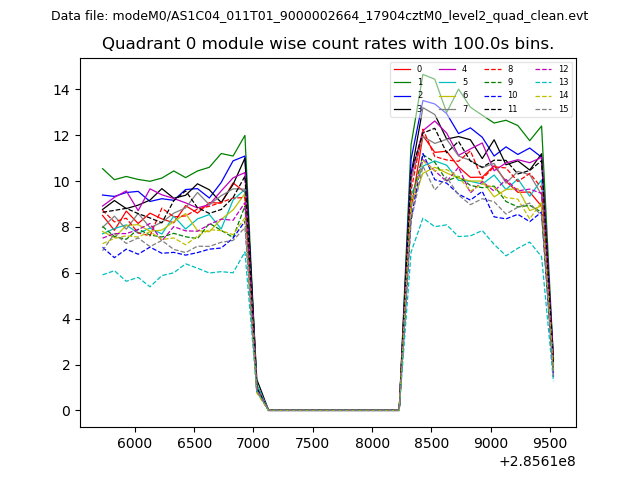 |
 |
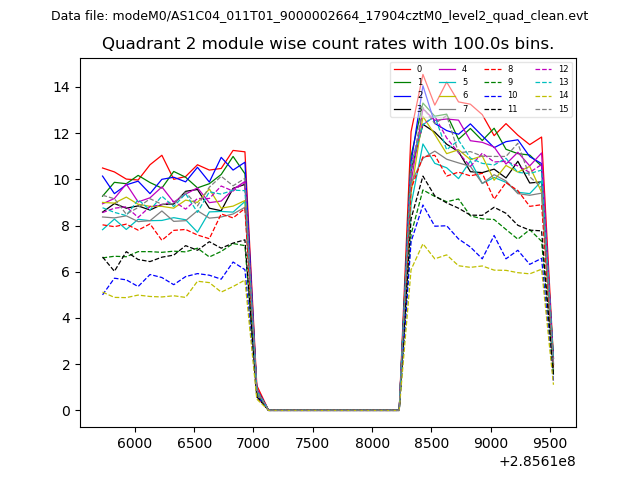
| Module-wise count rates for Quadrant B Data is divided into 100 sec bins |
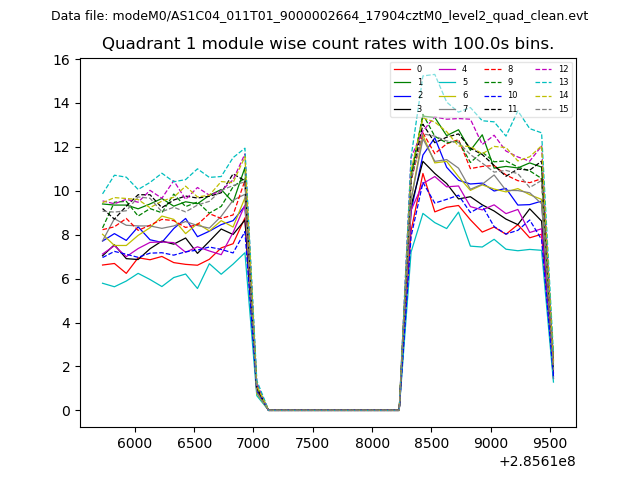 |
 |
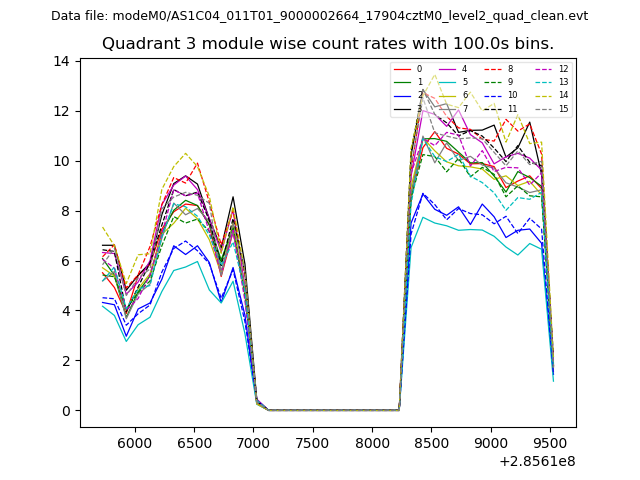
| Module-wise count rates for Quadrant C Data is divided into 100 sec bins |
 |
 |
| Module-wise count rates for Quadrant D Data is divided into 100 sec bins |
 |
 |
| Parameter | Plot |
|---|---|
| CZT HV Monitor | 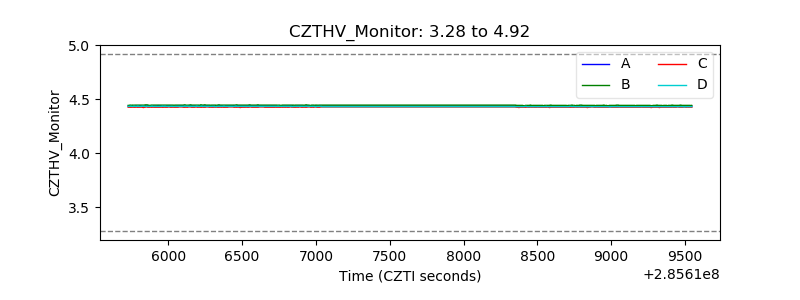 |
| D_VDD | 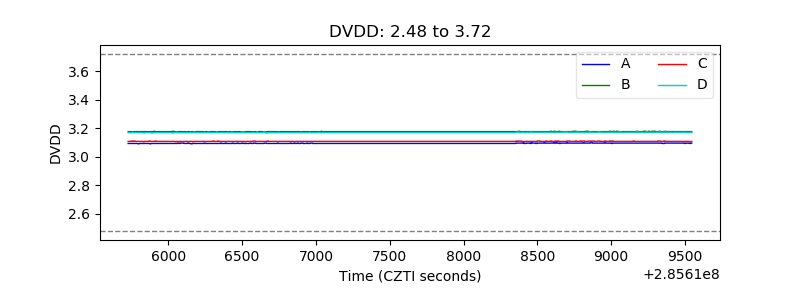 |
| Temperature 1 | 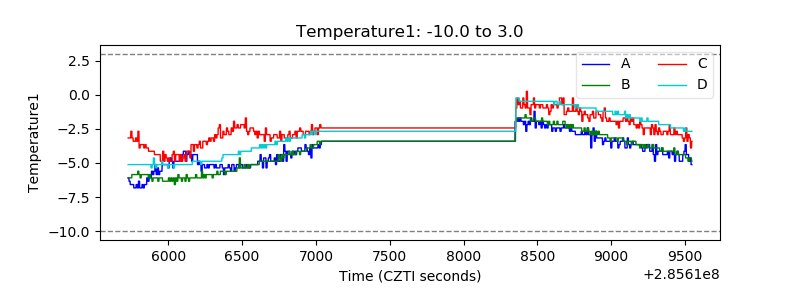 |
| Veto HV Monitor | 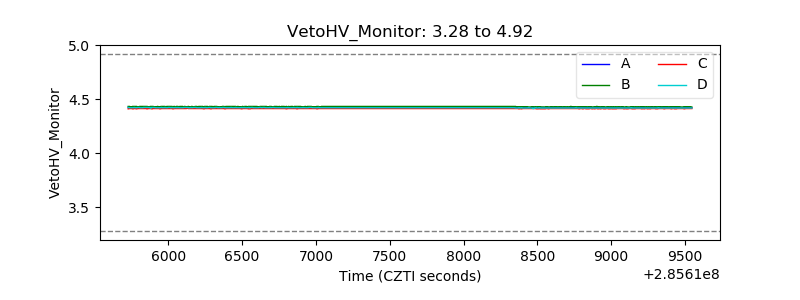 |
| Veto LLD | 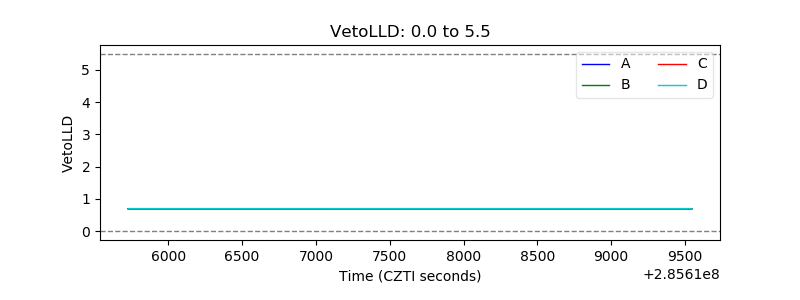 |
| Alpha Counter | 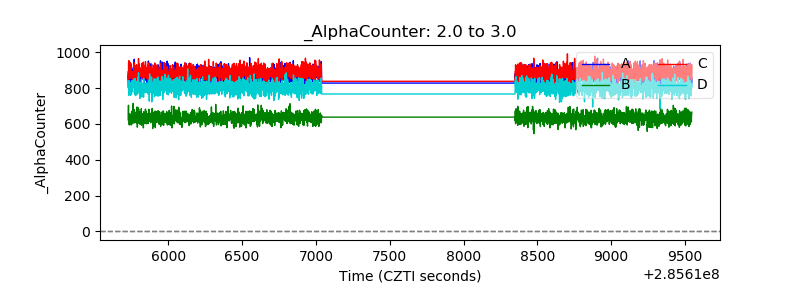 |
| _CPM_Rate | 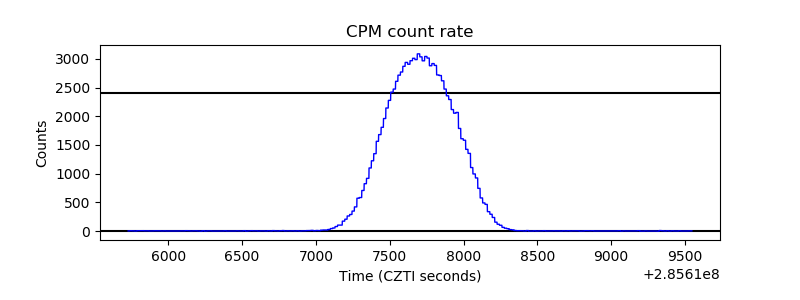 |
| CZT Counter | 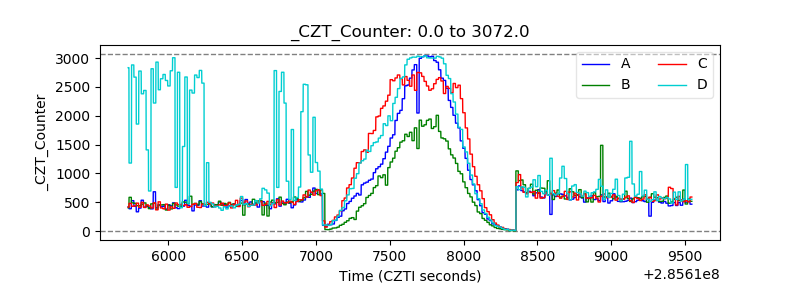 |
| +2.5 Volts monitor |  |
| +5 Volts monitor |  |
| _ROLL_ROT | 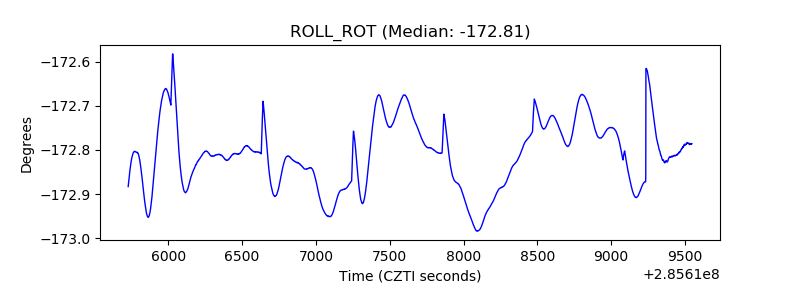 |
| _Roll_DEC | 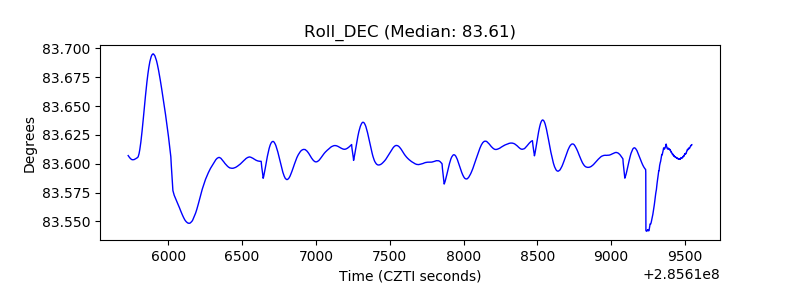 |
| _Roll_RA | 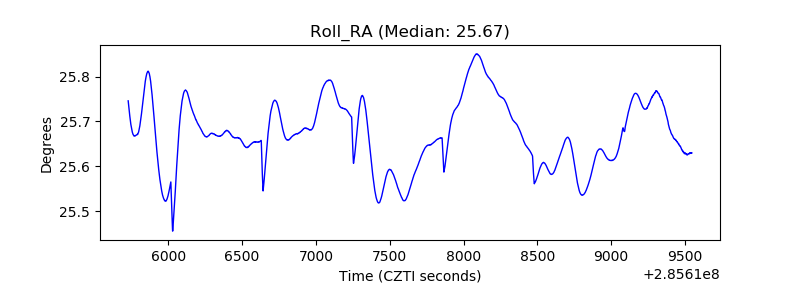 |
| Veto Counter | 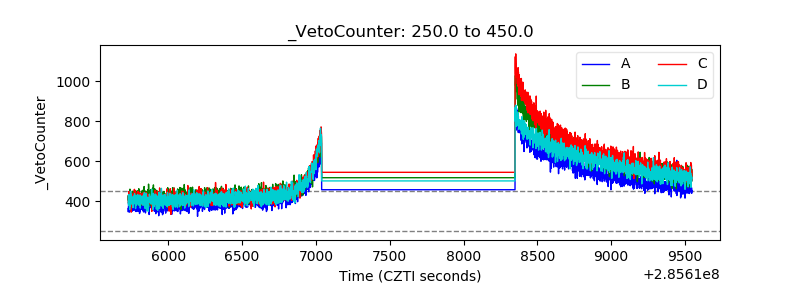 |