| Param | Original file | Final file |
|---|---|---|
| Filename | modeM0/AS1C04_011T01_9000002664_17907cztM0_level2.evt | modeM0/AS1C04_011T01_9000002664_17907cztM0_level2_quad_clean.evt |
| Size (bytes) | 485,913,600 | 132,445,440 |
| Size | 463.4 MB | 126.3 MB |
| Events in quadrant A | 2,982,653 | 898,599 |
| Events in quadrant B | 3,235,448 | 928,391 |
| Events in quadrant C | 3,146,068 | 899,055 |
| Events in quadrant D | 4,932,835 | 854,635 |
| Mode SS | |||
|---|---|---|---|
| Quadrant | BADHDUFLAG | Total packets | Discarded packets |
| A | 0 | 126 | 0 |
| B | 0 | 126 | 0 |
| C | 0 | 126 | 0 |
| D | 0 | 126 | 0 |
| Mode M0 | |||
|---|---|---|---|
| Quadrant | BADHDUFLAG | Total packets | Discarded packets |
| A | 0 | 12980 | 2 |
| B | 0 | 13753 | 2 |
| C | 0 | 13268 | 2 |
| D | 0 | 18935 | 2 |
| Mode M9 | |||
|---|---|---|---|
| Quadrant | BADHDUFLAG | Total packets | Discarded packets |
| A | 0 | 22 | 0 |
| B | 0 | 23 | 0 |
| C | 0 | 23 | 0 |
| D | 0 | 23 | 0 |
| Quadrant | Total seconds | Saturated seconds | Saturation percentage |
|---|---|---|---|
| A | 6173 | 20 | 0.323992% |
| B | 6173 | 38 | 0.615584% |
| C | 6173 | 81 | 1.312166% |
| D | 6173 | 259 | 4.195691% |
Noise dominated data is calculated using 1-second bins in cleaned event files. If a bin has >2000 counts, and if more than 50% of those come from <1% of pixels, then it is considered to be noise-dominated and hence unusable.
| Quadrant | # 1 sec bins | Bins with >0 counts | Bins with >2000 counts | High rate bins dominated by noise | Noise dominated (total time) | Noise dominated (detector-on time) | Marked lightcurve |
|---|---|---|---|---|---|---|---|
| A | 7553 | 6174 | 2 | 2 | 0.03% | 0.03% | 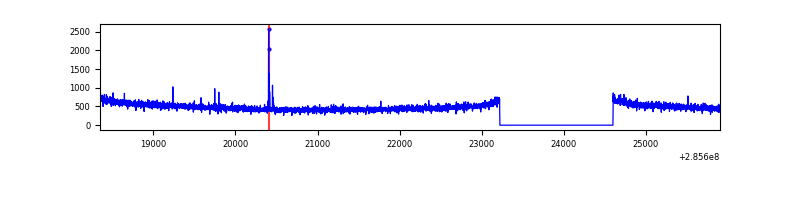 |
| B | 7553 | 6174 | 6 | 6 | 0.08% | 0.10% |  |
| C | 7553 | 6174 | 0 | 0 | 0.00% | 0.00% | 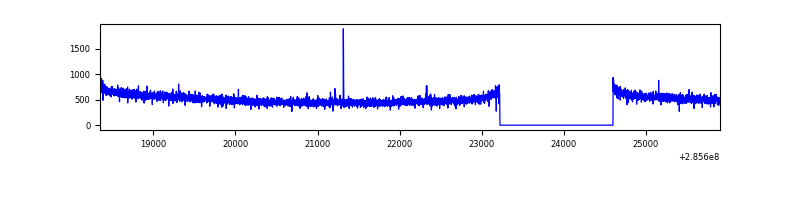 |
| D | 7553 | 6174 | 288 | 288 | 3.81% | 4.66% | 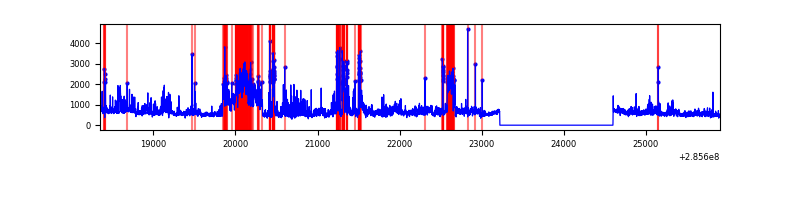 |
Top three noisy pixels from each quadrant. If the there are fewer than three noisy pixels in the level2.evt file, extra rows are filled as -1
| Pixel properties | Quadrant properties | ||||||
|---|---|---|---|---|---|---|---|
| Quadrant | DetID | PixID | Counts | Sigma | Mean | Median | Sigma |
| A | 15 | 174 | 20591 | 128.76 | 770 | 754 | 154.1 |
| A | 0 | 226 | 6711 | 38.66 | 770 | 754 | 154.1 |
| A | 12 | 194 | 5744 | 32.39 | 770 | 754 | 154.1 |
| B | 0 | 189 | 105941 | 734.76 | 781 | 763 | 143.1 |
| B | 0 | 219 | 27285 | 185.28 | 781 | 763 | 143.1 |
| B | 7 | 220 | 23963 | 162.07 | 781 | 763 | 143.1 |
| C | 14 | 238 | 121802 | 692.68 | 763 | 769 | 174.7 |
| C | 3 | 233 | 24378 | 135.12 | 763 | 769 | 174.7 |
| C | 5 | 218 | 15536 | 84.51 | 763 | 769 | 174.7 |
| D | 7 | 238 | 693864 | 3826.06 | 756 | 735 | 181.2 |
| D | 12 | 110 | 654711 | 3609.93 | 756 | 735 | 181.2 |
| D | 5 | 222 | 492779 | 2716.07 | 756 | 735 | 181.2 |
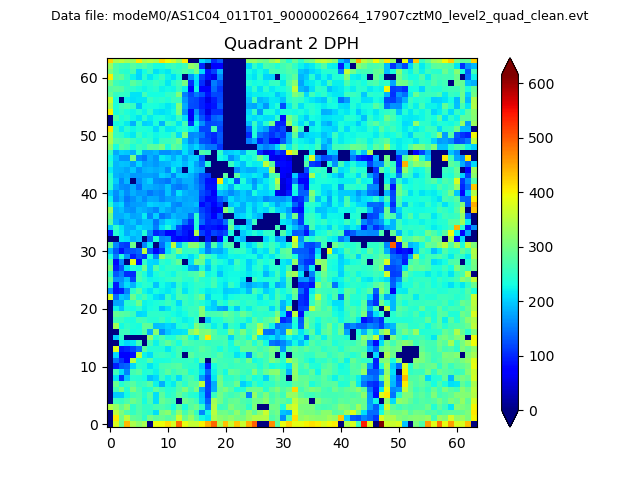
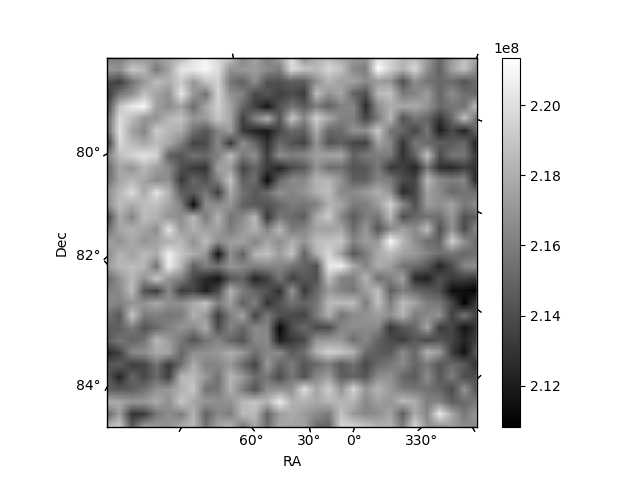
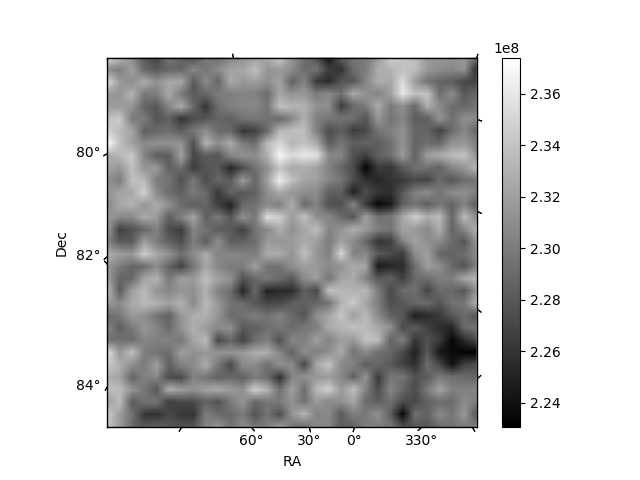
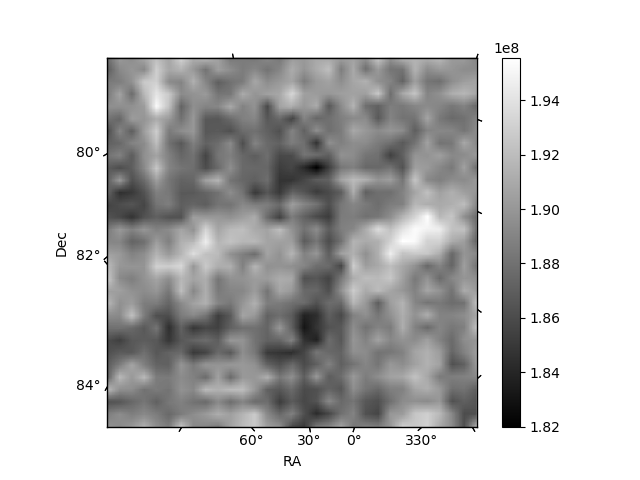
Histogram calculated using DETX and DETY for each event in the final _common_clean file
| Quadrant A |  |
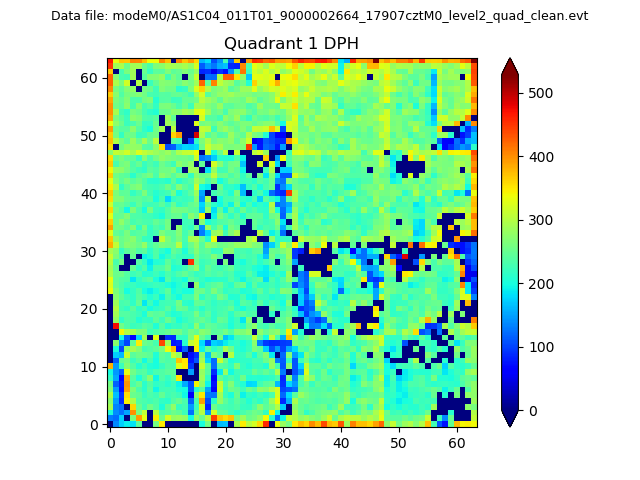 |
Quadrant B |
|---|---|---|---|
| Quadrant D | 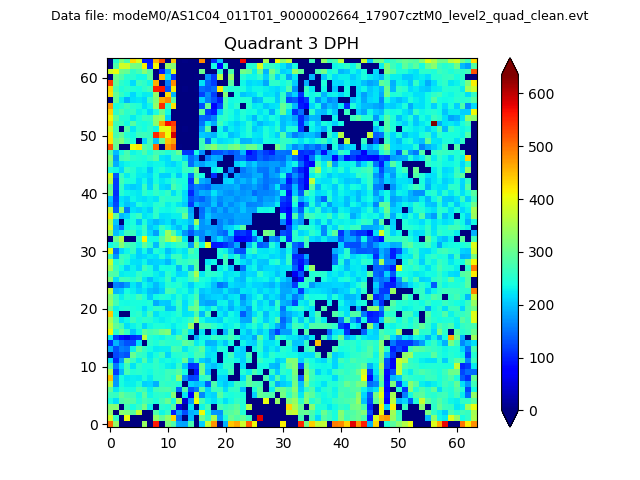 |
 |
Quadrant C |
| Plot type | Count rate plots | Images |
|---|---|---|
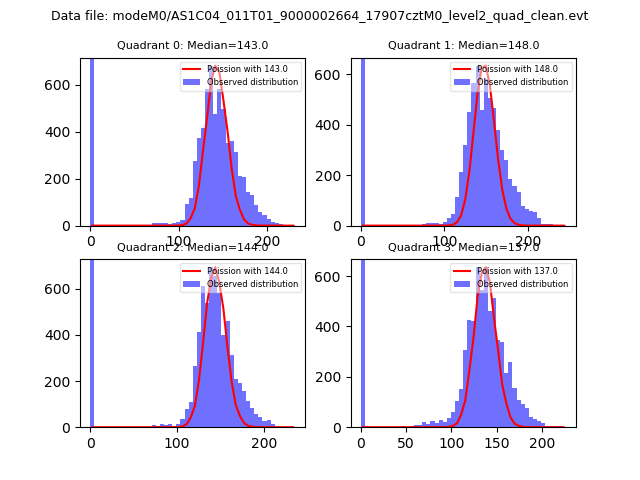
| Comparison with Poisson distribution Blue bars denote a histogram of data divided into 1 sec bins. Red curve is a Poisson curve with rate = median count rate of data. |
 |
 |
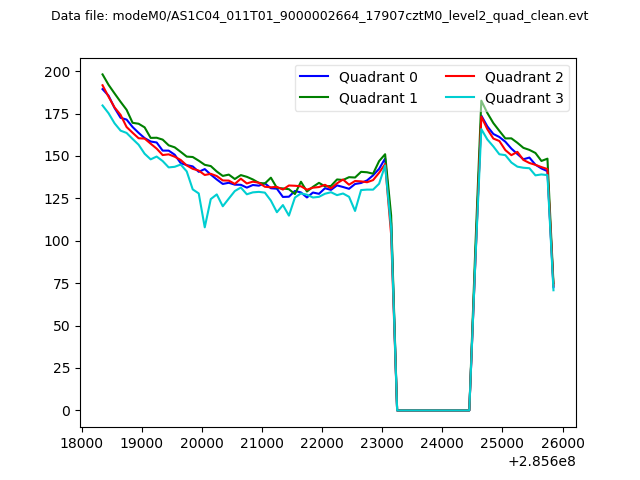
| Quadrant-wise count rates Data is divided into 100 sec bins |
 |
|
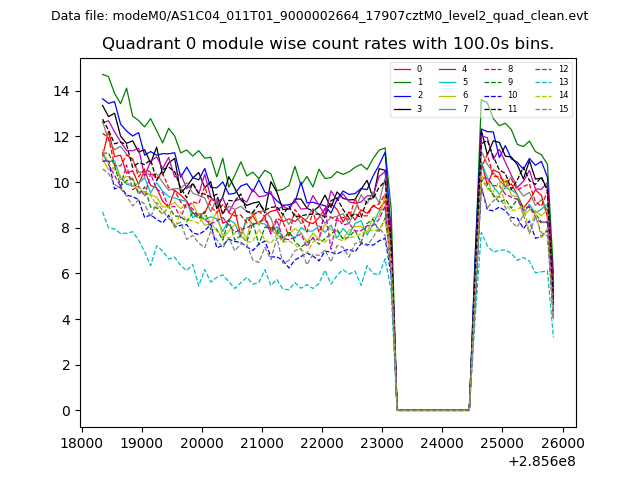
| Module-wise count rates for Quadrant A Data is divided into 100 sec bins |
 |
 |
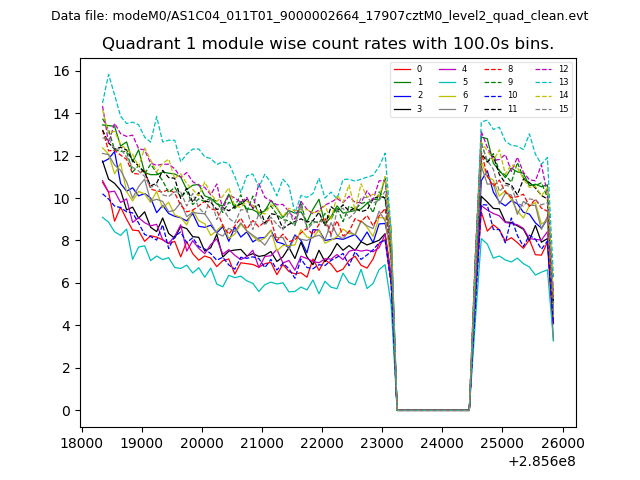
| Module-wise count rates for Quadrant B Data is divided into 100 sec bins |
 |
 |
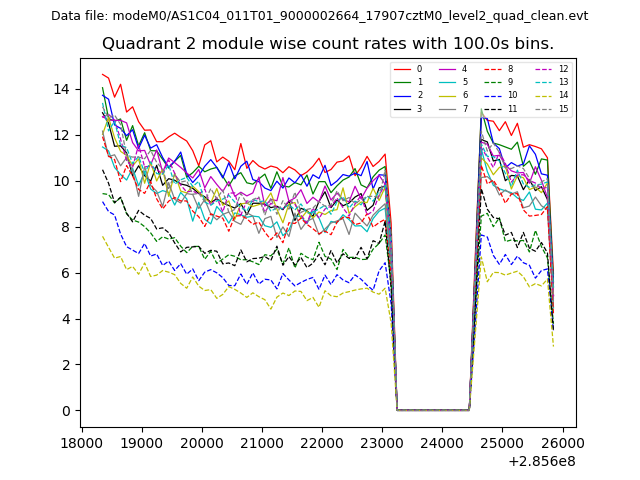
| Module-wise count rates for Quadrant C Data is divided into 100 sec bins |
 |
 |
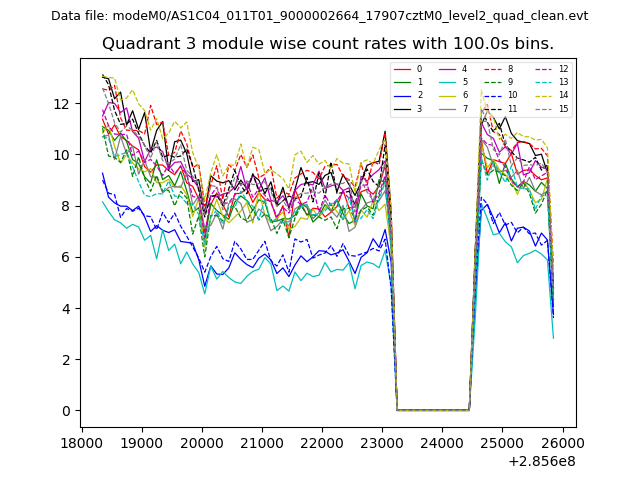
| Module-wise count rates for Quadrant D Data is divided into 100 sec bins |
 |
 |
| Parameter | Plot |
|---|---|
| CZT HV Monitor | 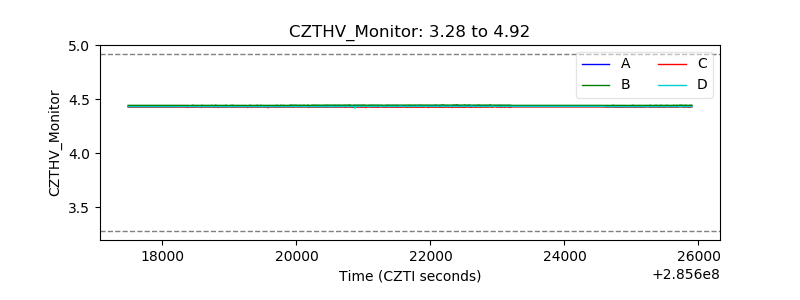 |
| D_VDD |  |
| Temperature 1 | 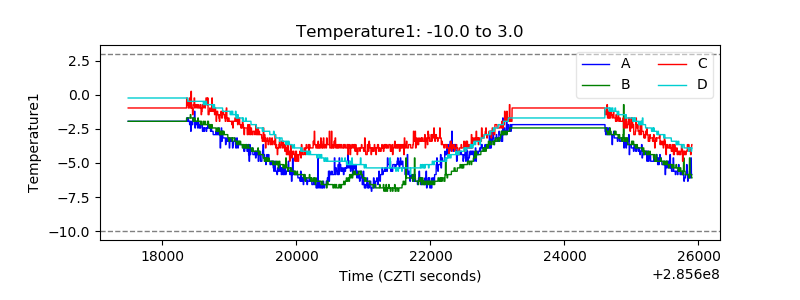 |
| Veto HV Monitor |  |
| Veto LLD | 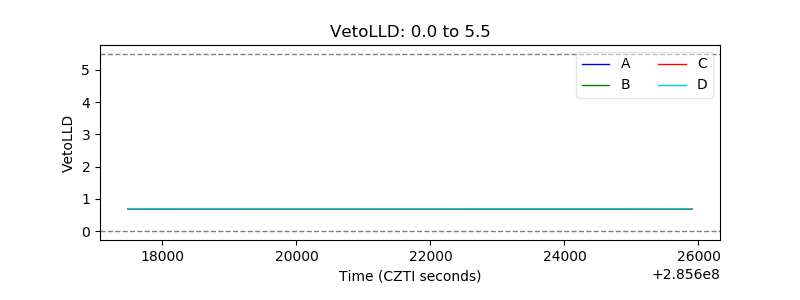 |
| Alpha Counter | 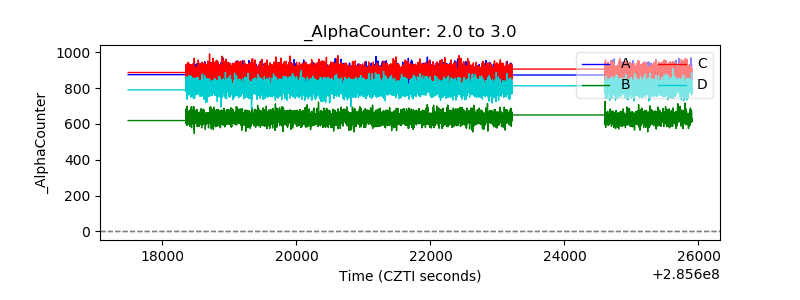 |
| _CPM_Rate | 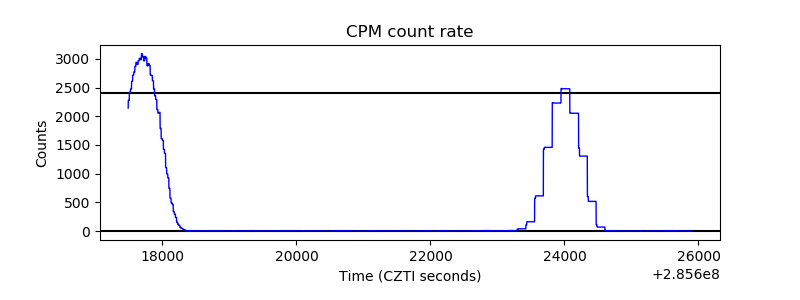 |
| CZT Counter | 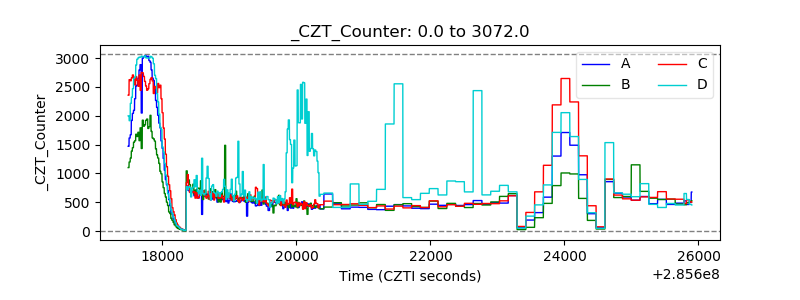 |
| +2.5 Volts monitor |  |
| +5 Volts monitor |  |
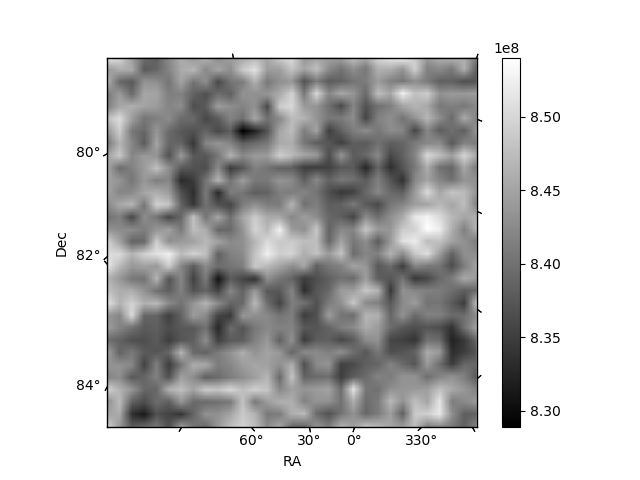
| _ROLL_ROT | 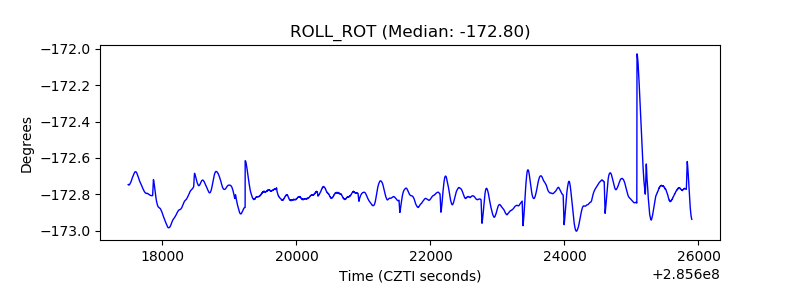 |
| _Roll_DEC |  |
| _Roll_RA | 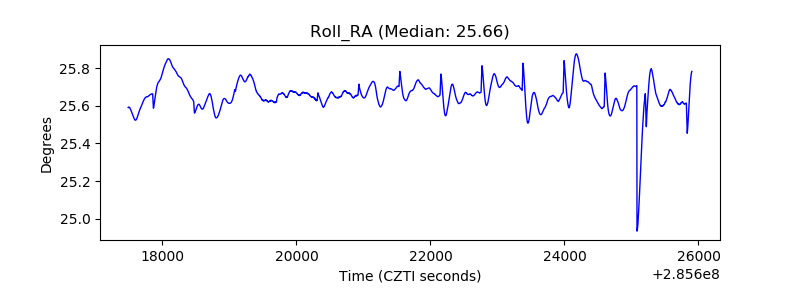 |
| Veto Counter | 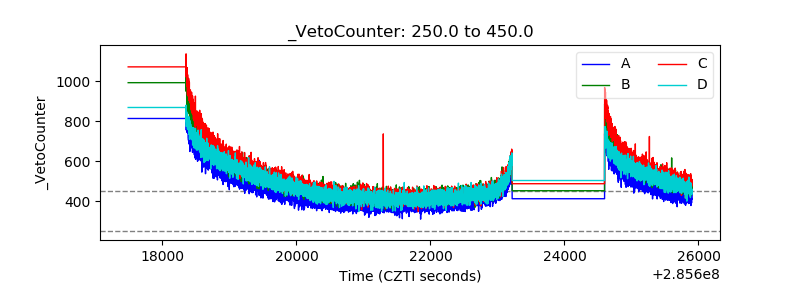 |