| Param | Original file | Final file |
|---|---|---|
| Filename | modeM0/AS1A05_096T06_9000002668_17909cztM0_level2.evt | modeM0/AS1A05_096T06_9000002668_17909cztM0_level2_quad_clean.evt |
| Size (bytes) | 557,657,280 | 134,259,840 |
| Size | 531.8 MB | 128.0 MB |
| Events in quadrant A | 3,357,109 | 915,039 |
| Events in quadrant B | 3,638,296 | 938,536 |
| Events in quadrant C | 3,411,474 | 889,355 |
| Events in quadrant D | 5,974,780 | 803,547 |
| Mode M0 | |||
|---|---|---|---|
| Quadrant | BADHDUFLAG | Total packets | Discarded packets |
| A | 0 | 15243 | 2 |
| B | 0 | 15853 | 2 |
| C | 0 | 15243 | 2 |
| D | 0 | 23165 | 2 |
| Mode M9 | |||
|---|---|---|---|
| Quadrant | BADHDUFLAG | Total packets | Discarded packets |
| A | 0 | 3 | 0 |
| B | 0 | 3 | 0 |
| C | 0 | 3 | 0 |
| D | 0 | 3 | 0 |
| Mode SS | |||
|---|---|---|---|
| Quadrant | BADHDUFLAG | Total packets | Discarded packets |
| A | 0 | 152 | 0 |
| B | 0 | 152 | 0 |
| C | 0 | 152 | 0 |
| D | 0 | 152 | 0 |
| Quadrant | Total seconds | Saturated seconds | Saturation percentage |
|---|---|---|---|
| A | 7464 | 62 | 0.830654% |
| B | 7464 | 104 | 1.393355% |
| C | 7464 | 109 | 1.460343% |
| D | 7465 | 1014 | 13.583389% |
Noise dominated data is calculated using 1-second bins in cleaned event files. If a bin has >2000 counts, and if more than 50% of those come from <1% of pixels, then it is considered to be noise-dominated and hence unusable.
| Quadrant | # 1 sec bins | Bins with >0 counts | Bins with >2000 counts | High rate bins dominated by noise | Noise dominated (total time) | Noise dominated (detector-on time) | Marked lightcurve |
|---|---|---|---|---|---|---|---|
| A | 7759 | 7465 | 1 | 1 | 0.01% | 0.01% | 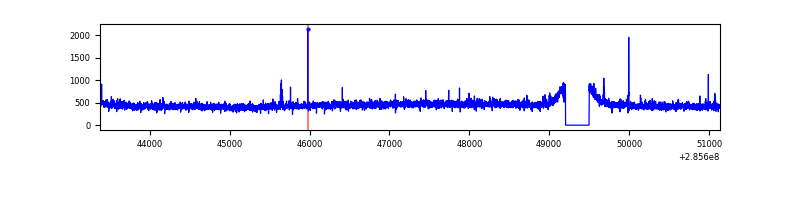 |
| B | 7759 | 7465 | 13 | 13 | 0.17% | 0.17% | 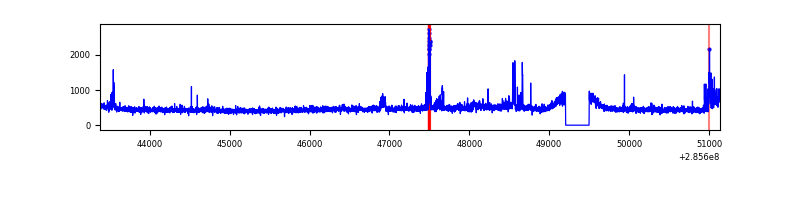 |
| C | 7759 | 7465 | 0 | 0 | 0.00% | 0.00% | 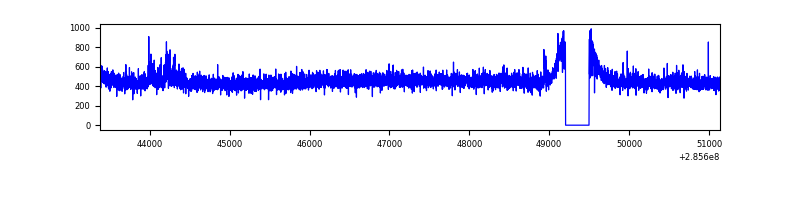 |
| D | 7760 | 7465 | 909 | 909 | 11.71% | 12.18% | 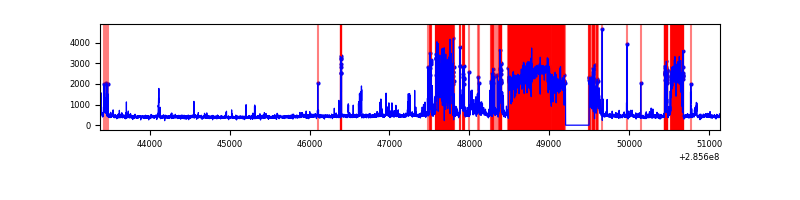 |
Top three noisy pixels from each quadrant. If the there are fewer than three noisy pixels in the level2.evt file, extra rows are filled as -1
| Pixel properties | Quadrant properties | ||||||
|---|---|---|---|---|---|---|---|
| Quadrant | DetID | PixID | Counts | Sigma | Mean | Median | Sigma |
| A | 15 | 174 | 19422 | 106.21 | 861 | 839 | 175.0 |
| A | 15 | 31 | 9625 | 50.21 | 861 | 839 | 175.0 |
| A | 13 | 210 | 8533 | 43.97 | 861 | 839 | 175.0 |
| B | 15 | 222 | 76520 | 461.94 | 867 | 844 | 163.8 |
| B | 7 | 220 | 41497 | 248.15 | 867 | 844 | 163.8 |
| B | 4 | 48 | 30940 | 183.71 | 867 | 844 | 163.8 |
| C | 14 | 238 | 135196 | 695.32 | 831 | 832 | 193.2 |
| C | 3 | 233 | 34206 | 172.71 | 831 | 832 | 193.2 |
| C | 13 | 61 | 5848 | 25.95 | 831 | 832 | 193.2 |
| D | 7 | 238 | 2520154 | 13165.57 | 783 | 757 | 191.4 |
| D | 2 | 165 | 283326 | 1476.61 | 783 | 757 | 191.4 |
| D | 13 | 168 | 75472 | 390.43 | 783 | 757 | 191.4 |
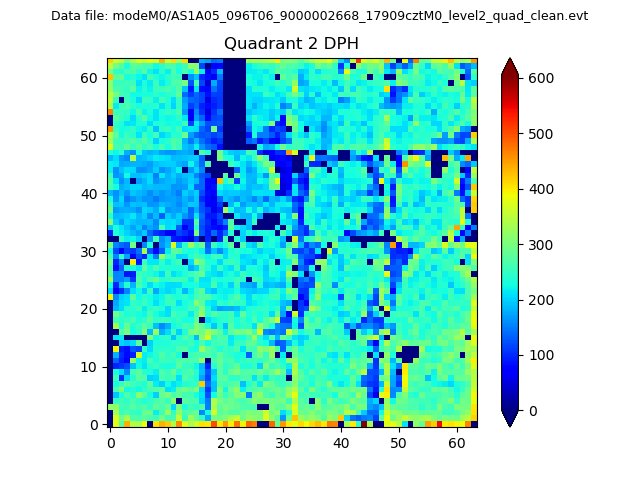
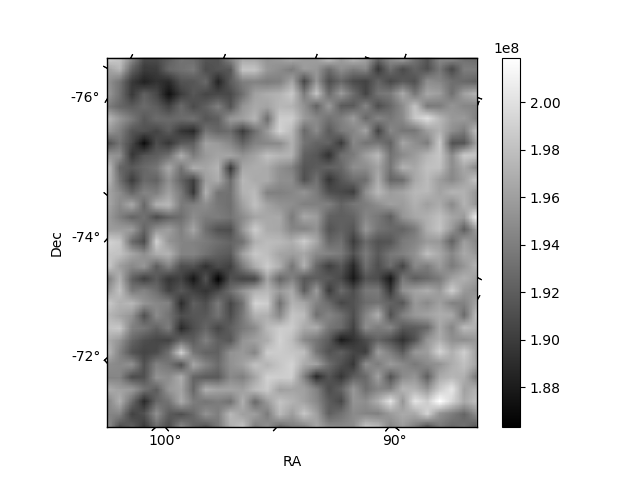
Histogram calculated using DETX and DETY for each event in the final _common_clean file
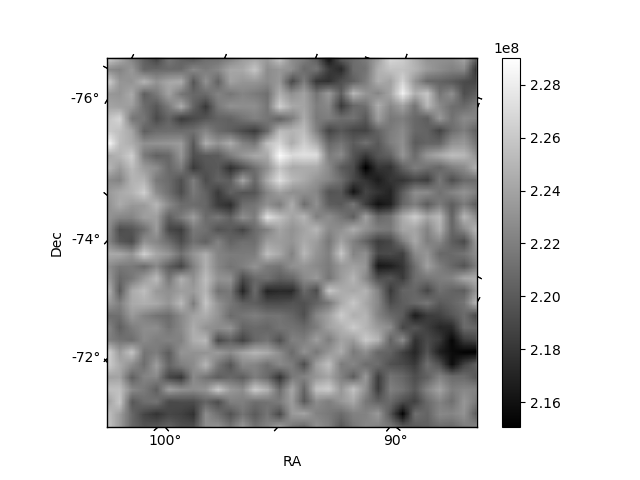
| Quadrant A | 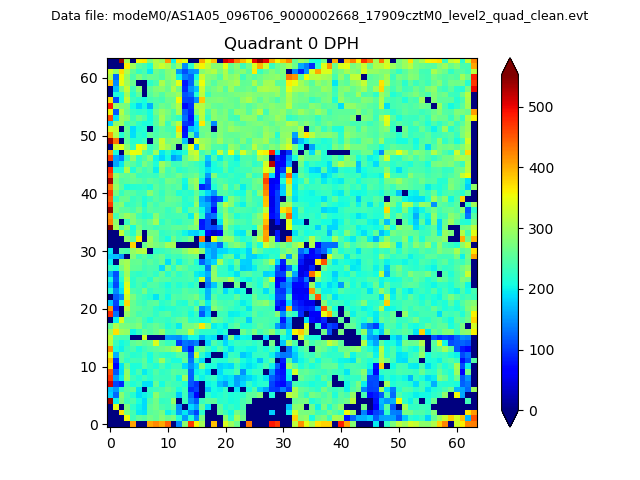 |
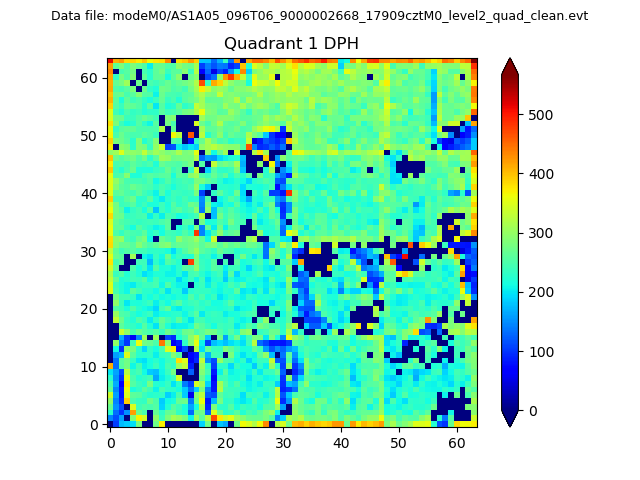 |
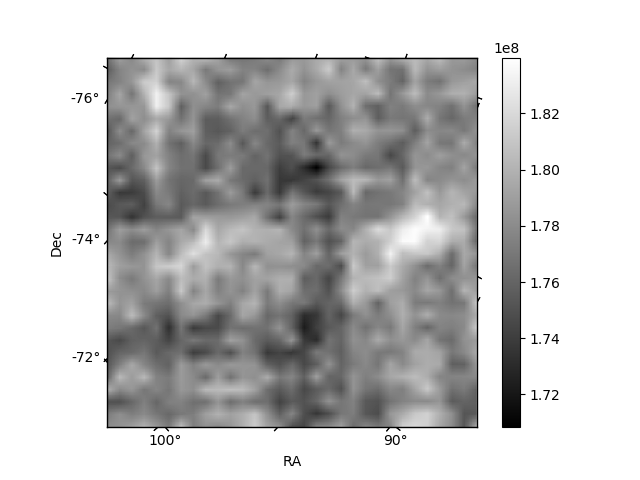
Quadrant B |
|---|---|---|---|
| Quadrant D | 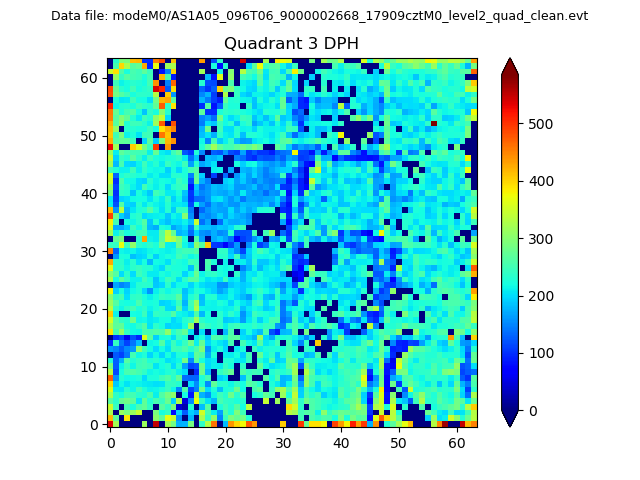 |
 |
Quadrant C |
| Plot type | Count rate plots | Images |
|---|---|---|
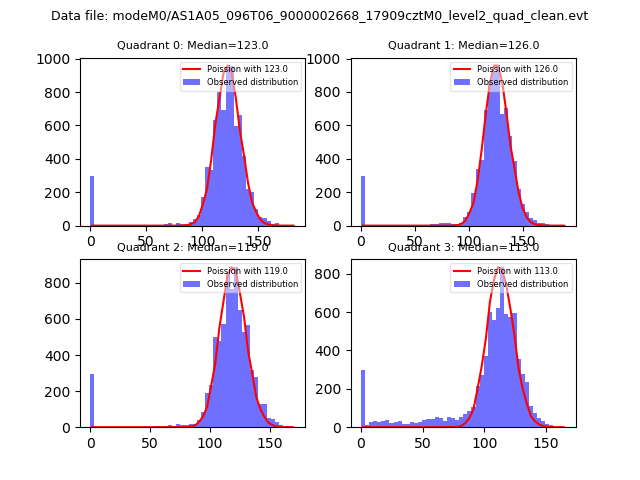
| Comparison with Poisson distribution Blue bars denote a histogram of data divided into 1 sec bins. Red curve is a Poisson curve with rate = median count rate of data. |
 |
 |
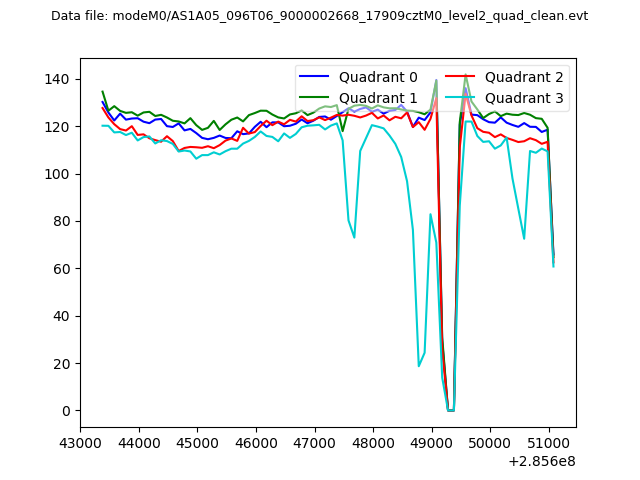
| Quadrant-wise count rates Data is divided into 100 sec bins |
 |
|
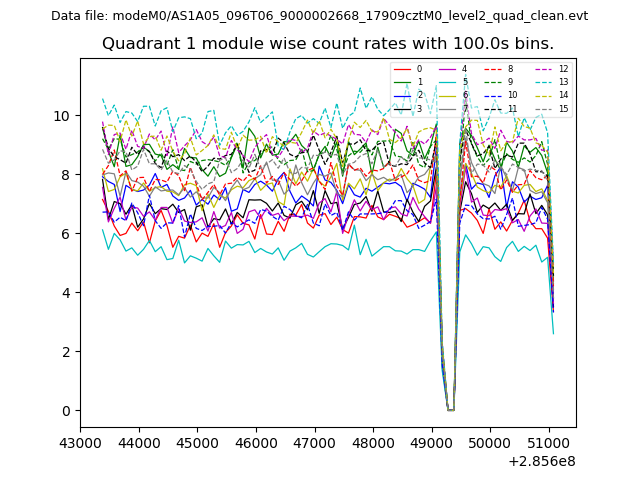
| Module-wise count rates for Quadrant A Data is divided into 100 sec bins |
 |
 |
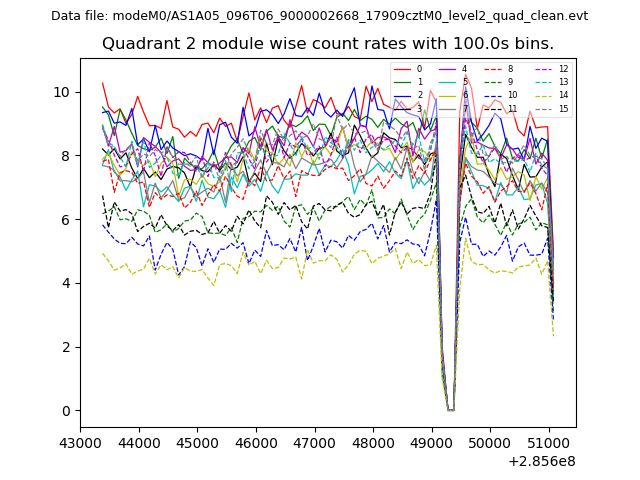
| Module-wise count rates for Quadrant B Data is divided into 100 sec bins |
 |
 |
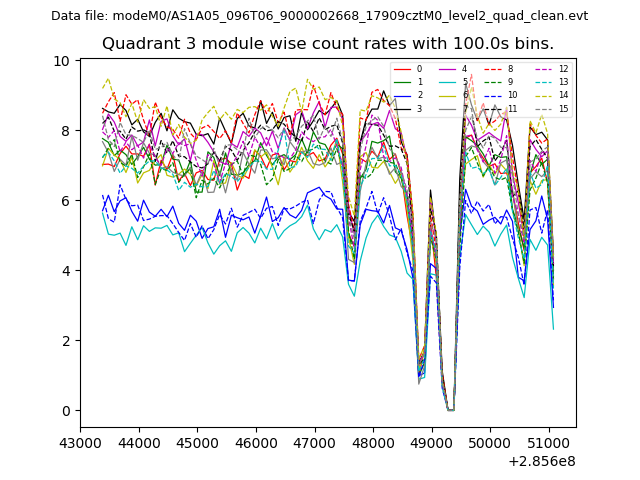
| Module-wise count rates for Quadrant C Data is divided into 100 sec bins |
 |
 |
| Module-wise count rates for Quadrant D Data is divided into 100 sec bins |
 |
 |
| Parameter | Plot |
|---|---|
| CZT HV Monitor | 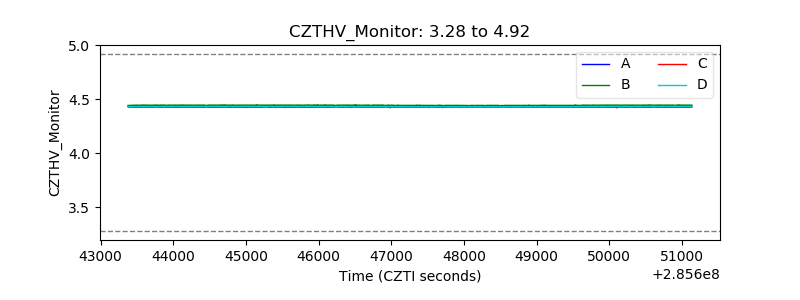 |
| D_VDD | 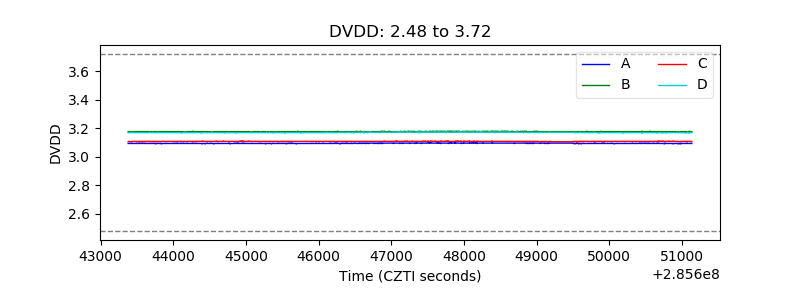 |
| Temperature 1 | 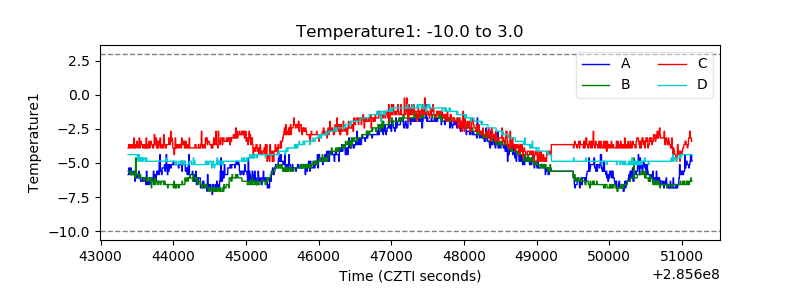 |
| Veto HV Monitor | 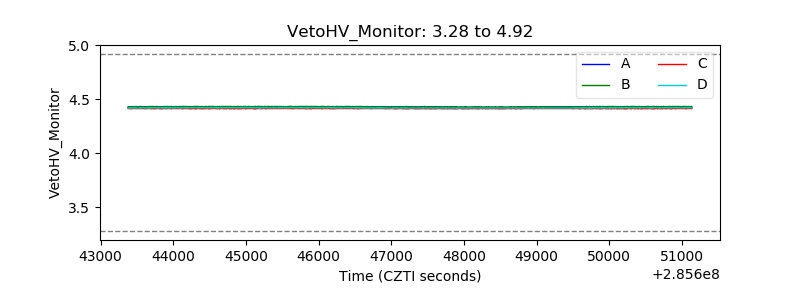 |
| Veto LLD | 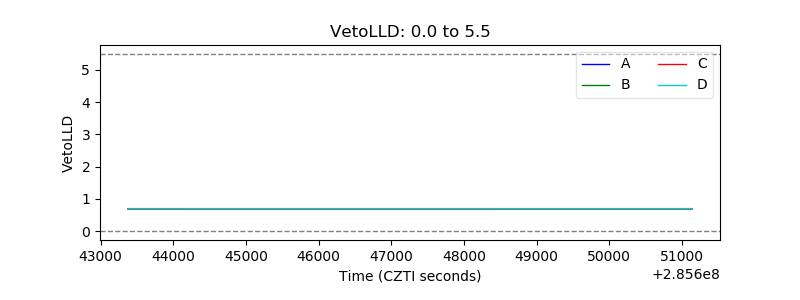 |
| Alpha Counter | 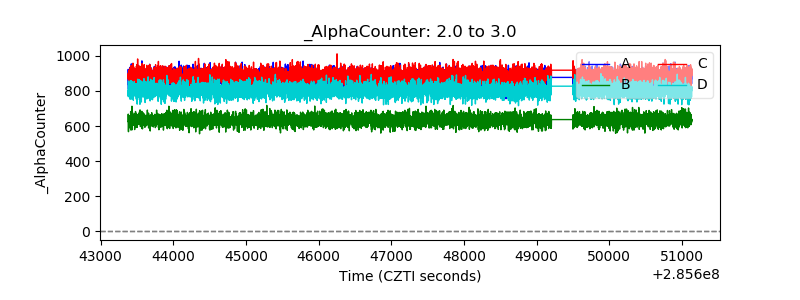 |
| _CPM_Rate | 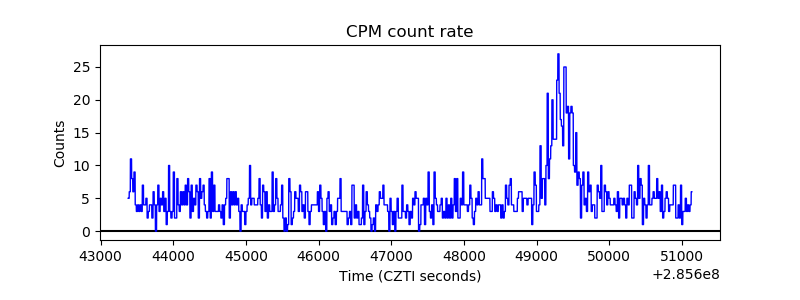 |
| CZT Counter | 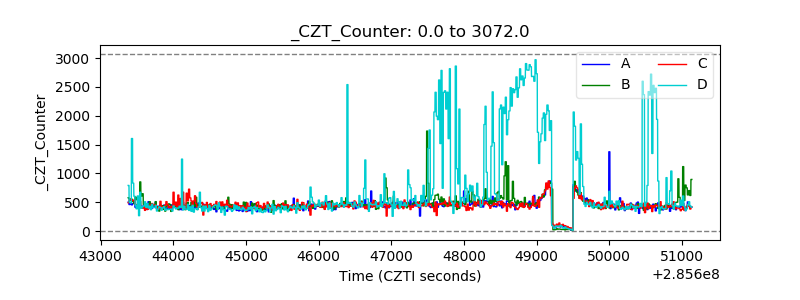 |
| +2.5 Volts monitor |  |
| +5 Volts monitor |  |
| _ROLL_ROT | 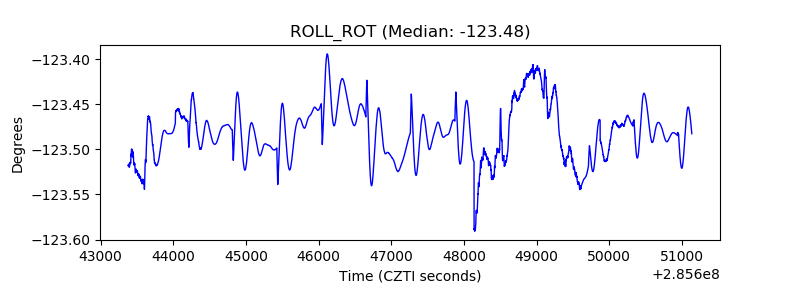 |
| _Roll_DEC |  |
| _Roll_RA | 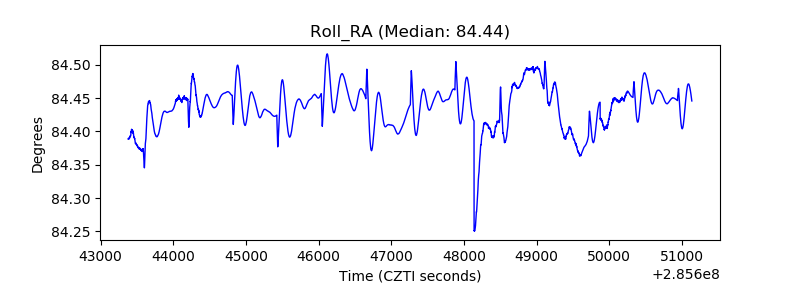 |
| Veto Counter |  |