| Param | Original file | Final file |
|---|---|---|
| Filename | modeM0/AS1A05_096T06_9000002668_17910cztM0_level2.evt | modeM0/AS1A05_096T06_9000002668_17910cztM0_level2_quad_clean.evt |
| Size (bytes) | 663,624,000 | 139,374,720 |
| Size | 632.9 MB | 132.9 MB |
| Events in quadrant A | 3,739,643 | 970,176 |
| Events in quadrant B | 4,219,354 | 993,850 |
| Events in quadrant C | 3,696,877 | 941,901 |
| Events in quadrant D | 7,903,143 | 762,384 |
| Mode M0 | |||
|---|---|---|---|
| Quadrant | BADHDUFLAG | Total packets | Discarded packets |
| A | 0 | 16671 | 2 |
| B | 0 | 17885 | 2 |
| C | 0 | 16396 | 2 |
| D | 0 | 29010 | 2 |
| Mode M9 | |||
|---|---|---|---|
| Quadrant | BADHDUFLAG | Total packets | Discarded packets |
| A | 0 | 6 | 0 |
| B | 0 | 6 | 0 |
| C | 0 | 6 | 0 |
| D | 0 | 6 | 0 |
| Mode SS | |||
|---|---|---|---|
| Quadrant | BADHDUFLAG | Total packets | Discarded packets |
| A | 0 | 162 | 0 |
| B | 0 | 162 | 0 |
| C | 0 | 162 | 0 |
| D | 0 | 162 | 0 |
| Quadrant | Total seconds | Saturated seconds | Saturation percentage |
|---|---|---|---|
| A | 7944 | 166 | 2.089627% |
| B | 7945 | 326 | 4.103210% |
| C | 7945 | 225 | 2.831970% |
| D | 7945 | 1853 | 23.322845% |
Noise dominated data is calculated using 1-second bins in cleaned event files. If a bin has >2000 counts, and if more than 50% of those come from <1% of pixels, then it is considered to be noise-dominated and hence unusable.
| Quadrant | # 1 sec bins | Bins with >0 counts | Bins with >2000 counts | High rate bins dominated by noise | Noise dominated (total time) | Noise dominated (detector-on time) | Marked lightcurve |
|---|---|---|---|---|---|---|---|
| A | 8514 | 7946 | 4 | 4 | 0.05% | 0.05% | 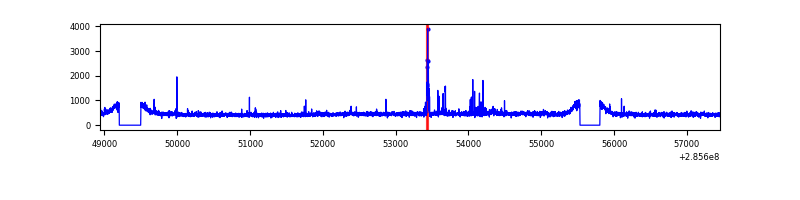 |
| B | 8515 | 7947 | 74 | 74 | 0.87% | 0.93% | 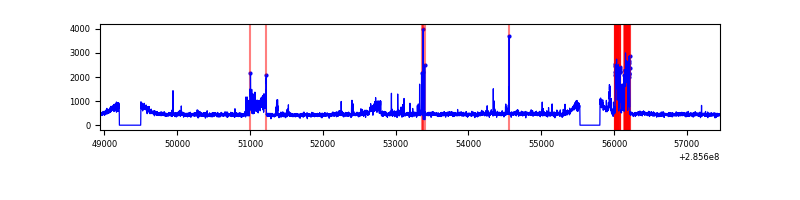 |
| C | 8515 | 7947 | 0 | 0 | 0.00% | 0.00% | 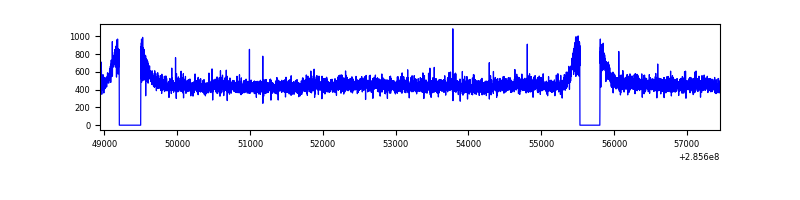 |
| D | 8515 | 7946 | 1305 | 1305 | 15.33% | 16.42% | 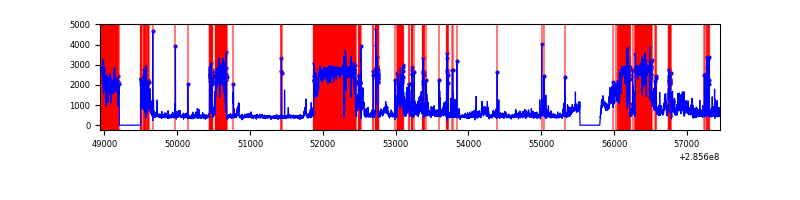 |
Top three noisy pixels from each quadrant. If the there are fewer than three noisy pixels in the level2.evt file, extra rows are filled as -1
| Pixel properties | Quadrant properties | ||||||
|---|---|---|---|---|---|---|---|
| Quadrant | DetID | PixID | Counts | Sigma | Mean | Median | Sigma |
| A | 15 | 174 | 111393 | 580.43 | 937 | 915 | 190.3 |
| A | 13 | 210 | 8312 | 38.86 | 937 | 915 | 190.3 |
| A | 0 | 226 | 8078 | 37.63 | 937 | 915 | 190.3 |
| B | 15 | 222 | 400664 | 2218.81 | 943 | 916 | 180.2 |
| B | 0 | 189 | 50296 | 274.08 | 943 | 916 | 180.2 |
| B | 7 | 220 | 22817 | 121.56 | 943 | 916 | 180.2 |
| C | 14 | 238 | 142612 | 667.34 | 908 | 912 | 212.3 |
| C | 13 | 61 | 6635 | 26.95 | 908 | 912 | 212.3 |
| C | 3 | 233 | 5399 | 21.13 | 908 | 912 | 212.3 |
| D | 7 | 238 | 4129459 | 22147.69 | 767 | 740 | 186.4 |
| D | 2 | 165 | 344820 | 1845.75 | 767 | 740 | 186.4 |
| D | 5 | 222 | 276297 | 1478.17 | 767 | 740 | 186.4 |
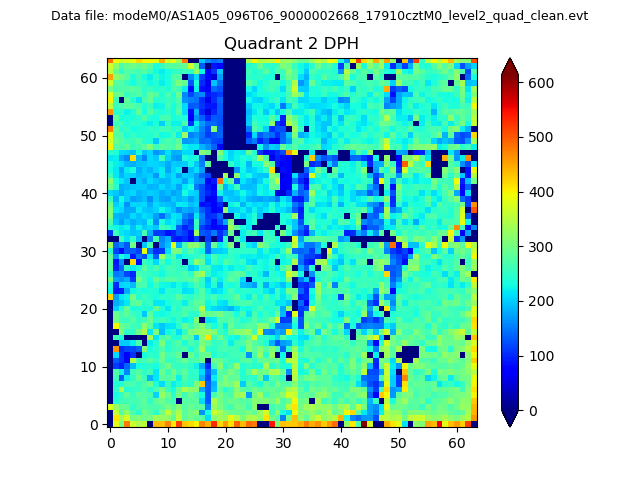
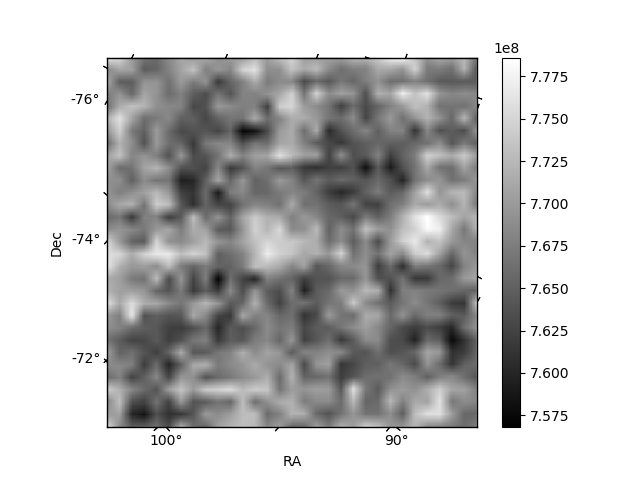
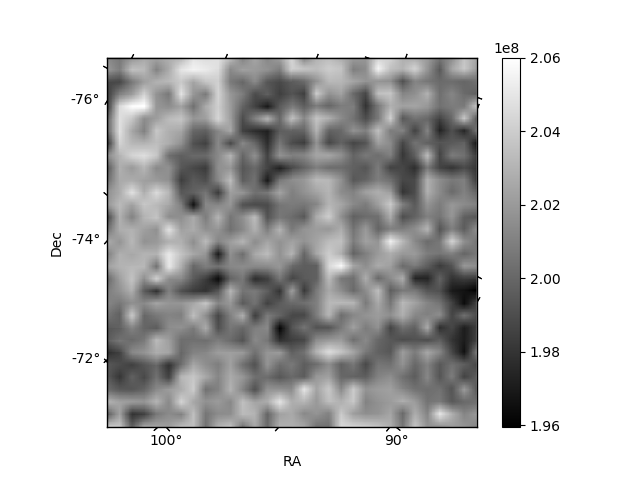
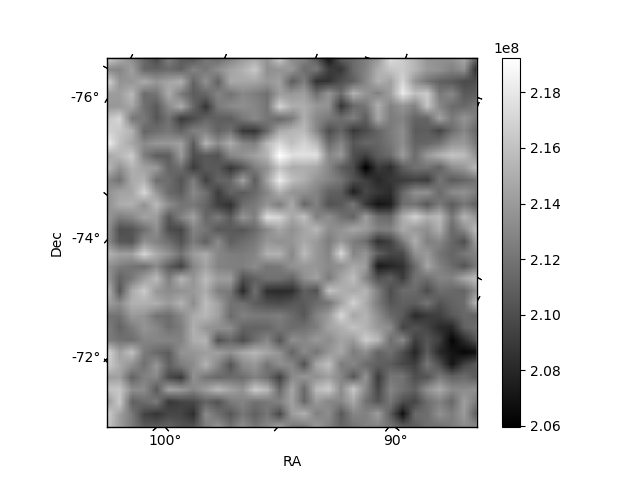
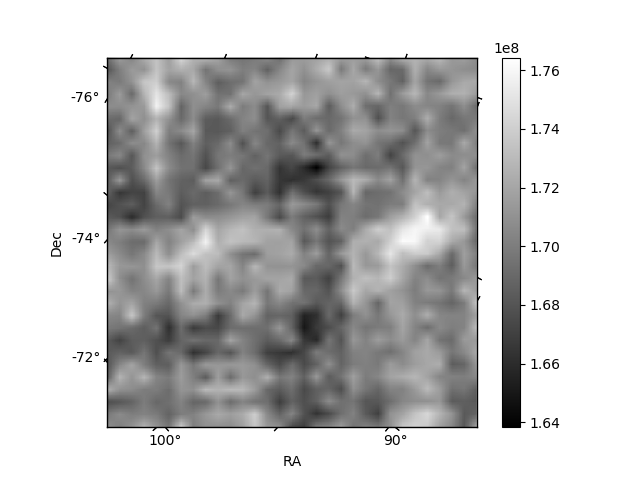
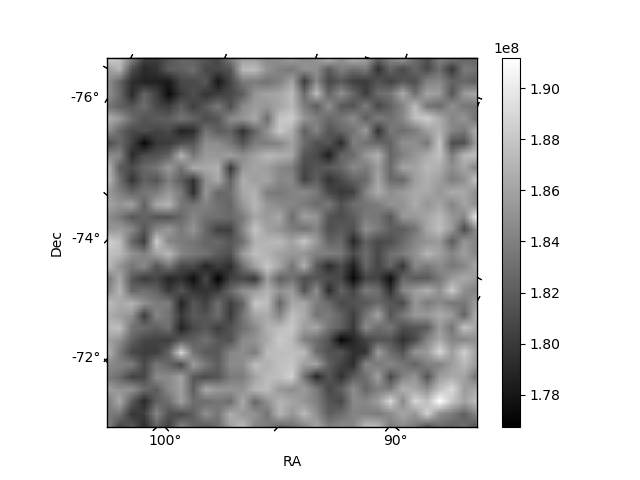
Histogram calculated using DETX and DETY for each event in the final _common_clean file
| Quadrant A | 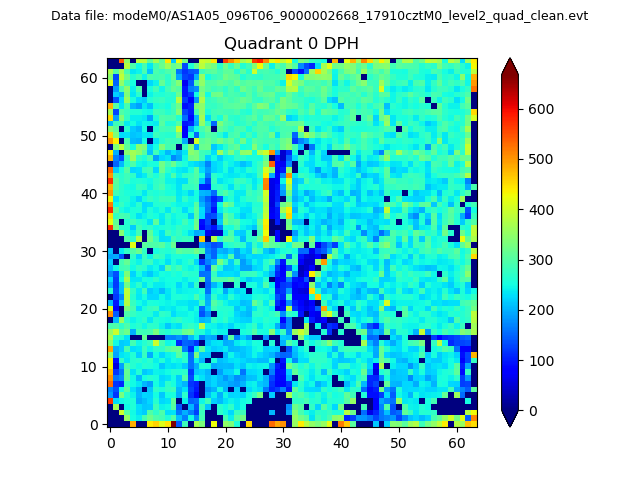 |
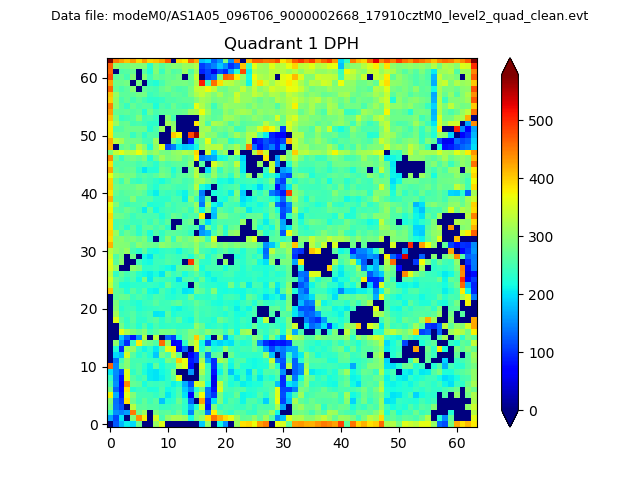 |
Quadrant B |
|---|---|---|---|
| Quadrant D | 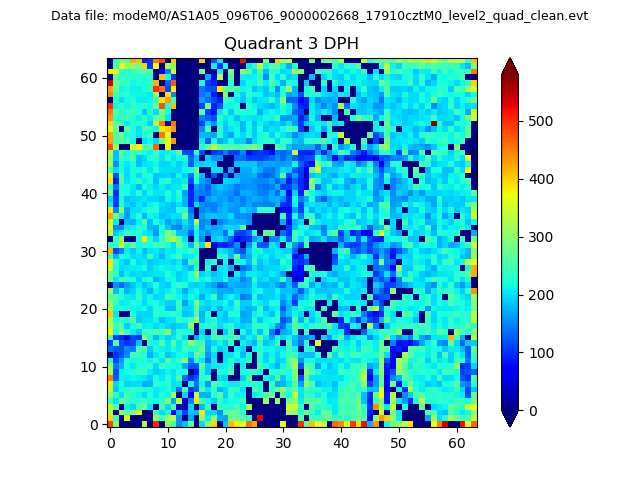 |
 |
Quadrant C |
| Plot type | Count rate plots | Images |
|---|---|---|
| Comparison with Poisson distribution Blue bars denote a histogram of data divided into 1 sec bins. Red curve is a Poisson curve with rate = median count rate of data. |
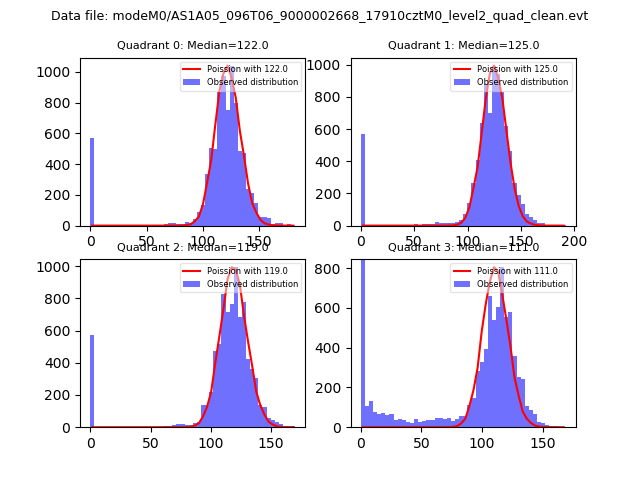 |
 |
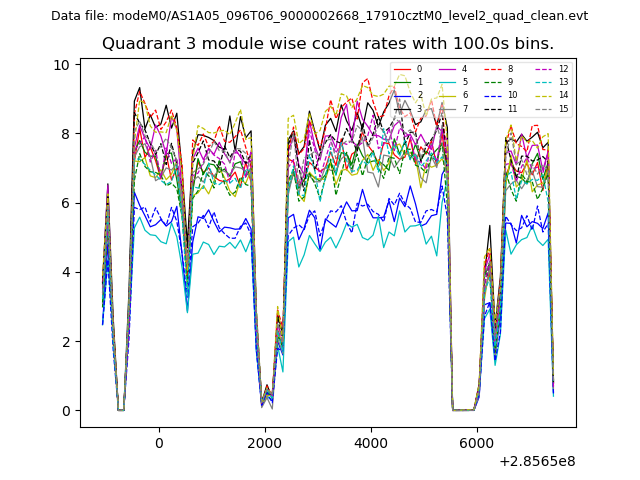
| Quadrant-wise count rates Data is divided into 100 sec bins |
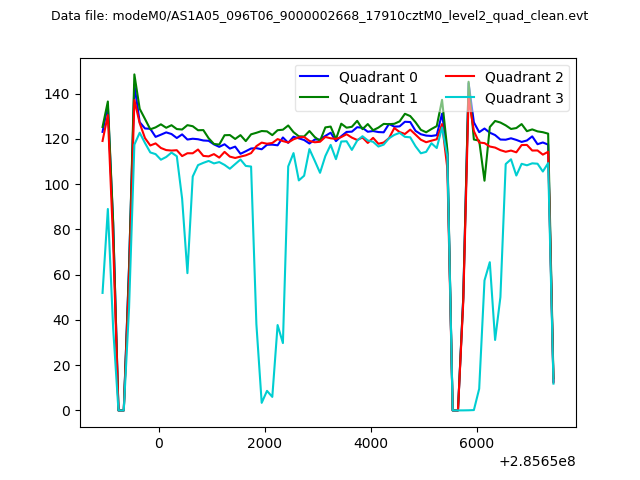 |
|
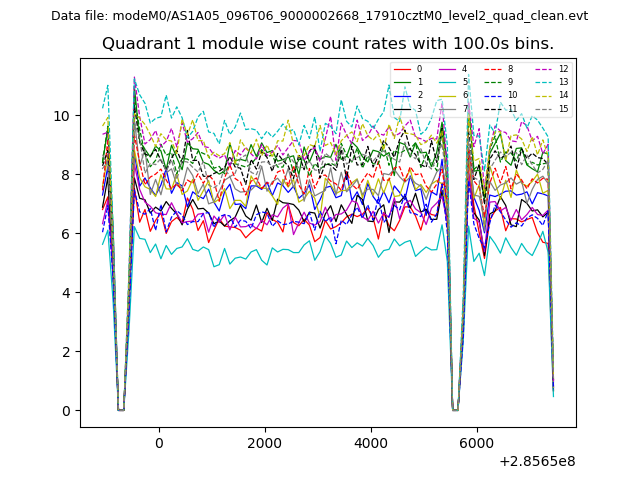
| Module-wise count rates for Quadrant A Data is divided into 100 sec bins |
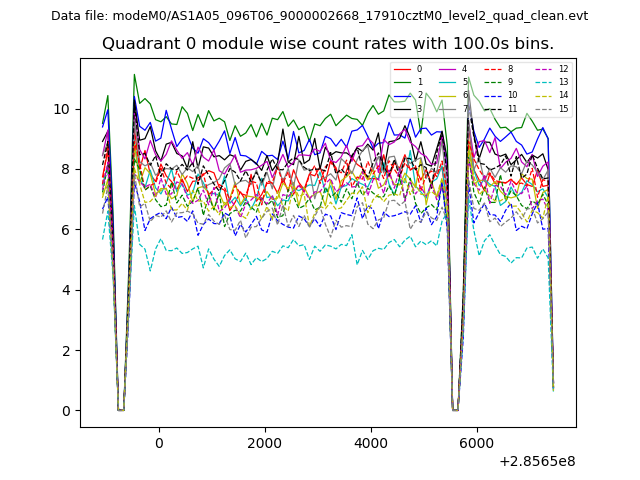 |
 |
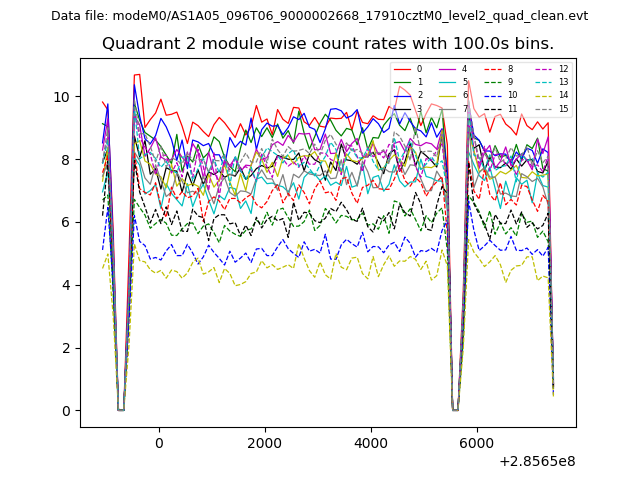
| Module-wise count rates for Quadrant B Data is divided into 100 sec bins |
 |
 |
| Module-wise count rates for Quadrant C Data is divided into 100 sec bins |
 |
 |
| Module-wise count rates for Quadrant D Data is divided into 100 sec bins |
 |
 |
| Parameter | Plot |
|---|---|
| CZT HV Monitor | 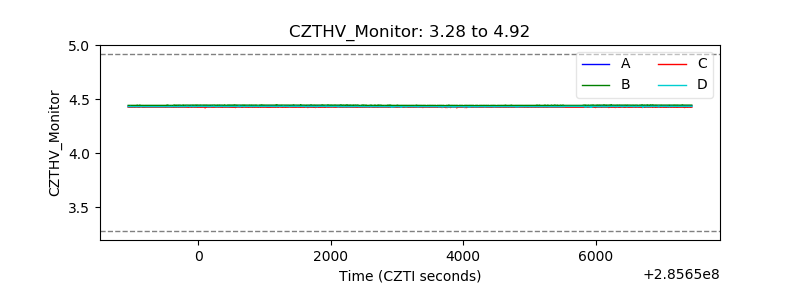 |
| D_VDD | 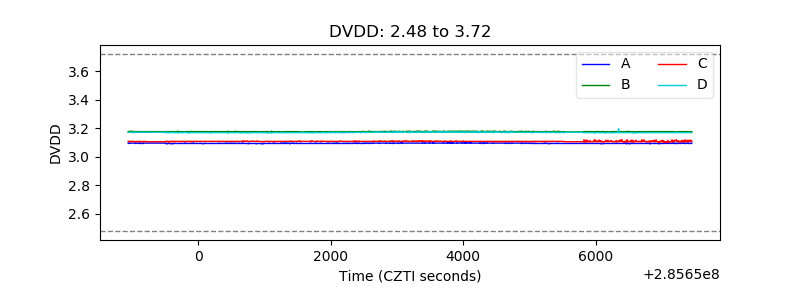 |
| Temperature 1 | 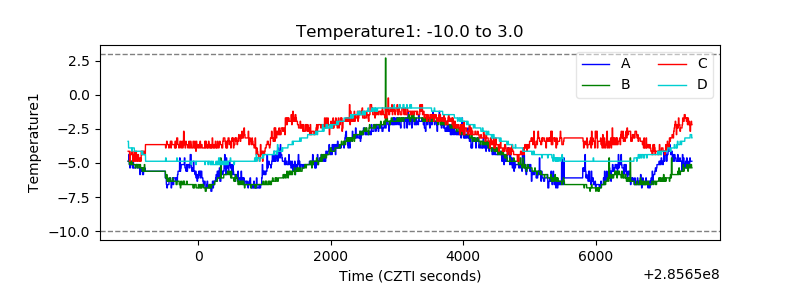 |
| Veto HV Monitor | 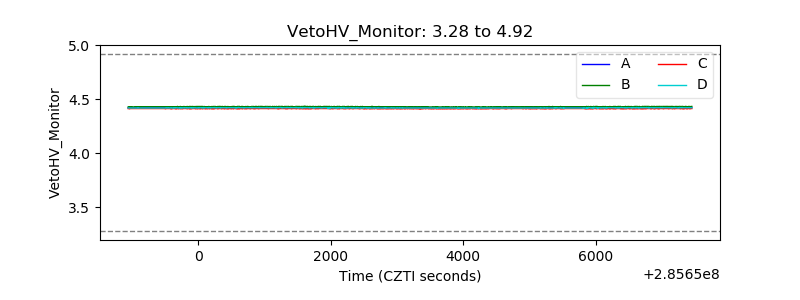 |
| Veto LLD | 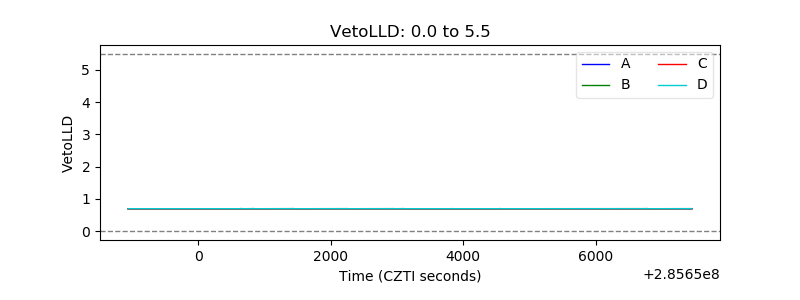 |
| Alpha Counter | 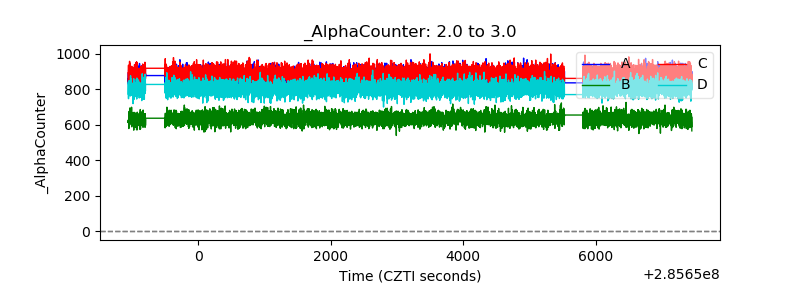 |
| _CPM_Rate | 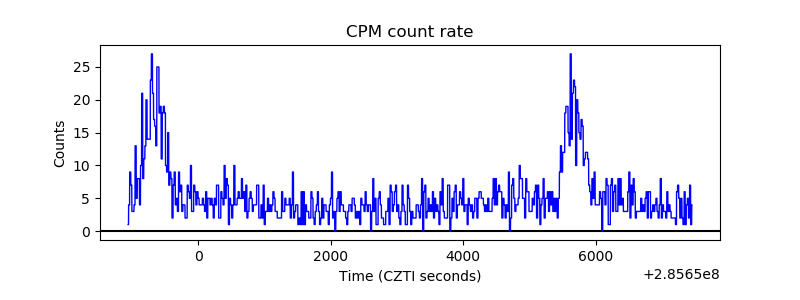 |
| CZT Counter | 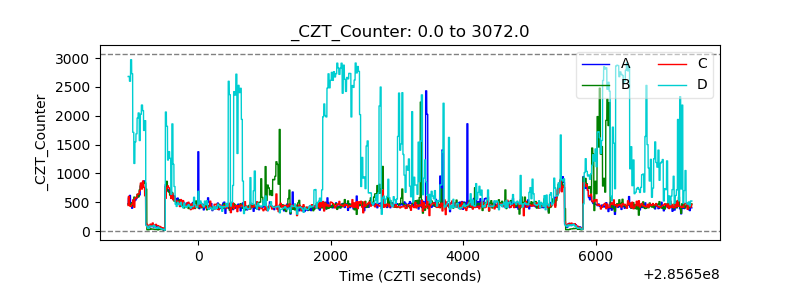 |
| +2.5 Volts monitor |  |
| +5 Volts monitor |  |
| _ROLL_ROT | 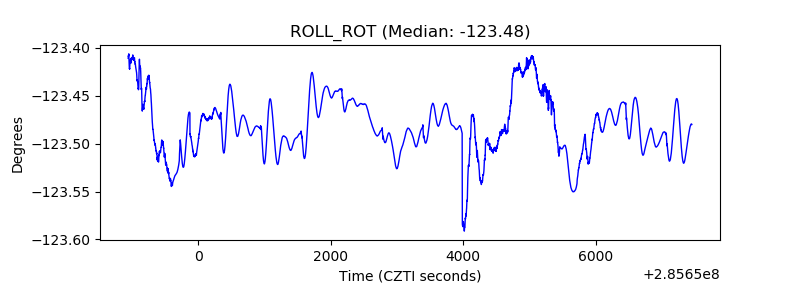 |
| _Roll_DEC |  |
| _Roll_RA | 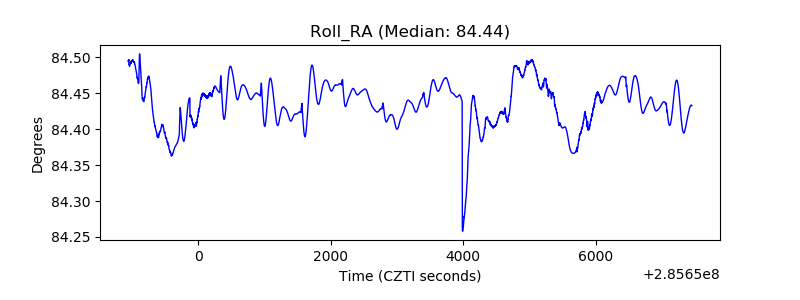 |
| Veto Counter | 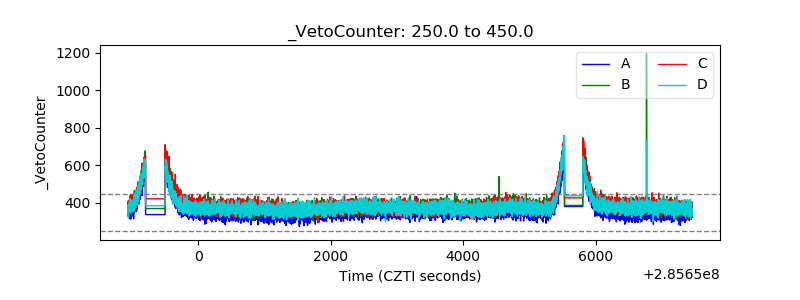 |