| Param | Original file | Final file |
|---|---|---|
| Filename | modeM0/AS1A05_096T06_9000002668_17914cztM0_level2.evt | modeM0/AS1A05_096T06_9000002668_17914cztM0_level2_quad_clean.evt |
| Size (bytes) | 608,054,400 | 148,610,880 |
| Size | 579.9 MB | 141.7 MB |
| Events in quadrant A | 3,810,773 | 1,001,374 |
| Events in quadrant B | 4,327,505 | 1,022,686 |
| Events in quadrant C | 3,784,319 | 979,632 |
| Events in quadrant D | 5,927,310 | 918,610 |
| Mode M0 | |||
|---|---|---|---|
| Quadrant | BADHDUFLAG | Total packets | Discarded packets |
| A | 0 | 17149 | 1 |
| B | 0 | 18266 | 1 |
| C | 0 | 16869 | 1 |
| D | 0 | 23352 | 1 |
| Mode M9 | |||
|---|---|---|---|
| Quadrant | BADHDUFLAG | Total packets | Discarded packets |
| A | 0 | 4 | 0 |
| B | 0 | 4 | 0 |
| C | 0 | 4 | 0 |
| D | 0 | 4 | 0 |
| Mode SS | |||
|---|---|---|---|
| Quadrant | BADHDUFLAG | Total packets | Discarded packets |
| A | 0 | 170 | 0 |
| B | 0 | 170 | 0 |
| C | 0 | 170 | 0 |
| D | 0 | 170 | 0 |
| Quadrant | Total seconds | Saturated seconds | Saturation percentage |
|---|---|---|---|
| A | 8324 | 84 | 1.009130% |
| B | 8325 | 176 | 2.114114% |
| C | 8325 | 97 | 1.165165% |
| D | 8325 | 530 | 6.366366% |
Noise dominated data is calculated using 1-second bins in cleaned event files. If a bin has >2000 counts, and if more than 50% of those come from <1% of pixels, then it is considered to be noise-dominated and hence unusable.
| Quadrant | # 1 sec bins | Bins with >0 counts | Bins with >2000 counts | High rate bins dominated by noise | Noise dominated (total time) | Noise dominated (detector-on time) | Marked lightcurve |
|---|---|---|---|---|---|---|---|
| A | 8774 | 8325 | 12 | 12 | 0.14% | 0.14% | 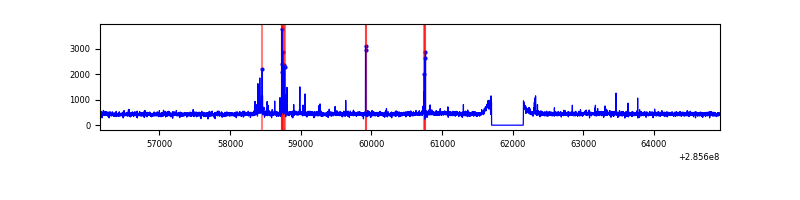 |
| B | 8775 | 8326 | 72 | 72 | 0.82% | 0.86% | 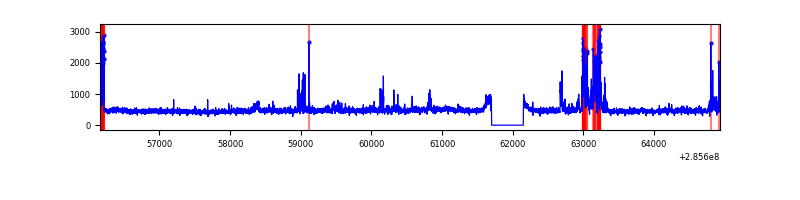 |
| C | 8775 | 8325 | 0 | 0 | 0.00% | 0.00% | 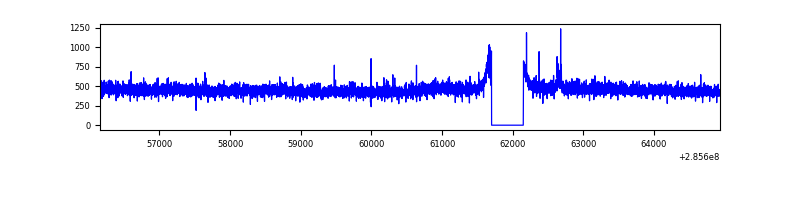 |
| D | 8775 | 8326 | 413 | 413 | 4.71% | 4.96% | 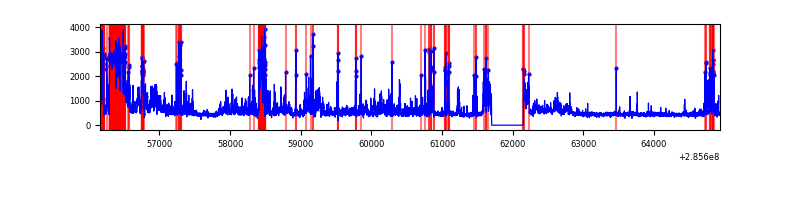 |
Top three noisy pixels from each quadrant. If the there are fewer than three noisy pixels in the level2.evt file, extra rows are filled as -1
| Pixel properties | Quadrant properties | ||||||
|---|---|---|---|---|---|---|---|
| Quadrant | DetID | PixID | Counts | Sigma | Mean | Median | Sigma |
| A | 15 | 174 | 99025 | 504.55 | 956 | 934 | 194.4 |
| A | 4 | 2 | 33356 | 166.77 | 956 | 934 | 194.4 |
| A | 0 | 226 | 8262 | 37.69 | 956 | 934 | 194.4 |
| B | 15 | 222 | 381765 | 2077.09 | 958 | 934 | 183.3 |
| B | 7 | 220 | 55959 | 300.11 | 958 | 934 | 183.3 |
| B | 5 | 143 | 45105 | 240.91 | 958 | 934 | 183.3 |
| C | 14 | 238 | 142375 | 655.87 | 926 | 930 | 215.7 |
| C | 9 | 54 | 15847 | 69.17 | 926 | 930 | 215.7 |
| C | 8 | 128 | 9584 | 40.13 | 926 | 930 | 215.7 |
| D | 7 | 238 | 1439112 | 6590.09 | 907 | 879 | 218.2 |
| D | 5 | 222 | 784546 | 3590.82 | 907 | 879 | 218.2 |
| D | 2 | 165 | 148604 | 676.89 | 907 | 879 | 218.2 |
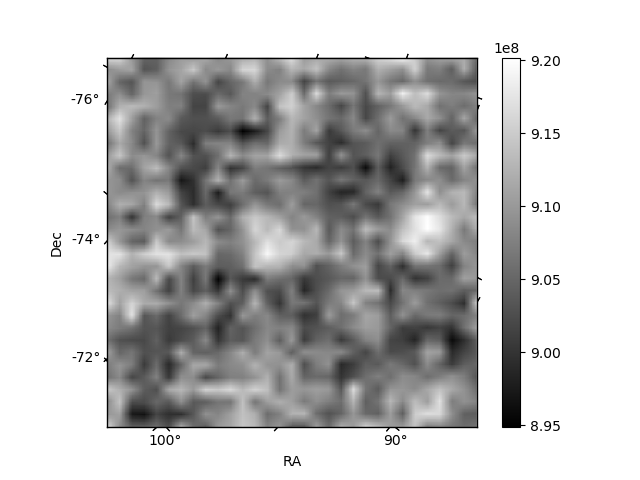
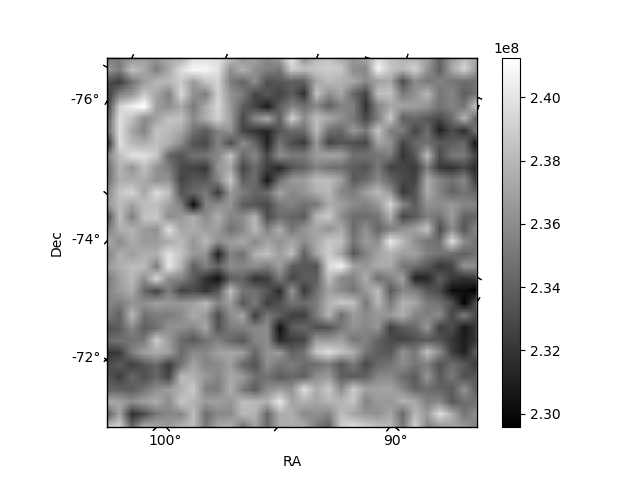
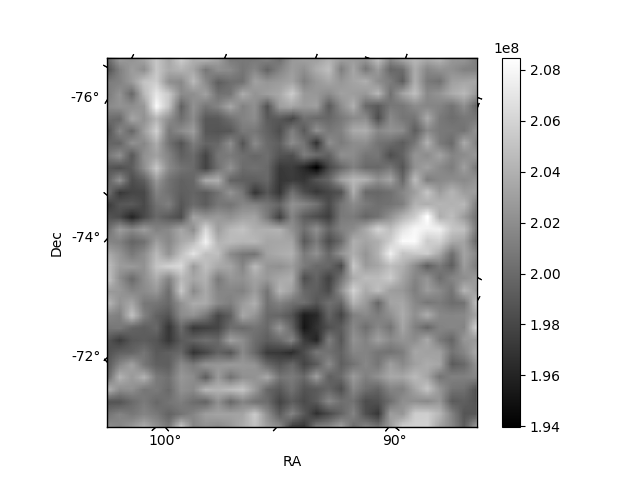
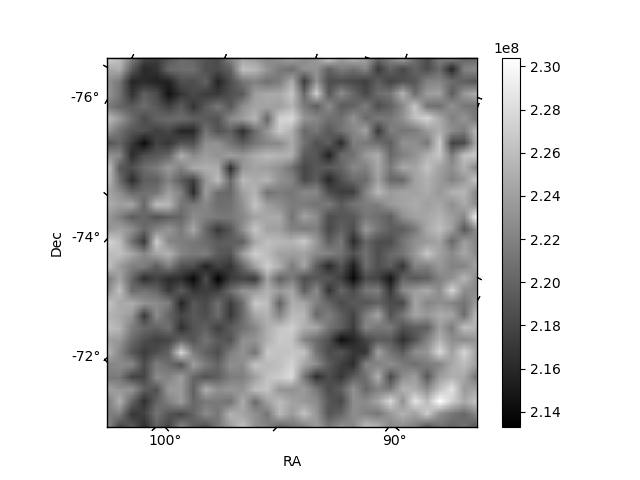
Histogram calculated using DETX and DETY for each event in the final _common_clean file
| Quadrant A | 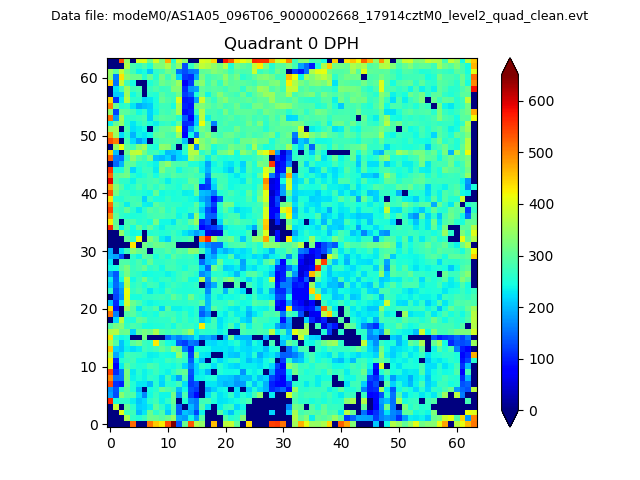 |
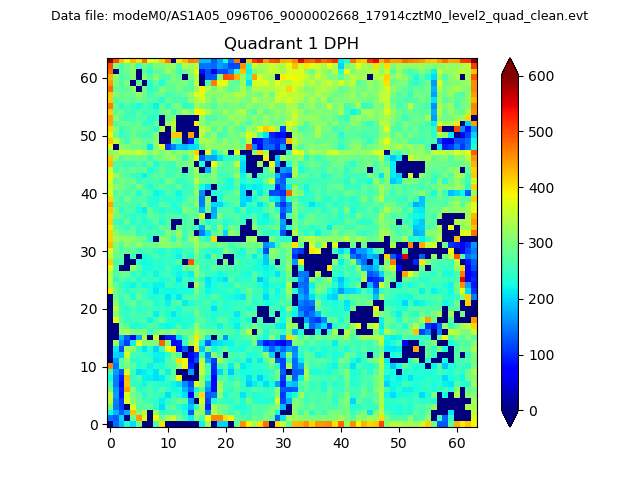 |
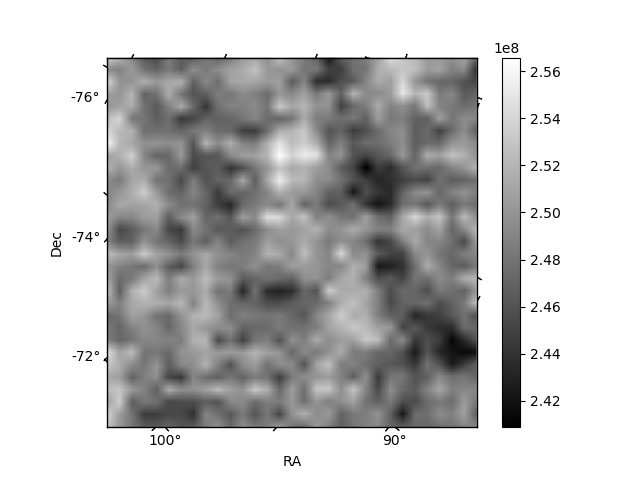
Quadrant B |
|---|---|---|---|
| Quadrant D | 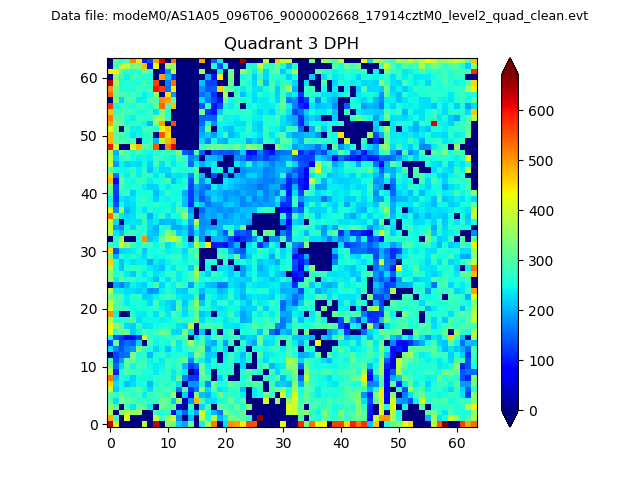 |
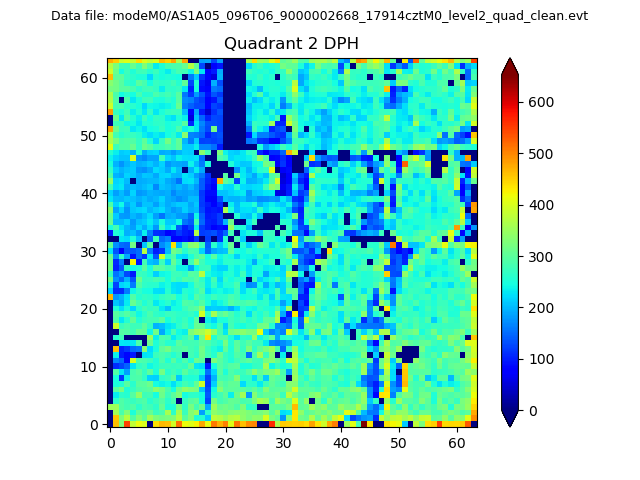 |
Quadrant C |
| Plot type | Count rate plots | Images |
|---|---|---|
| Comparison with Poisson distribution Blue bars denote a histogram of data divided into 1 sec bins. Red curve is a Poisson curve with rate = median count rate of data. |
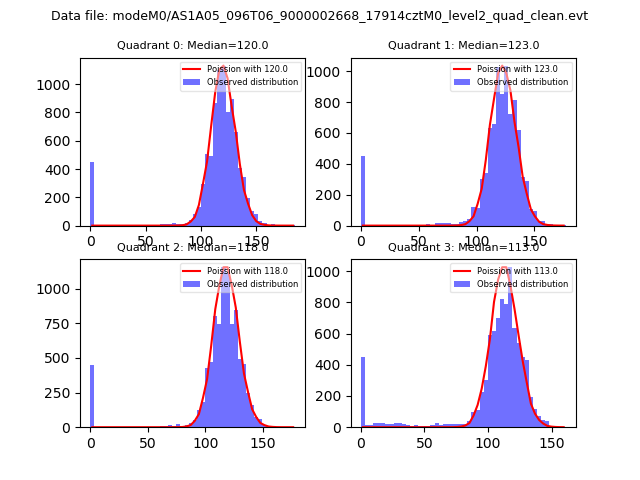 |
 |
| Quadrant-wise count rates Data is divided into 100 sec bins |
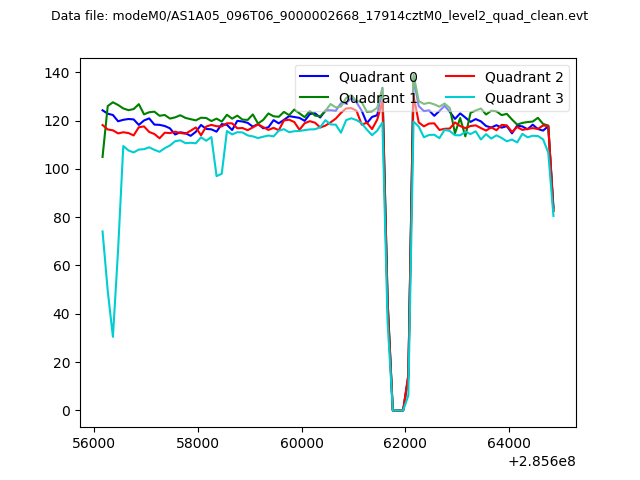 |
|
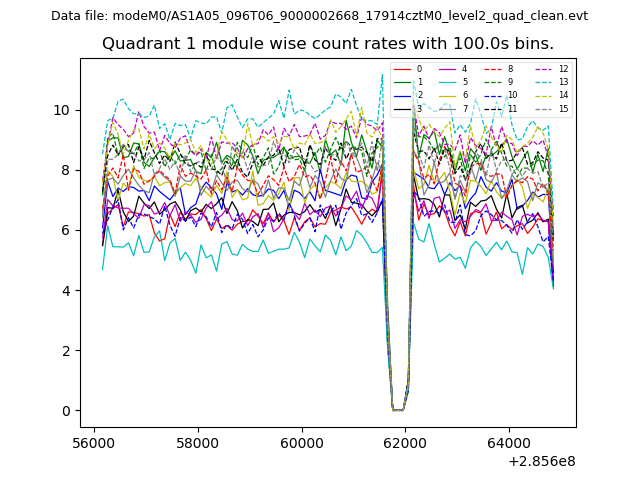
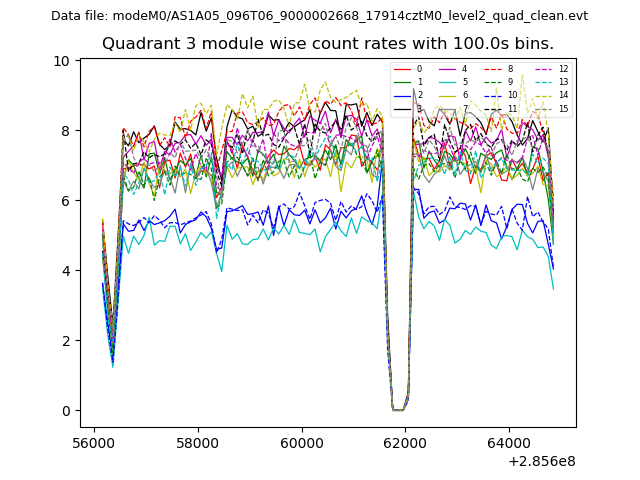
| Module-wise count rates for Quadrant A Data is divided into 100 sec bins |
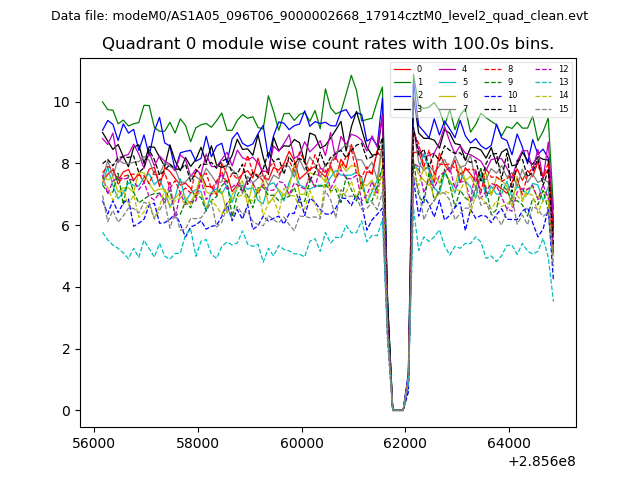 |
 |
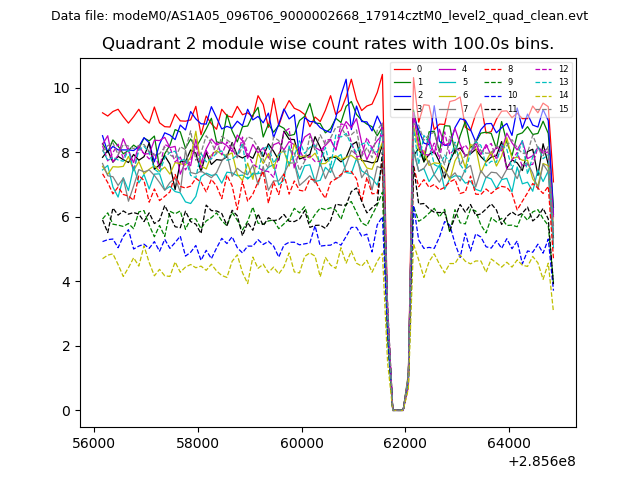
| Module-wise count rates for Quadrant B Data is divided into 100 sec bins |
 |
 |
| Module-wise count rates for Quadrant C Data is divided into 100 sec bins |
 |
 |
| Module-wise count rates for Quadrant D Data is divided into 100 sec bins |
 |
 |
| Parameter | Plot |
|---|---|
| CZT HV Monitor | 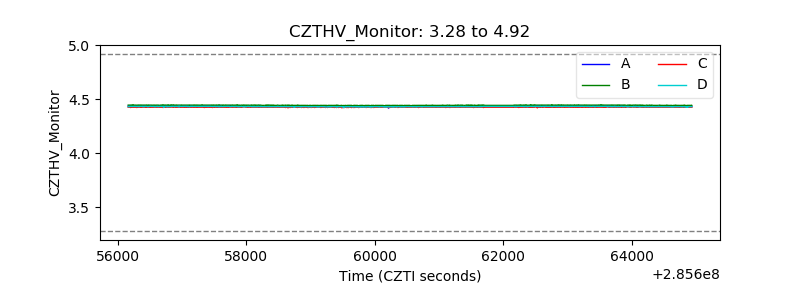 |
| D_VDD | 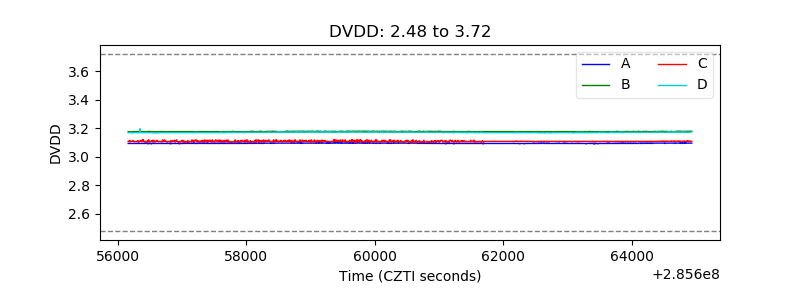 |
| Temperature 1 | 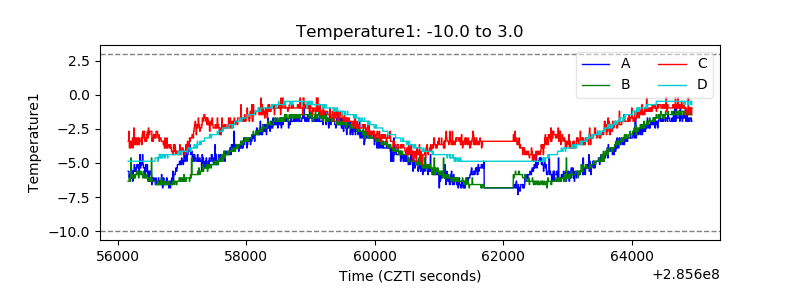 |
| Veto HV Monitor | 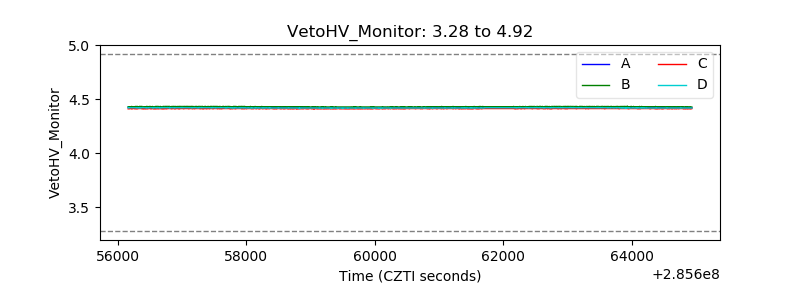 |
| Veto LLD | 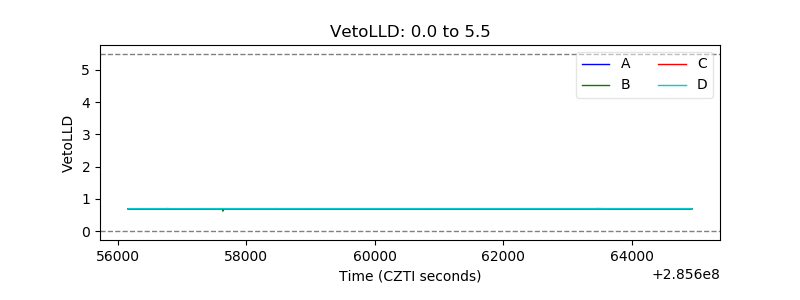 |
| Alpha Counter | 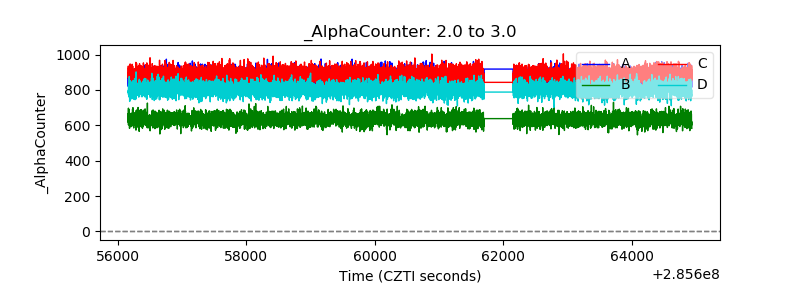 |
| _CPM_Rate | 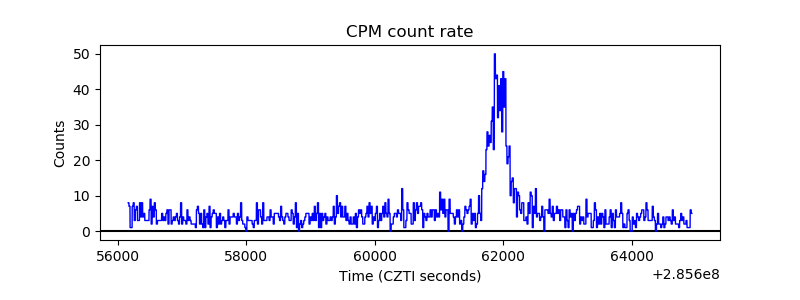 |
| CZT Counter | 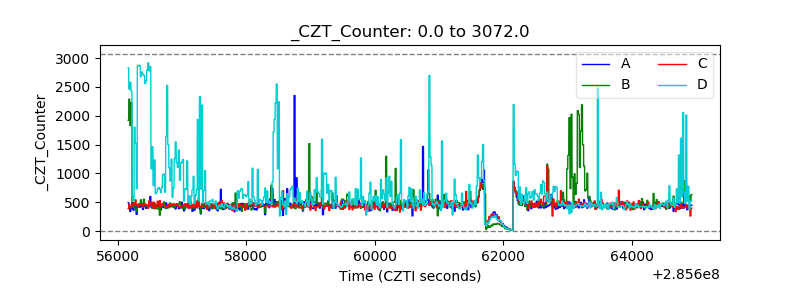 |
| +2.5 Volts monitor |  |
| +5 Volts monitor |  |
| _ROLL_ROT | 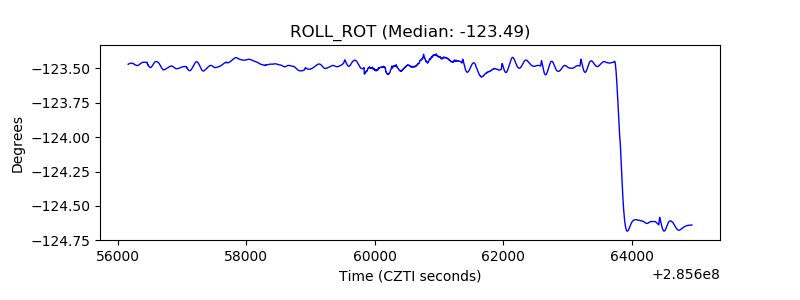 |
| _Roll_DEC | 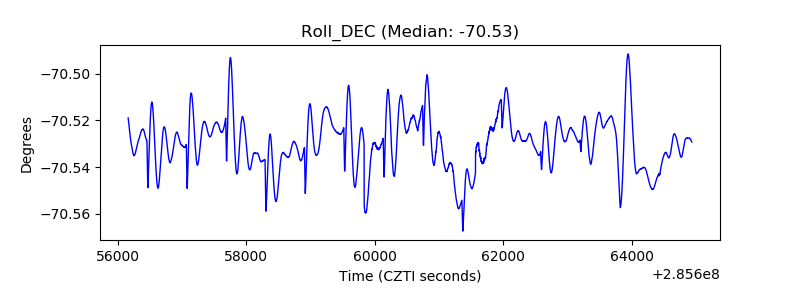 |
| _Roll_RA | 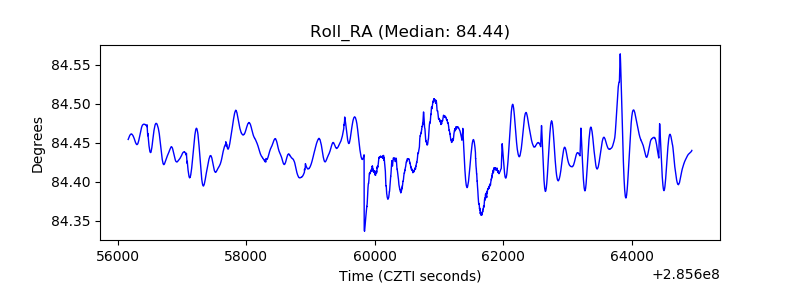 |
| Veto Counter | 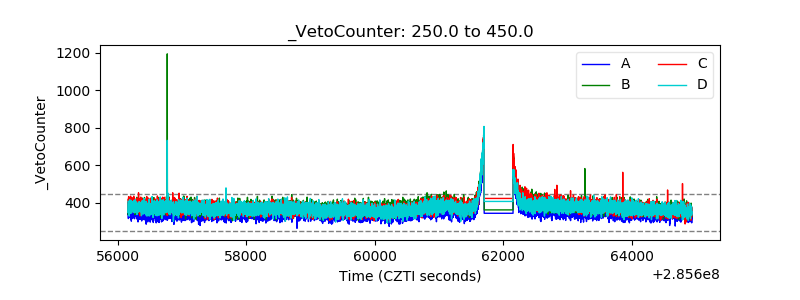 |