| Param | Original file | Final file |
|---|---|---|
| Filename | modeM0/AS1A05_096T06_9000002668_17916cztM0_level2.evt | modeM0/AS1A05_096T06_9000002668_17916cztM0_level2_quad_clean.evt |
| Size (bytes) | 1,519,917,120 | 395,375,040 |
| Size | 1.4 GB | 377.1 MB |
| Events in quadrant A | 10,465,929 | 2,665,704 |
| Events in quadrant B | 10,830,423 | 2,722,012 |
| Events in quadrant C | 9,789,060 | 2,607,341 |
| Events in quadrant D | 13,505,789 | 2,514,559 |
| Mode M0 | |||
|---|---|---|---|
| Quadrant | BADHDUFLAG | Total packets | Discarded packets |
| A | 0 | 45876 | 4 |
| B | 0 | 46048 | 4 |
| C | 0 | 43760 | 4 |
| D | 0 | 55057 | 4 |
| Mode M9 | |||
|---|---|---|---|
| Quadrant | BADHDUFLAG | Total packets | Discarded packets |
| A | 0 | 34 | 0 |
| B | 0 | 34 | 0 |
| C | 0 | 34 | 0 |
| D | 0 | 34 | 0 |
| Mode SS | |||
|---|---|---|---|
| Quadrant | BADHDUFLAG | Total packets | Discarded packets |
| A | 0 | 432 | 0 |
| B | 0 | 432 | 0 |
| C | 0 | 432 | 0 |
| D | 0 | 432 | 0 |
| Quadrant | Total seconds | Saturated seconds | Saturation percentage |
|---|---|---|---|
| A | 21307 | 399 | 1.872624% |
| B | 21308 | 341 | 1.600338% |
| C | 21308 | 331 | 1.553407% |
| D | 21308 | 1036 | 4.862024% |
Noise dominated data is calculated using 1-second bins in cleaned event files. If a bin has >2000 counts, and if more than 50% of those come from <1% of pixels, then it is considered to be noise-dominated and hence unusable.
| Quadrant | # 1 sec bins | Bins with >0 counts | Bins with >2000 counts | High rate bins dominated by noise | Noise dominated (total time) | Noise dominated (detector-on time) | Marked lightcurve |
|---|---|---|---|---|---|---|---|
| A | 24672 | 21309 | 116 | 116 | 0.47% | 0.54% | 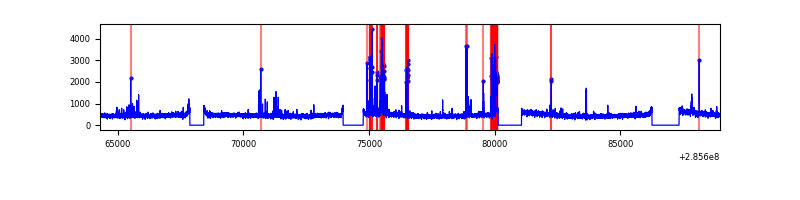 |
| B | 24673 | 21310 | 53 | 53 | 0.21% | 0.25% | 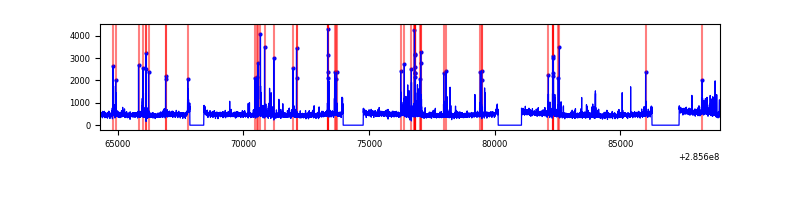 |
| C | 24673 | 21310 | 0 | 0 | 0.00% | 0.00% | 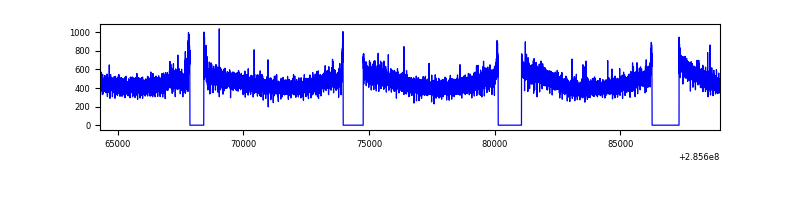 |
| D | 24673 | 21310 | 707 | 707 | 2.87% | 3.32% | 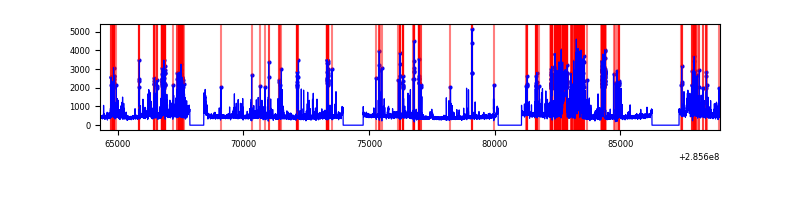 |
Top three noisy pixels from each quadrant. If the there are fewer than three noisy pixels in the level2.evt file, extra rows are filled as -1
| Pixel properties | Quadrant properties | ||||||
|---|---|---|---|---|---|---|---|
| Quadrant | DetID | PixID | Counts | Sigma | Mean | Median | Sigma |
| A | 15 | 174 | 435970 | 860.34 | 2511 | 2456 | 503.9 |
| A | 4 | 2 | 321520 | 633.2 | 2511 | 2456 | 503.9 |
| A | 5 | 168 | 46220 | 86.85 | 2511 | 2456 | 503.9 |
| B | 7 | 220 | 340355 | 714.38 | 2521 | 2461 | 473.0 |
| B | 0 | 189 | 134822 | 279.84 | 2521 | 2461 | 473.0 |
| B | 4 | 216 | 110553 | 228.53 | 2521 | 2461 | 473.0 |
| C | 14 | 238 | 375617 | 665.84 | 2405 | 2411 | 560.5 |
| C | 3 | 233 | 27984 | 45.63 | 2405 | 2411 | 560.5 |
| C | 13 | 61 | 17016 | 26.06 | 2405 | 2411 | 560.5 |
| D | 5 | 222 | 1832636 | 2968.62 | 2389 | 2326 | 616.6 |
| D | 7 | 238 | 1515015 | 2453.47 | 2389 | 2326 | 616.6 |
| D | 2 | 165 | 287736 | 462.91 | 2389 | 2326 | 616.6 |
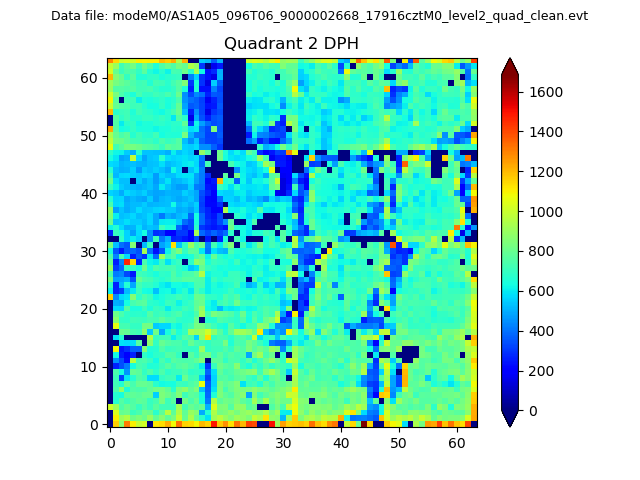
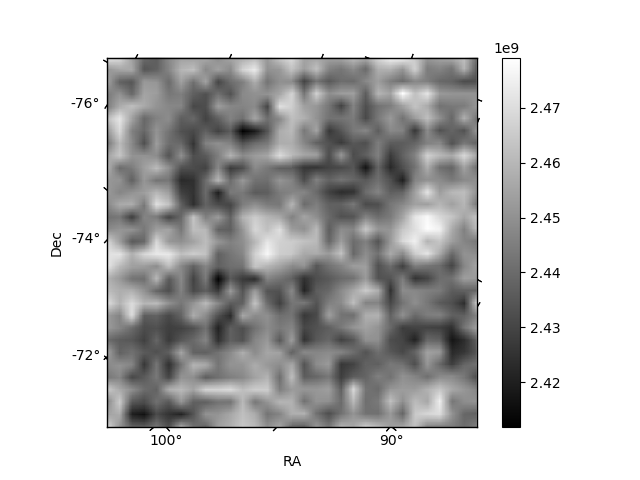
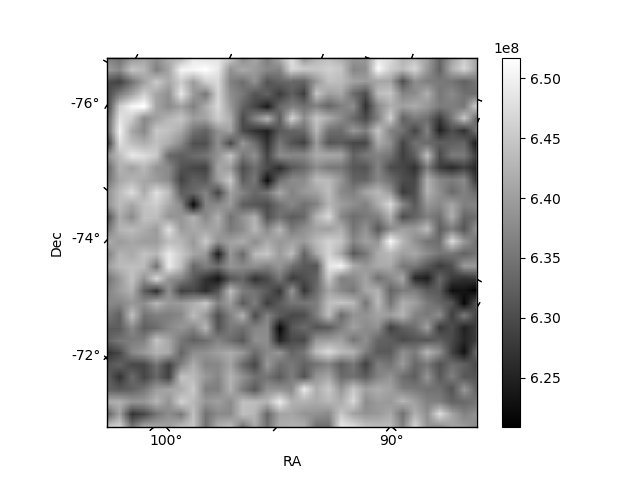
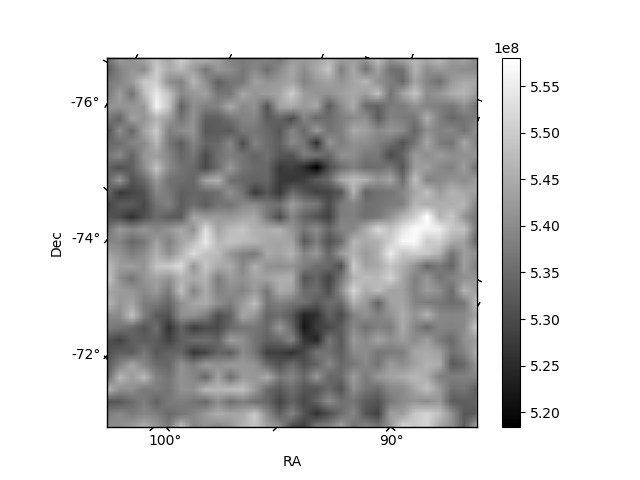
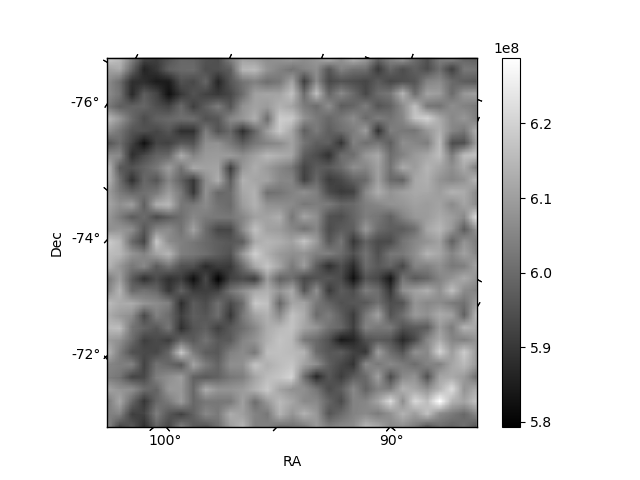
Histogram calculated using DETX and DETY for each event in the final _common_clean file
| Quadrant A | 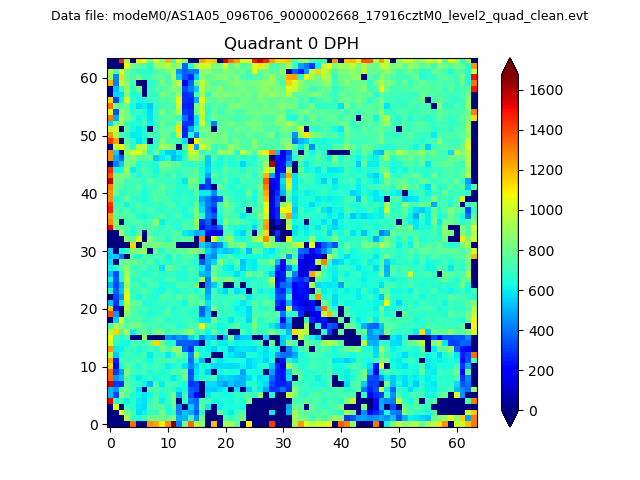 |
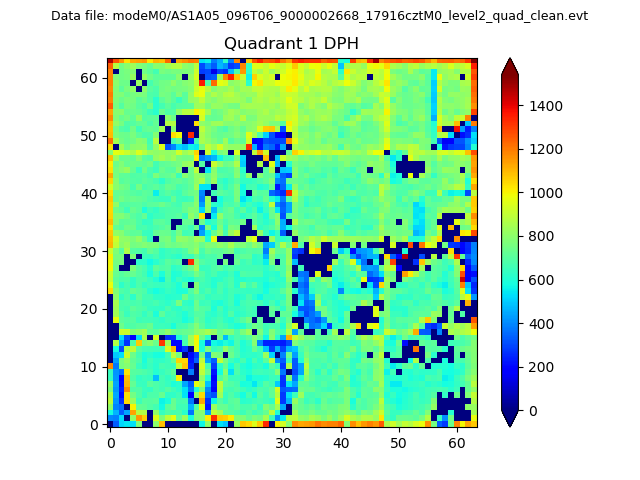 |
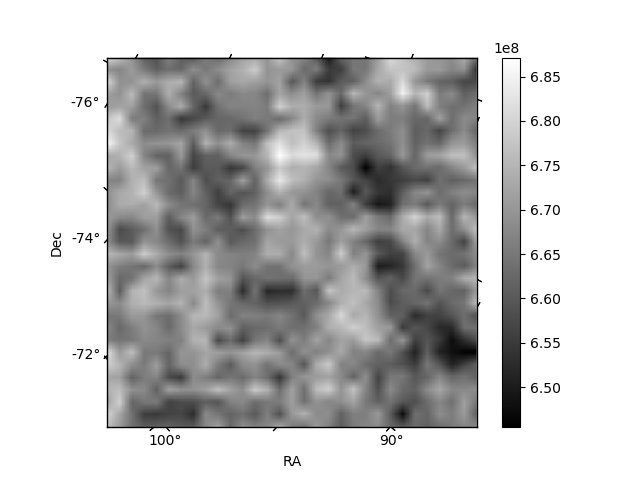
Quadrant B |
|---|---|---|---|
| Quadrant D | 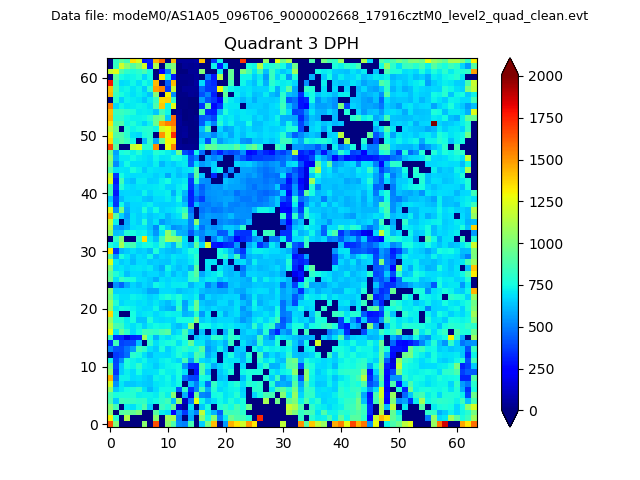 |
 |
Quadrant C |
| Plot type | Count rate plots | Images |
|---|---|---|
| Comparison with Poisson distribution Blue bars denote a histogram of data divided into 1 sec bins. Red curve is a Poisson curve with rate = median count rate of data. |
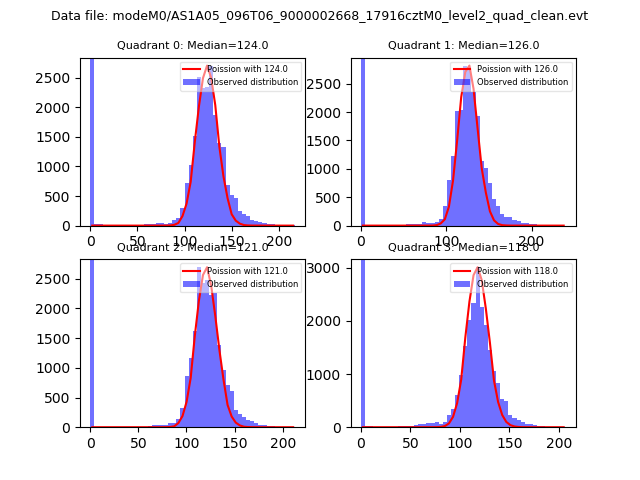 |
 |
| Quadrant-wise count rates Data is divided into 100 sec bins |
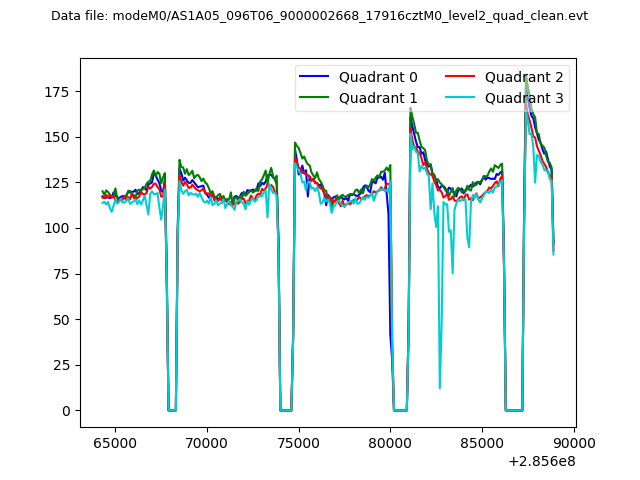 |
|
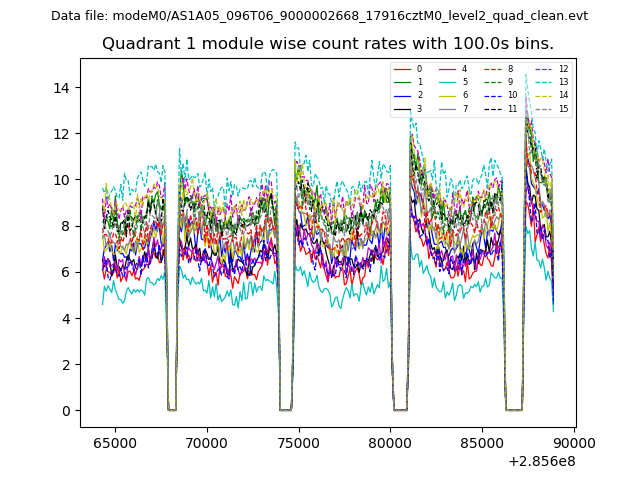
| Module-wise count rates for Quadrant A Data is divided into 100 sec bins |
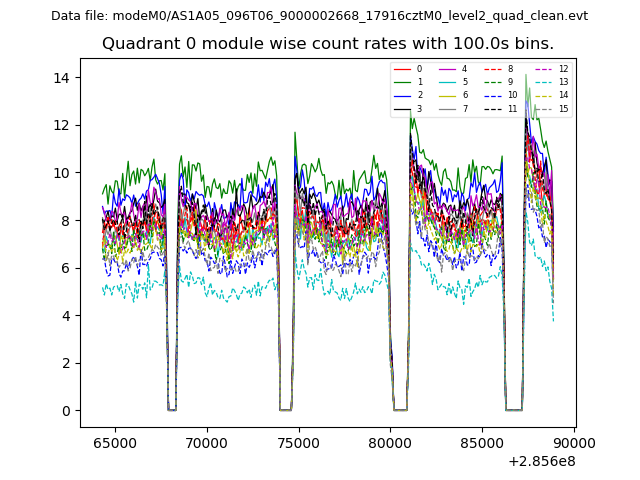 |
 |
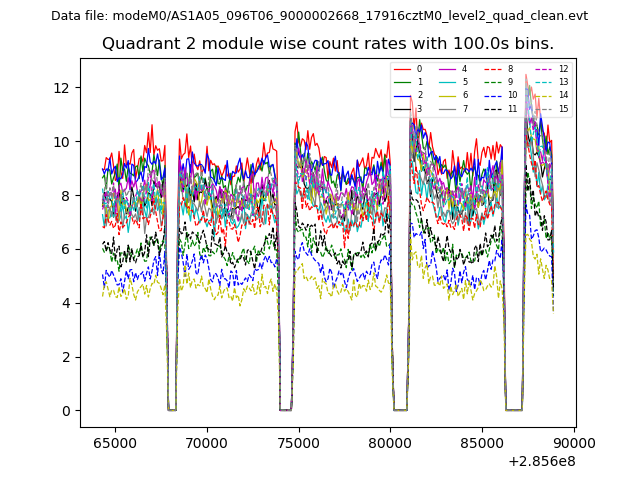
| Module-wise count rates for Quadrant B Data is divided into 100 sec bins |
 |
 |
| Module-wise count rates for Quadrant C Data is divided into 100 sec bins |
 |
 |
| Module-wise count rates for Quadrant D Data is divided into 100 sec bins |
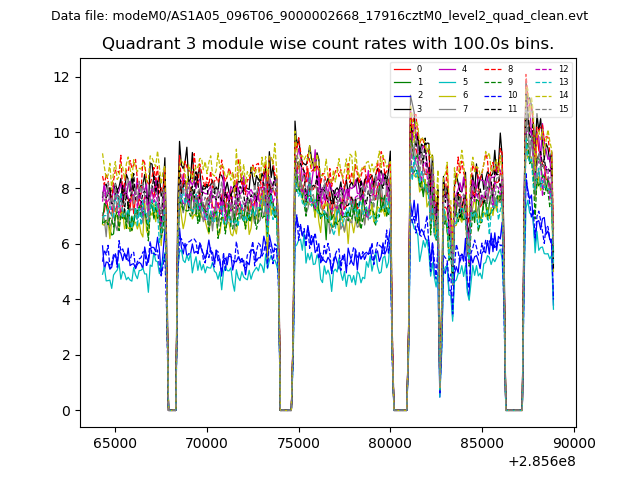 |
 |
| Parameter | Plot |
|---|---|
| CZT HV Monitor | 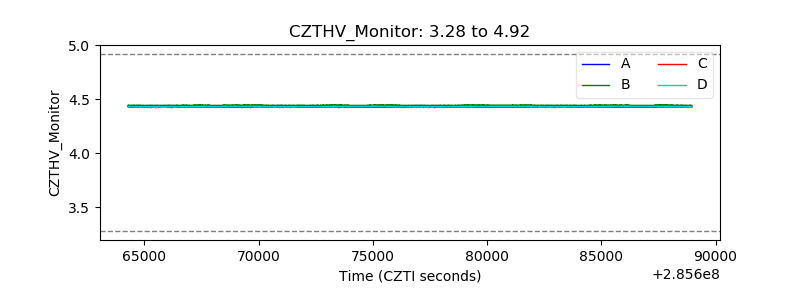 |
| D_VDD |  |
| Temperature 1 | 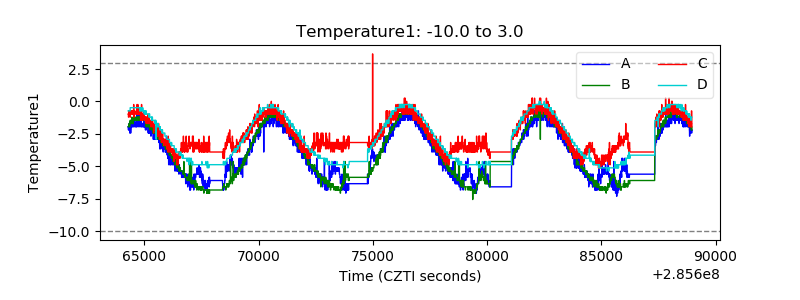 |
| Veto HV Monitor | 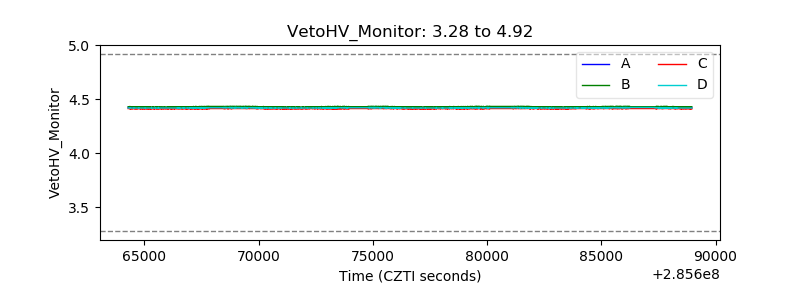 |
| Veto LLD | 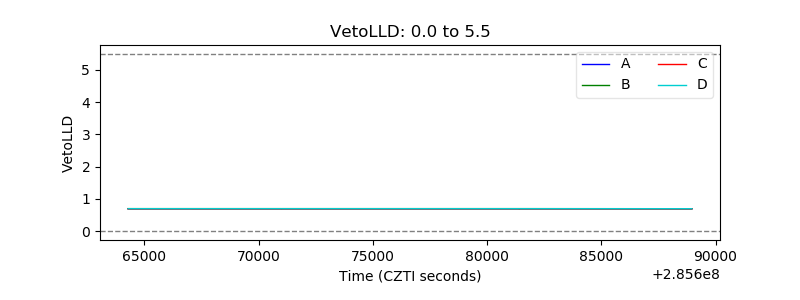 |
| Alpha Counter | 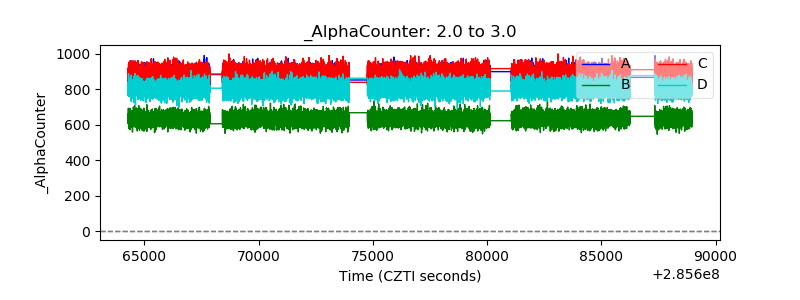 |
| _CPM_Rate | 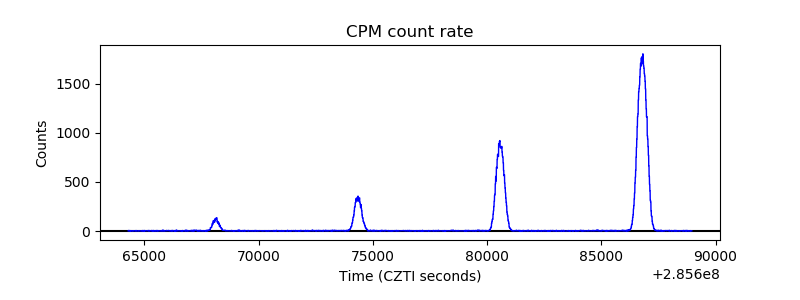 |
| CZT Counter | 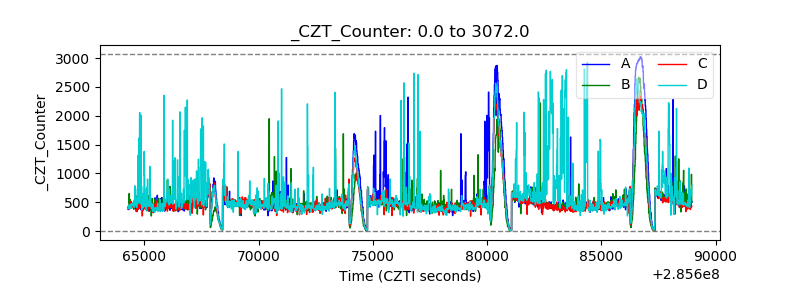 |
| +2.5 Volts monitor |  |
| +5 Volts monitor |  |
| _ROLL_ROT | 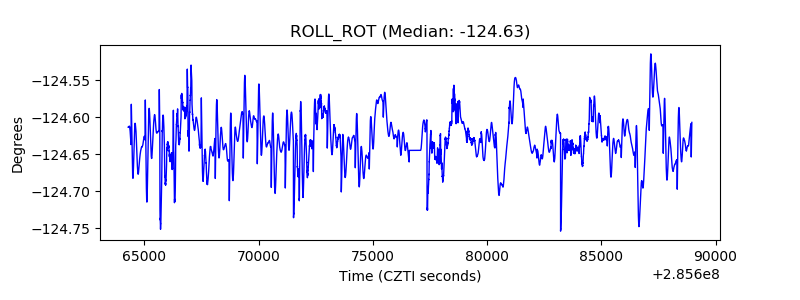 |
| _Roll_DEC |  |
| _Roll_RA | 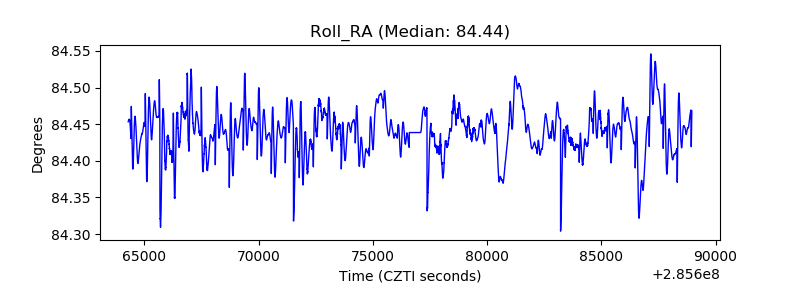 |
| Veto Counter | 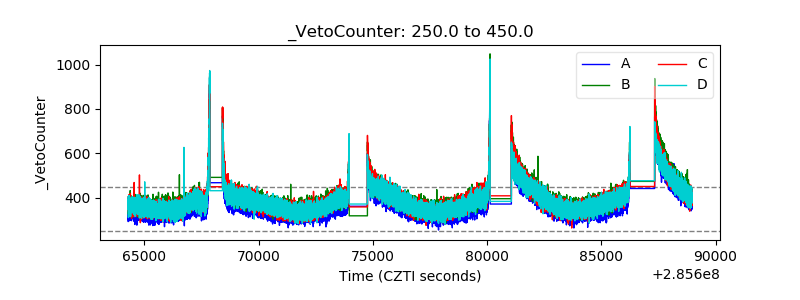 |