| Param | Original file | Final file |
|---|---|---|
| Filename | modeM0/AS1A05_096T06_9000002668_17917cztM0_level2.evt | modeM0/AS1A05_096T06_9000002668_17917cztM0_level2_quad_clean.evt |
| Size (bytes) | 462,648,960 | 128,139,840 |
| Size | 441.2 MB | 122.2 MB |
| Events in quadrant A | 3,122,442 | 885,586 |
| Events in quadrant B | 3,389,567 | 896,874 |
| Events in quadrant C | 3,067,368 | 837,520 |
| Events in quadrant D | 4,002,864 | 820,302 |
| Mode M0 | |||
|---|---|---|---|
| Quadrant | BADHDUFLAG | Total packets | Discarded packets |
| A | 0 | 13535 | 1 |
| B | 0 | 14253 | 1 |
| C | 0 | 13355 | 1 |
| D | 0 | 16363 | 1 |
| Mode M9 | |||
|---|---|---|---|
| Quadrant | BADHDUFLAG | Total packets | Discarded packets |
| A | 0 | 12 | 0 |
| B | 0 | 12 | 0 |
| C | 0 | 12 | 0 |
| D | 0 | 12 | 0 |
| Mode SS | |||
|---|---|---|---|
| Quadrant | BADHDUFLAG | Total packets | Discarded packets |
| A | 0 | 128 | 0 |
| B | 0 | 128 | 0 |
| C | 0 | 128 | 0 |
| D | 0 | 128 | 0 |
| Quadrant | Total seconds | Saturated seconds | Saturation percentage |
|---|---|---|---|
| A | 6319 | 73 | 1.155246% |
| B | 6320 | 92 | 1.455696% |
| C | 6319 | 83 | 1.313499% |
| D | 6319 | 227 | 3.592341% |
Noise dominated data is calculated using 1-second bins in cleaned event files. If a bin has >2000 counts, and if more than 50% of those come from <1% of pixels, then it is considered to be noise-dominated and hence unusable.
| Quadrant | # 1 sec bins | Bins with >0 counts | Bins with >2000 counts | High rate bins dominated by noise | Noise dominated (total time) | Noise dominated (detector-on time) | Marked lightcurve |
|---|---|---|---|---|---|---|---|
| A | 7494 | 6319 | 1 | 1 | 0.01% | 0.02% | 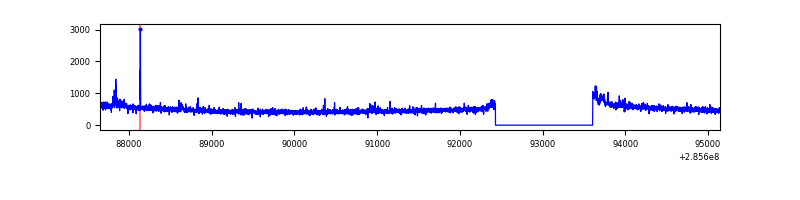 |
| B | 7495 | 6320 | 18 | 18 | 0.24% | 0.28% | 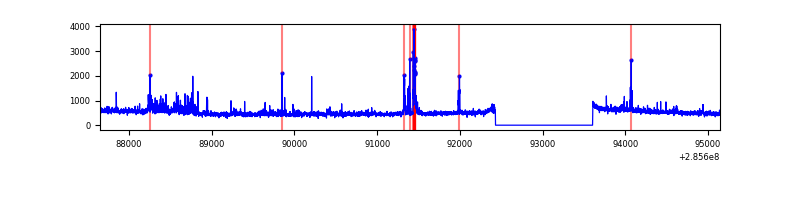 |
| C | 7494 | 6320 | 1 | 1 | 0.01% | 0.02% | 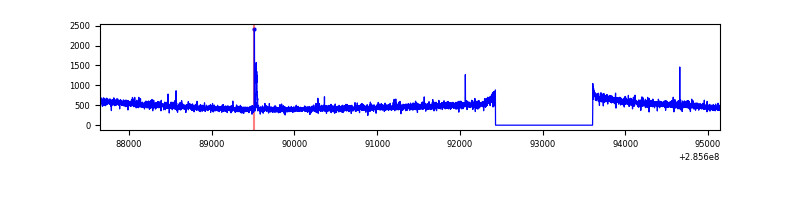 |
| D | 7494 | 6320 | 146 | 146 | 1.95% | 2.31% | 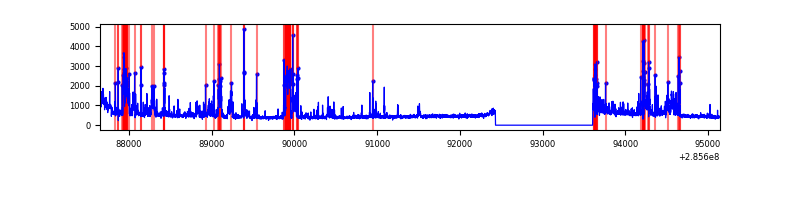 |
Top three noisy pixels from each quadrant. If the there are fewer than three noisy pixels in the level2.evt file, extra rows are filled as -1
| Pixel properties | Quadrant properties | ||||||
|---|---|---|---|---|---|---|---|
| Quadrant | DetID | PixID | Counts | Sigma | Mean | Median | Sigma |
| A | 15 | 174 | 58472 | 361.25 | 791 | 775 | 159.7 |
| A | 15 | 192 | 12258 | 71.9 | 791 | 775 | 159.7 |
| A | 13 | 210 | 8016 | 45.34 | 791 | 775 | 159.7 |
| B | 15 | 222 | 106719 | 718.56 | 787 | 770 | 147.4 |
| B | 7 | 220 | 82886 | 556.92 | 787 | 770 | 147.4 |
| B | 0 | 190 | 22430 | 146.9 | 787 | 770 | 147.4 |
| C | 14 | 238 | 117902 | 682.44 | 738 | 741 | 171.7 |
| C | 3 | 233 | 31217 | 177.51 | 738 | 741 | 171.7 |
| C | 9 | 160 | 25073 | 141.73 | 738 | 741 | 171.7 |
| D | 7 | 238 | 732542 | 3681.32 | 738 | 720 | 198.8 |
| D | 5 | 222 | 262859 | 1318.65 | 738 | 720 | 198.8 |
| D | 9 | 64 | 49041 | 243.07 | 738 | 720 | 198.8 |
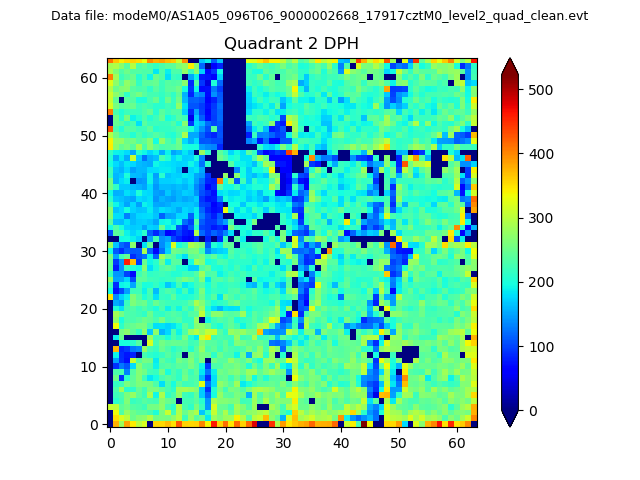
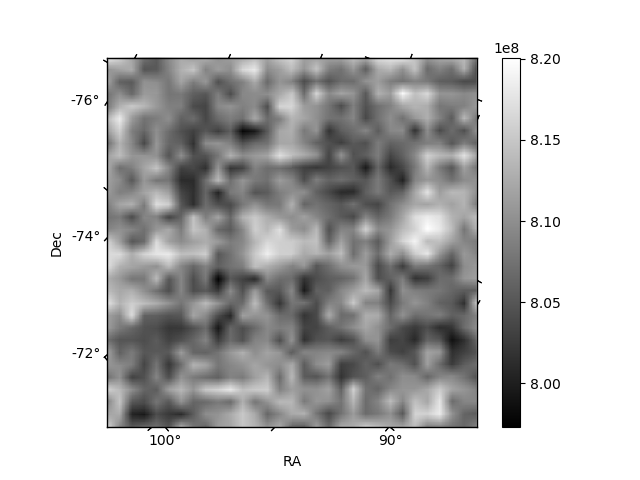
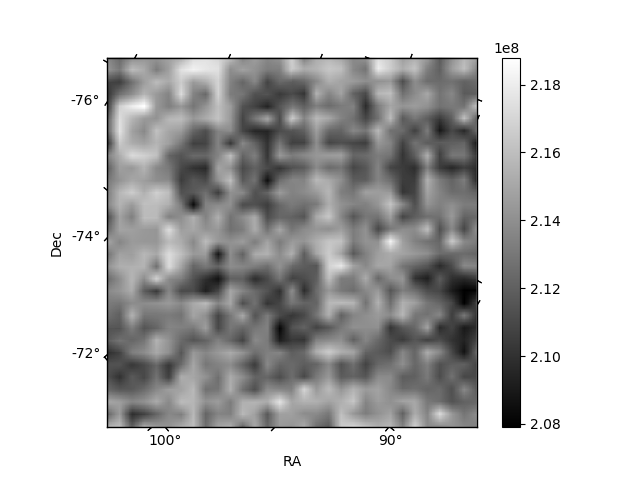
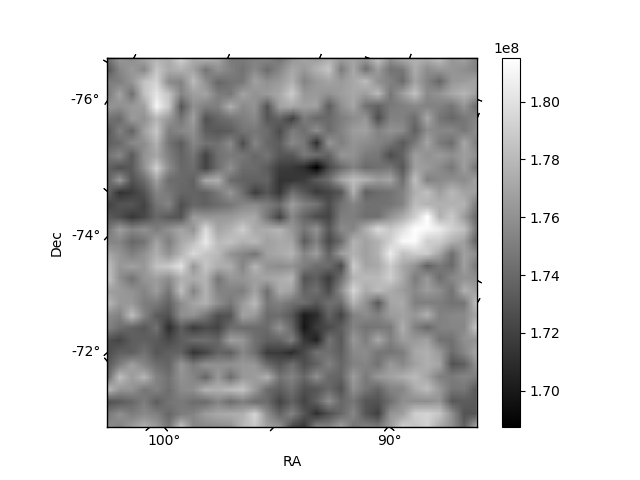
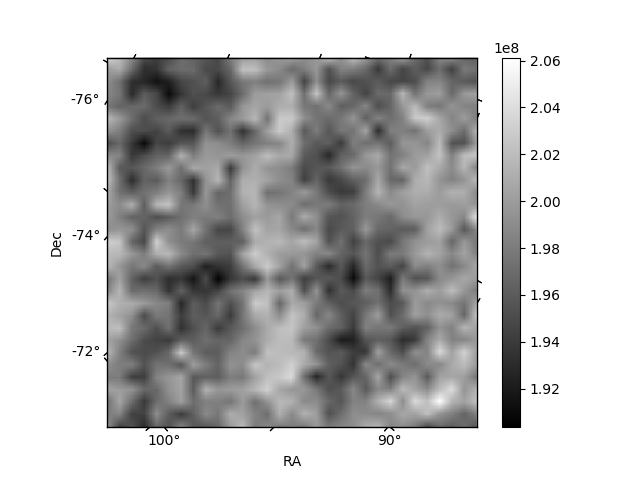
Histogram calculated using DETX and DETY for each event in the final _common_clean file
| Quadrant A | 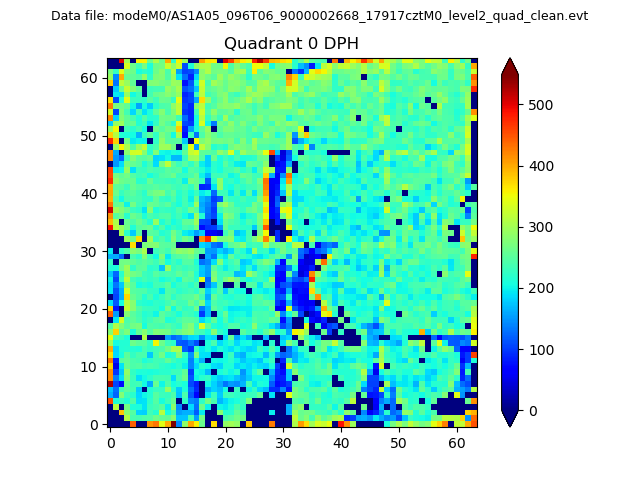 |
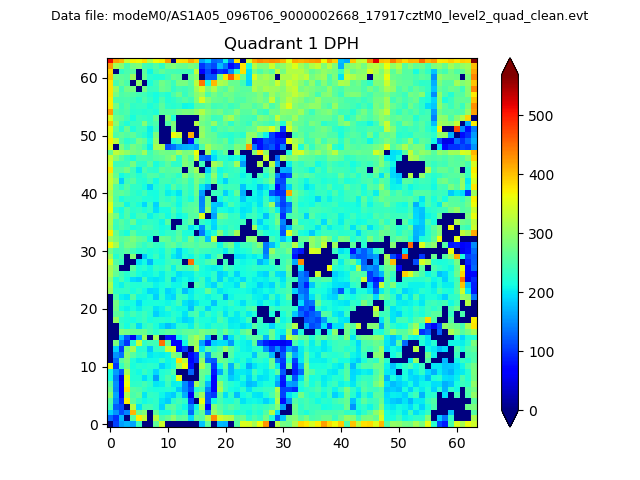 |
Quadrant B |
|---|---|---|---|
| Quadrant D | 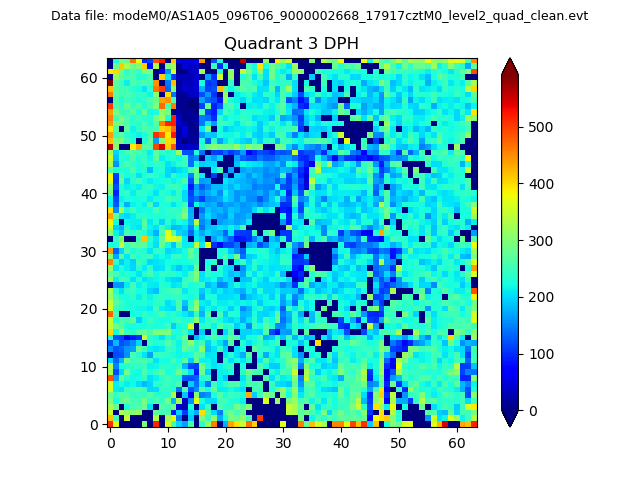 |
 |
Quadrant C |
| Plot type | Count rate plots | Images |
|---|---|---|
| Comparison with Poisson distribution Blue bars denote a histogram of data divided into 1 sec bins. Red curve is a Poisson curve with rate = median count rate of data. |
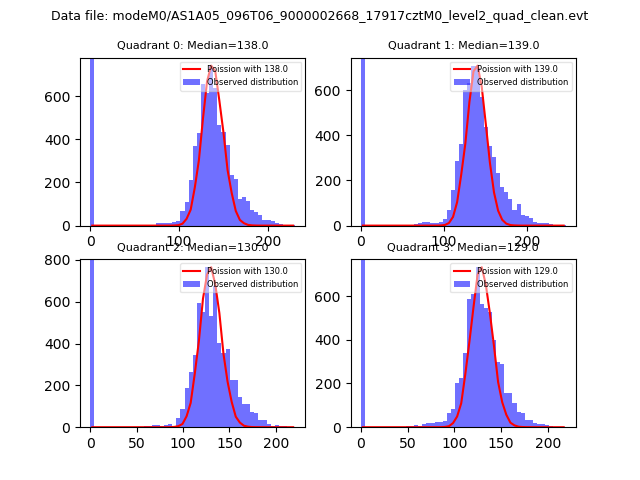 |
 |
| Quadrant-wise count rates Data is divided into 100 sec bins |
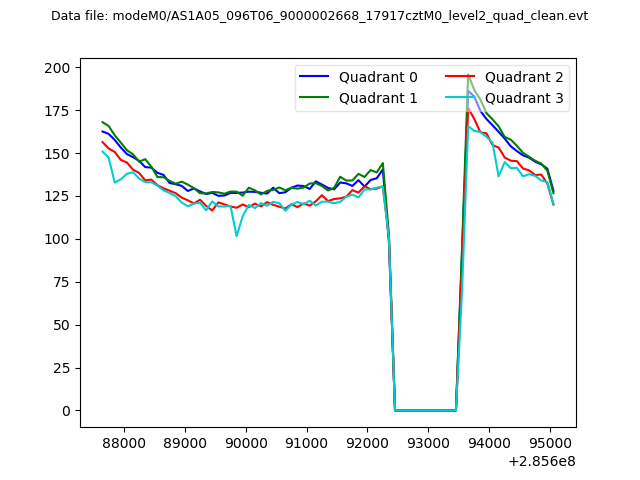 |
|
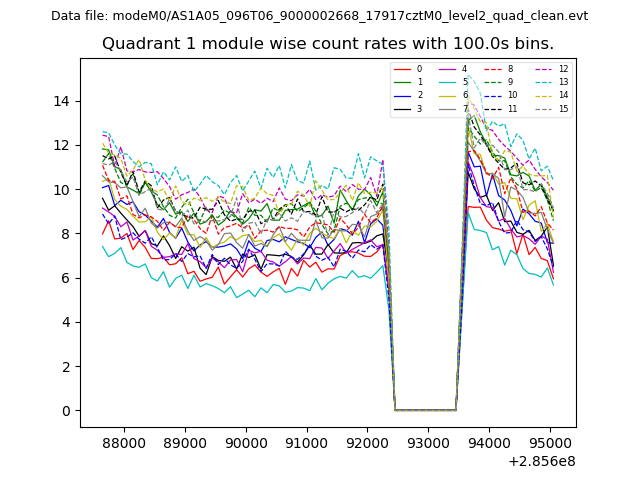
| Module-wise count rates for Quadrant A Data is divided into 100 sec bins |
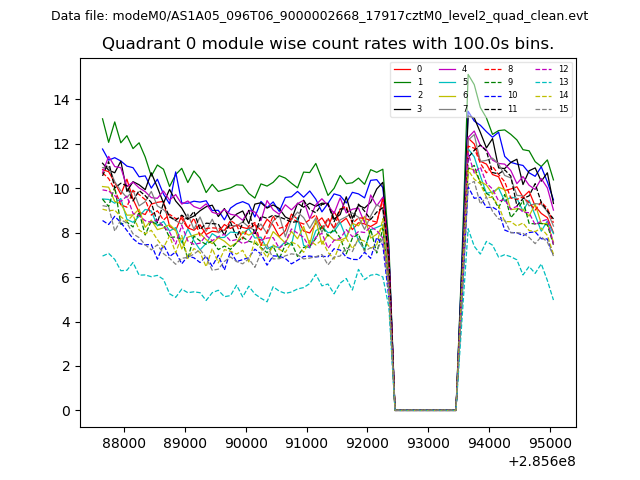 |
 |
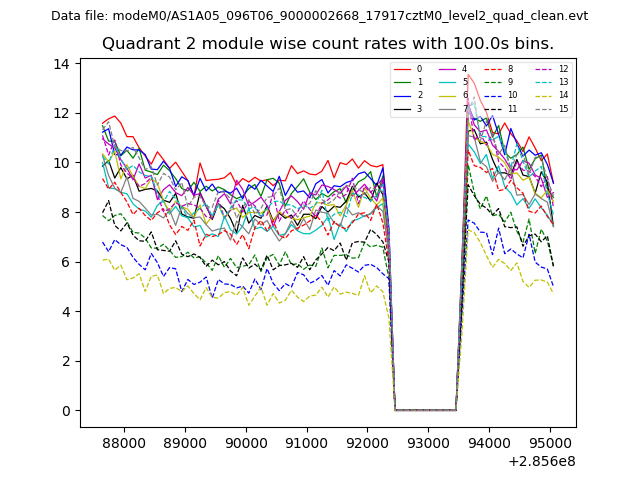
| Module-wise count rates for Quadrant B Data is divided into 100 sec bins |
 |
 |
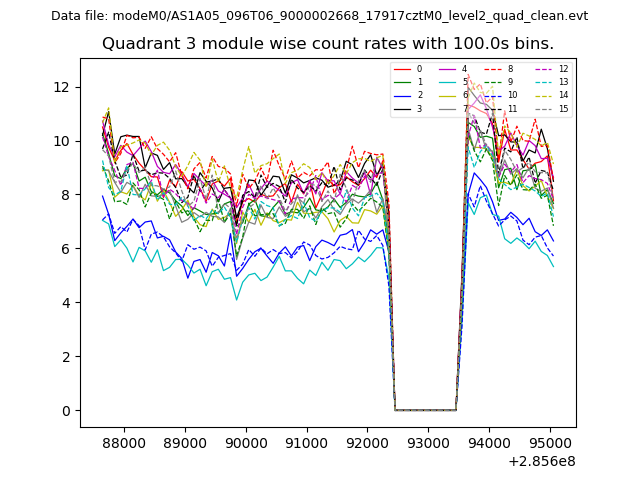
| Module-wise count rates for Quadrant C Data is divided into 100 sec bins |
 |
 |
| Module-wise count rates for Quadrant D Data is divided into 100 sec bins |
 |
 |
| Parameter | Plot |
|---|---|
| CZT HV Monitor | 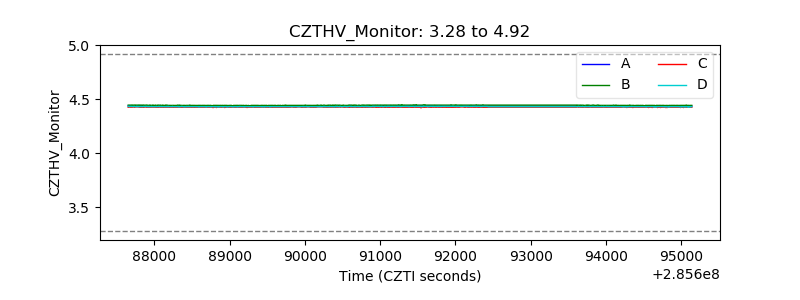 |
| D_VDD | 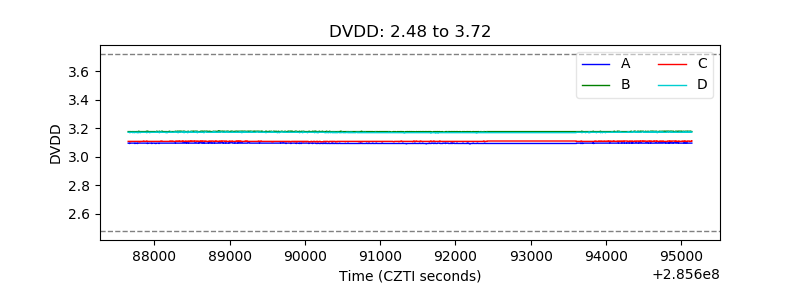 |
| Temperature 1 |  |
| Veto HV Monitor | 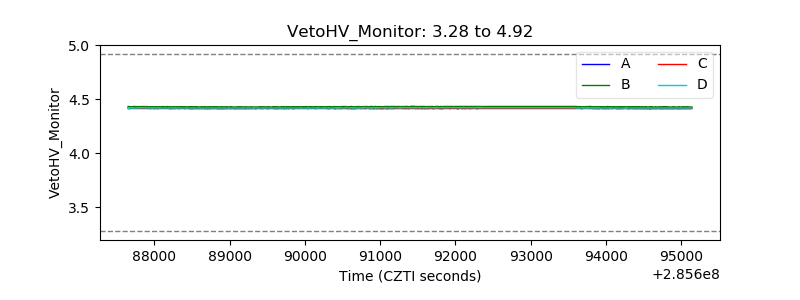 |
| Veto LLD | 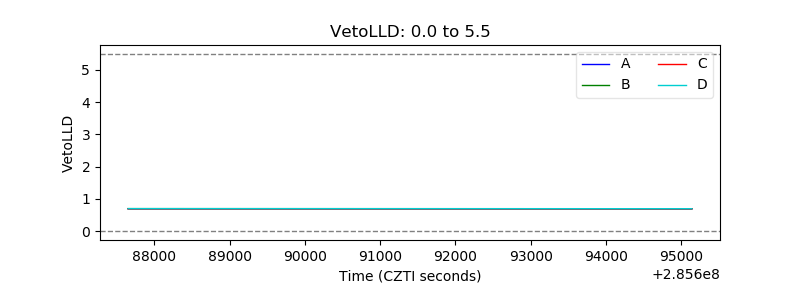 |
| Alpha Counter | 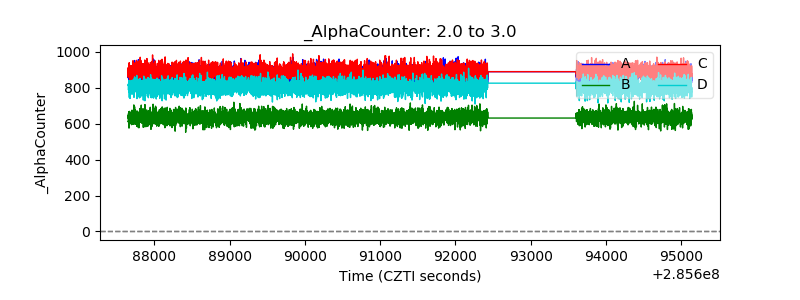 |
| _CPM_Rate | 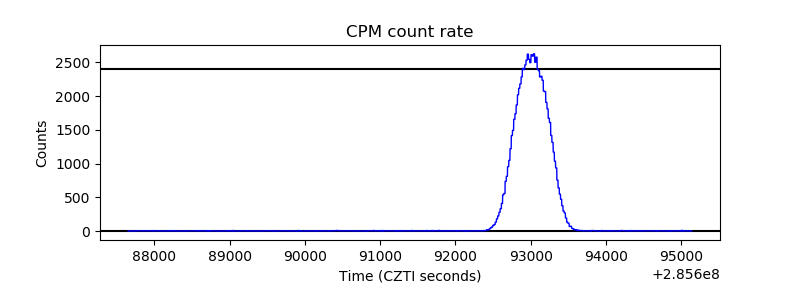 |
| CZT Counter | 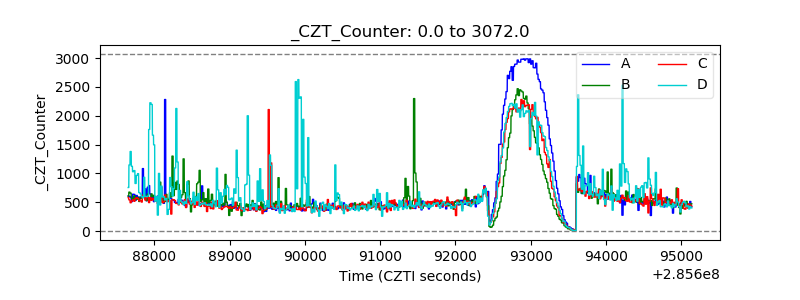 |
| +2.5 Volts monitor |  |
| +5 Volts monitor |  |
| _ROLL_ROT | 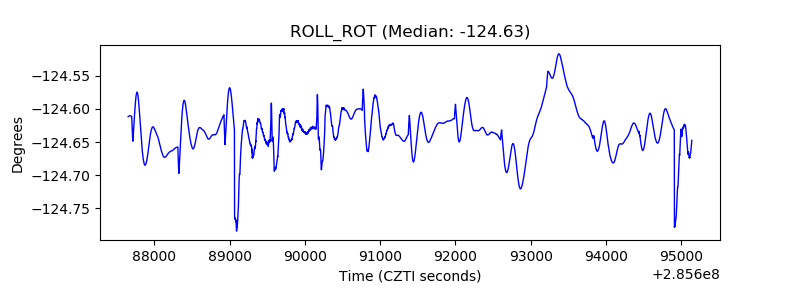 |
| _Roll_DEC |  |
| _Roll_RA | 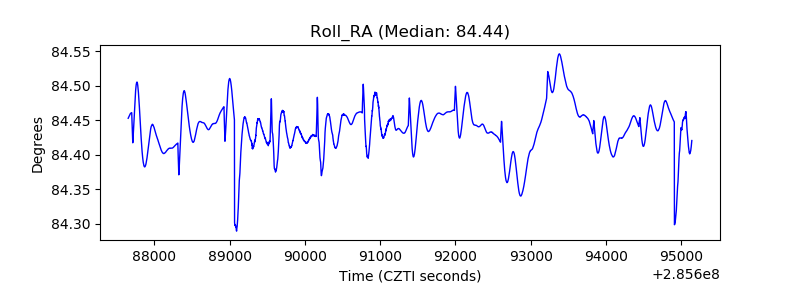 |
| Veto Counter | 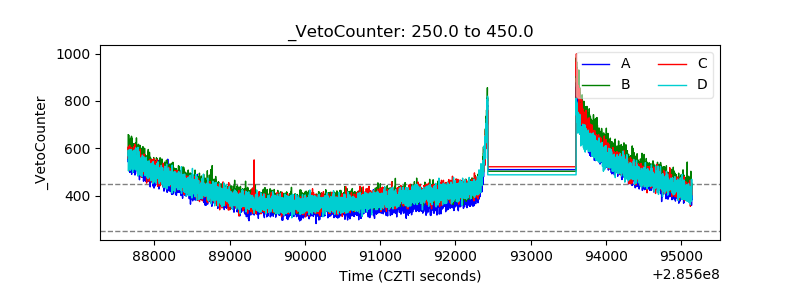 |