| Param | Original file | Final file |
|---|---|---|
| Filename | modeM0/AS1A05_096T06_9000002668_17918cztM0_level2.evt | modeM0/AS1A05_096T06_9000002668_17918cztM0_level2_quad_clean.evt |
| Size (bytes) | 459,564,480 | 126,933,120 |
| Size | 438.3 MB | 121.1 MB |
| Events in quadrant A | 3,308,584 | 879,042 |
| Events in quadrant B | 3,504,856 | 899,129 |
| Events in quadrant C | 3,027,900 | 836,493 |
| Events in quadrant D | 3,660,788 | 802,391 |
| Mode M0 | |||
|---|---|---|---|
| Quadrant | BADHDUFLAG | Total packets | Discarded packets |
| A | 0 | 13897 | 1 |
| B | 0 | 14444 | 1 |
| C | 0 | 13023 | 1 |
| D | 0 | 15216 | 1 |
| Mode M9 | |||
|---|---|---|---|
| Quadrant | BADHDUFLAG | Total packets | Discarded packets |
| A | 0 | 13 | 0 |
| B | 0 | 13 | 0 |
| C | 0 | 13 | 0 |
| D | 0 | 13 | 0 |
| Mode SS | |||
|---|---|---|---|
| Quadrant | BADHDUFLAG | Total packets | Discarded packets |
| A | 0 | 124 | 0 |
| B | 0 | 124 | 0 |
| C | 0 | 124 | 0 |
| D | 0 | 124 | 0 |
| Quadrant | Total seconds | Saturated seconds | Saturation percentage |
|---|---|---|---|
| A | 6126 | 111 | 1.811949% |
| B | 6126 | 114 | 1.860921% |
| C | 6126 | 56 | 0.914136% |
| D | 6126 | 284 | 4.635978% |
Noise dominated data is calculated using 1-second bins in cleaned event files. If a bin has >2000 counts, and if more than 50% of those come from <1% of pixels, then it is considered to be noise-dominated and hence unusable.
| Quadrant | # 1 sec bins | Bins with >0 counts | Bins with >2000 counts | High rate bins dominated by noise | Noise dominated (total time) | Noise dominated (detector-on time) | Marked lightcurve |
|---|---|---|---|---|---|---|---|
| A | 7416 | 6127 | 38 | 38 | 0.51% | 0.62% | 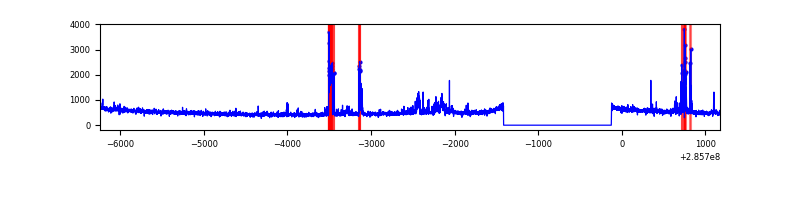 |
| B | 7416 | 6127 | 33 | 33 | 0.44% | 0.54% | 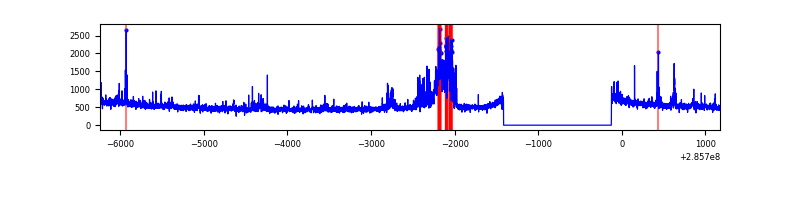 |
| C | 7416 | 6127 | 0 | 0 | 0.00% | 0.00% |  |
| D | 7416 | 6127 | 219 | 219 | 2.95% | 3.57% | 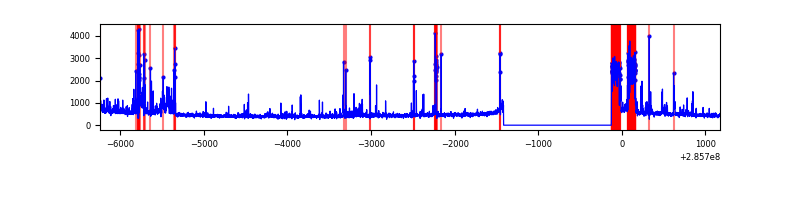 |
Top three noisy pixels from each quadrant. If the there are fewer than three noisy pixels in the level2.evt file, extra rows are filled as -1
| Pixel properties | Quadrant properties | ||||||
|---|---|---|---|---|---|---|---|
| Quadrant | DetID | PixID | Counts | Sigma | Mean | Median | Sigma |
| A | 15 | 174 | 317690 | 2054.16 | 770 | 755 | 154.3 |
| A | 4 | 2 | 19388 | 120.77 | 770 | 755 | 154.3 |
| A | 13 | 210 | 11563 | 70.05 | 770 | 755 | 154.3 |
| B | 15 | 222 | 354282 | 2438.15 | 775 | 758 | 145.0 |
| B | 0 | 244 | 30480 | 204.98 | 775 | 758 | 145.0 |
| B | 7 | 220 | 20170 | 133.88 | 775 | 758 | 145.0 |
| C | 14 | 238 | 115348 | 683.8 | 726 | 730 | 167.6 |
| C | 3 | 233 | 65004 | 383.45 | 726 | 730 | 167.6 |
| C | 9 | 160 | 9191 | 50.48 | 726 | 730 | 167.6 |
| D | 7 | 238 | 630666 | 3663.87 | 716 | 696 | 171.9 |
| D | 5 | 222 | 141781 | 820.54 | 716 | 696 | 171.9 |
| D | 7 | 223 | 52408 | 300.75 | 716 | 696 | 171.9 |
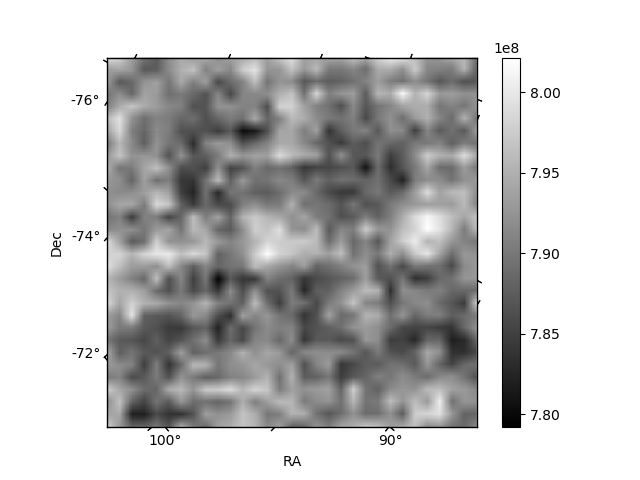
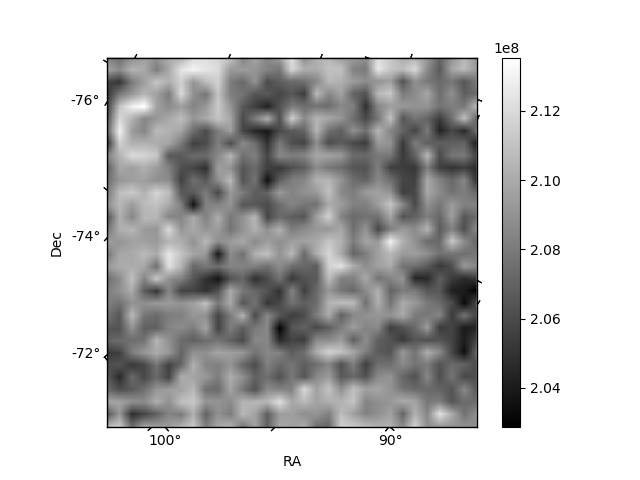
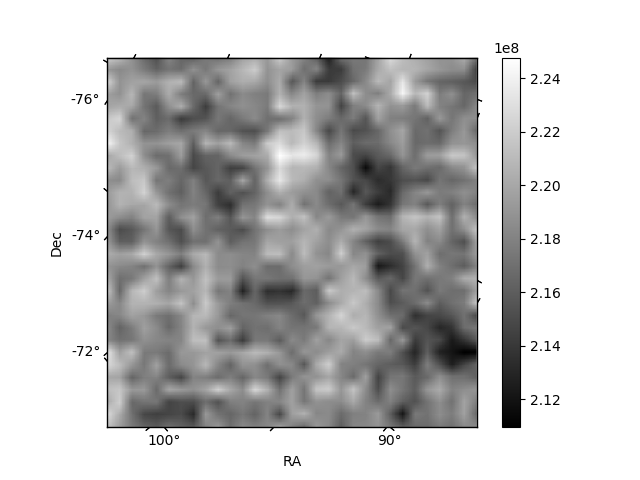
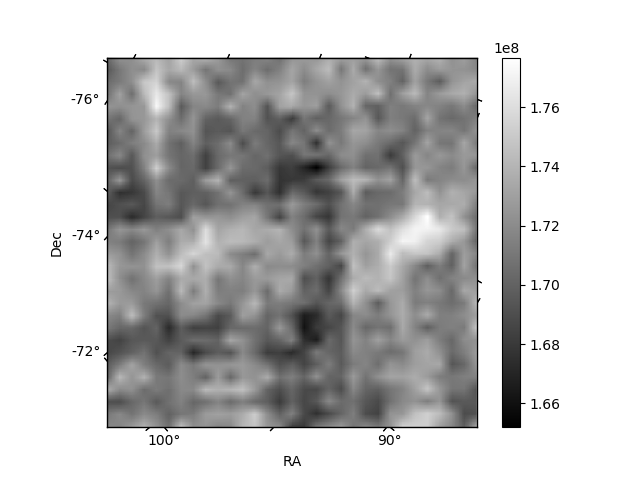
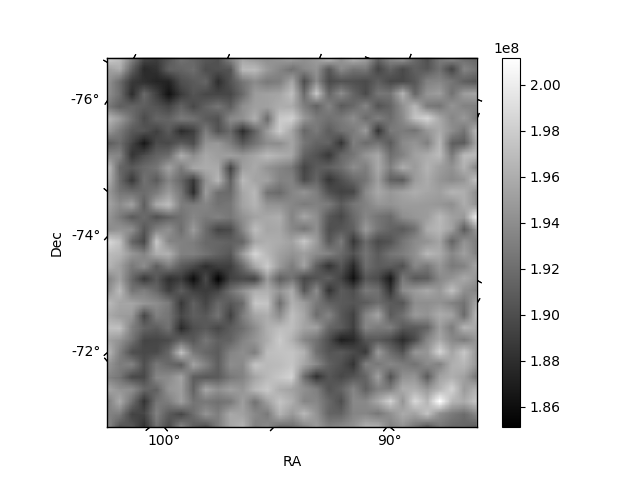
Histogram calculated using DETX and DETY for each event in the final _common_clean file
| Quadrant A | 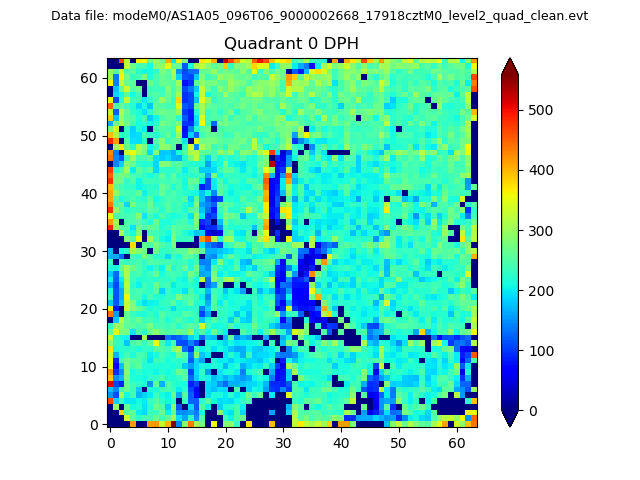 |
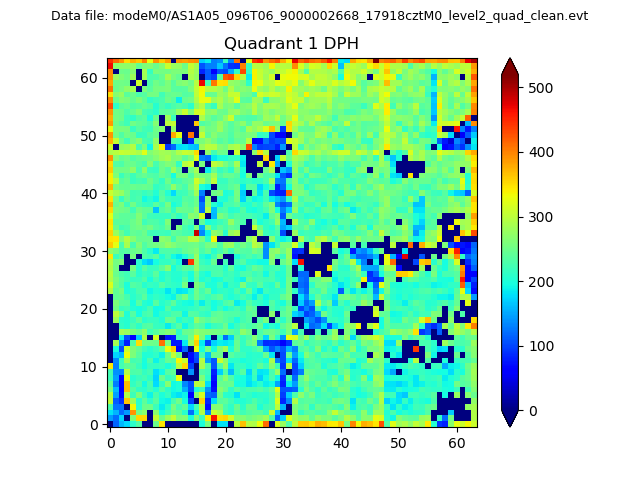 |
Quadrant B |
|---|---|---|---|
| Quadrant D | 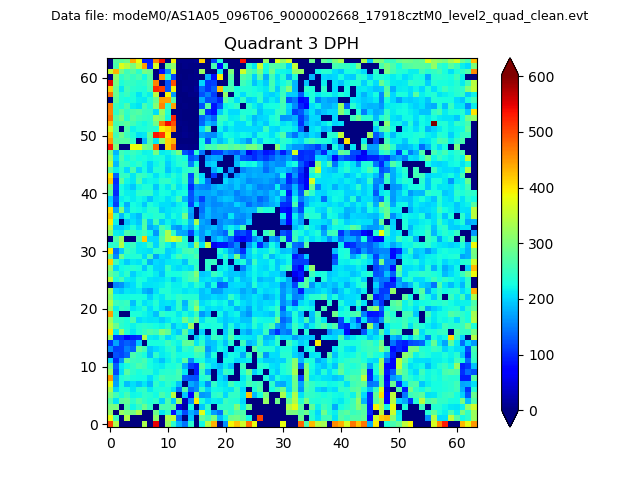 |
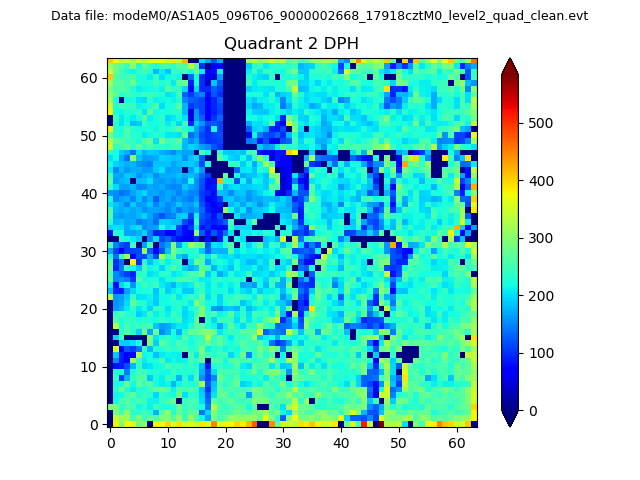 |
Quadrant C |
| Plot type | Count rate plots | Images |
|---|---|---|
| Comparison with Poisson distribution Blue bars denote a histogram of data divided into 1 sec bins. Red curve is a Poisson curve with rate = median count rate of data. |
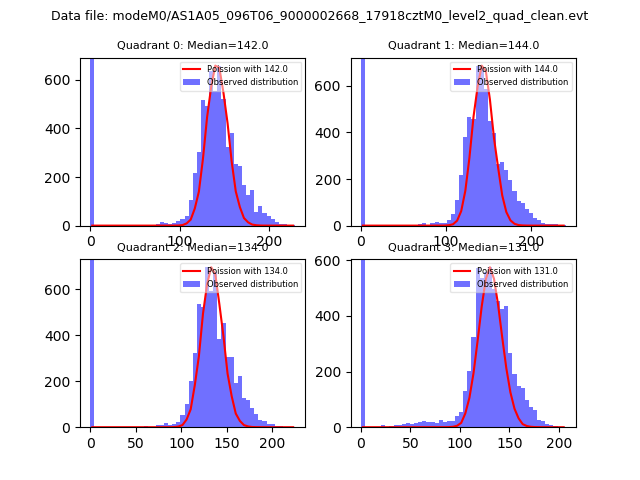 |
 |
| Quadrant-wise count rates Data is divided into 100 sec bins |
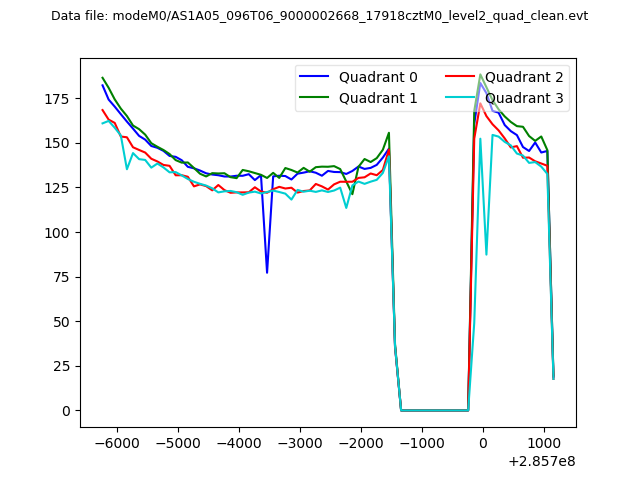 |
|
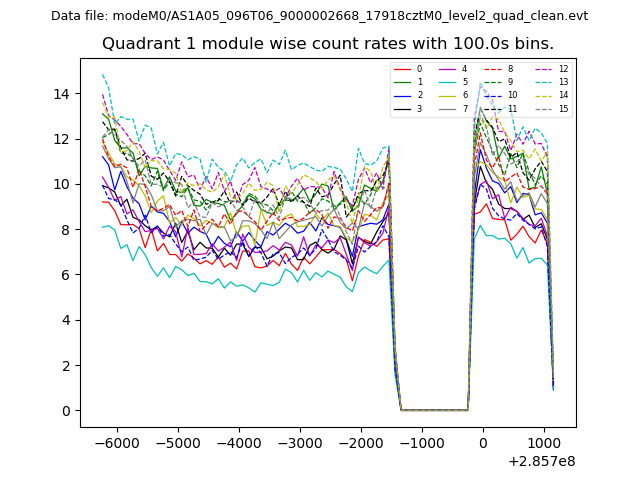
| Module-wise count rates for Quadrant A Data is divided into 100 sec bins |
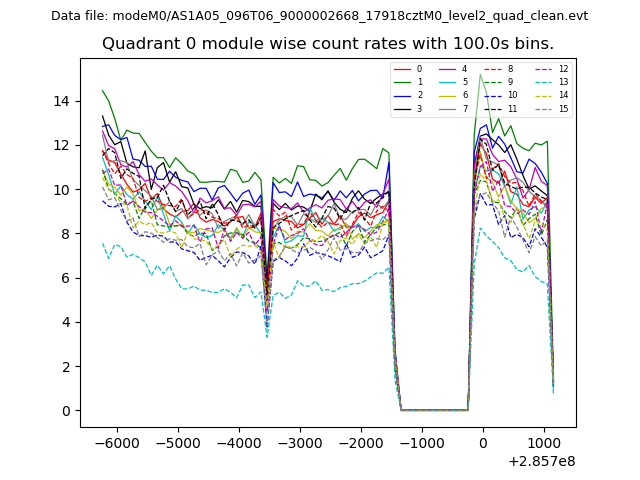 |
 |
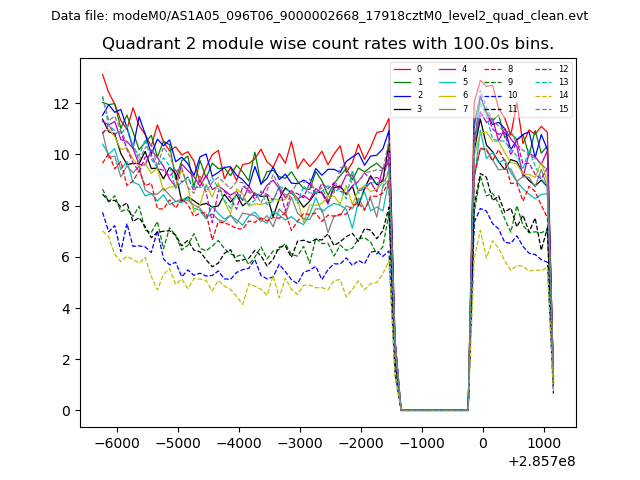
| Module-wise count rates for Quadrant B Data is divided into 100 sec bins |
 |
 |
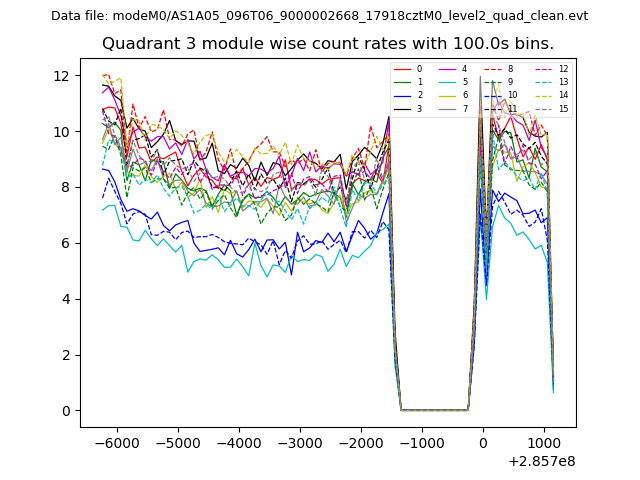
| Module-wise count rates for Quadrant C Data is divided into 100 sec bins |
 |
 |
| Module-wise count rates for Quadrant D Data is divided into 100 sec bins |
 |
 |
| Parameter | Plot |
|---|---|
| CZT HV Monitor | 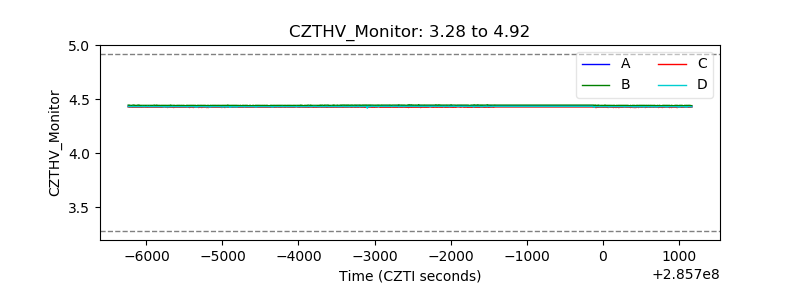 |
| D_VDD | 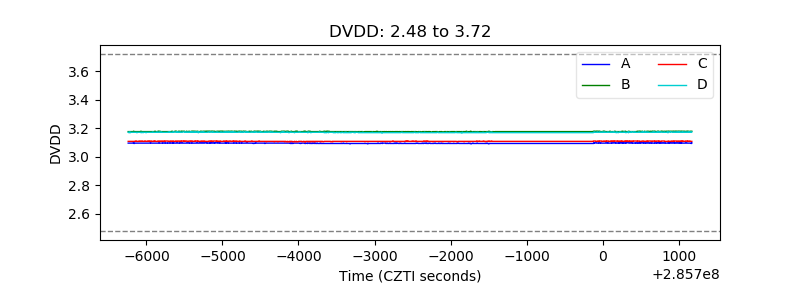 |
| Temperature 1 | 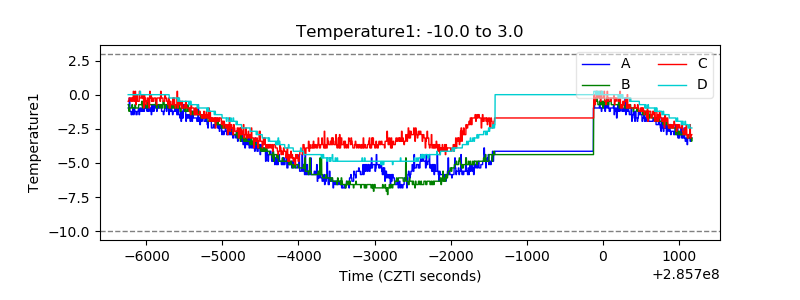 |
| Veto HV Monitor | 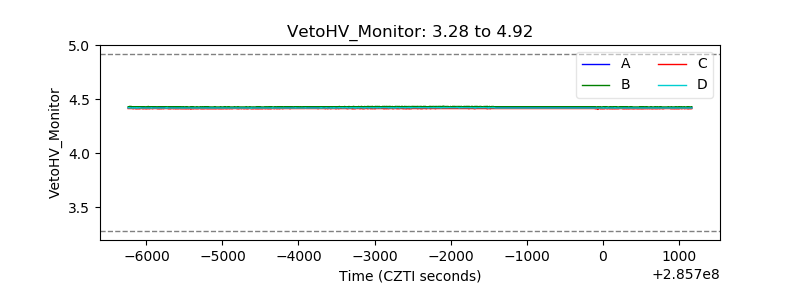 |
| Veto LLD | 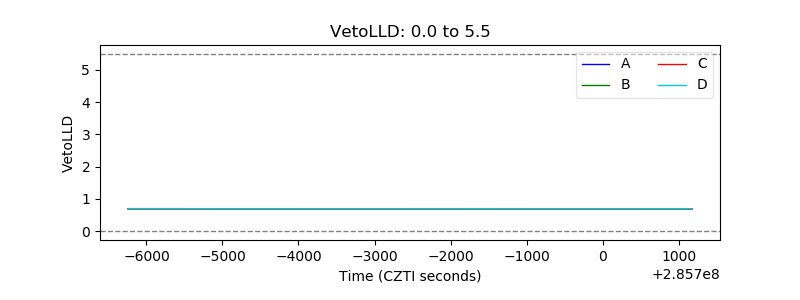 |
| Alpha Counter | 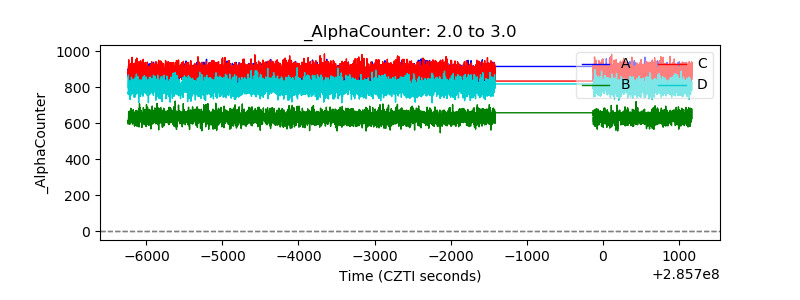 |
| _CPM_Rate | 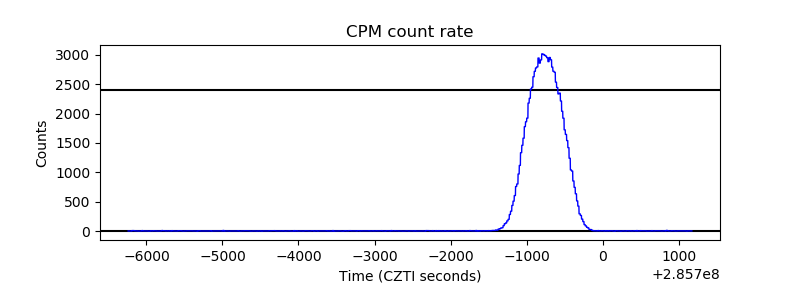 |
| CZT Counter | 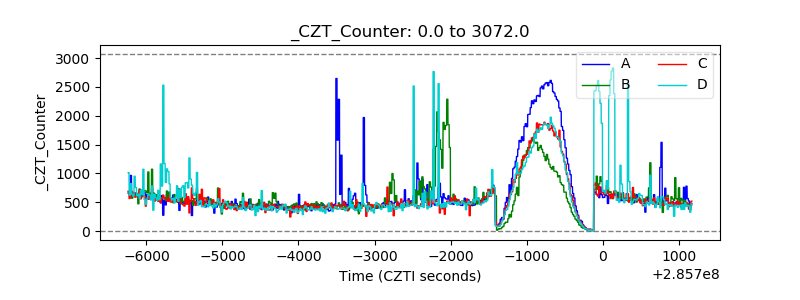 |
| +2.5 Volts monitor |  |
| +5 Volts monitor |  |
| _ROLL_ROT | 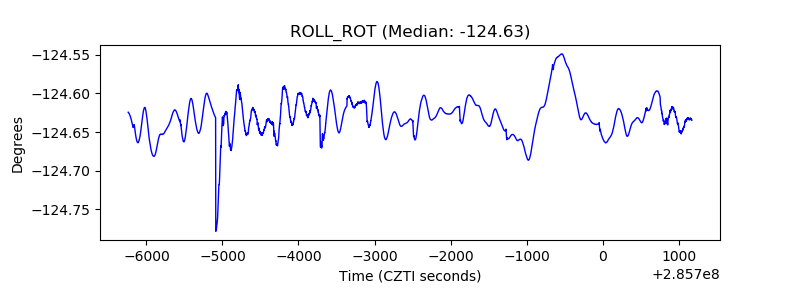 |
| _Roll_DEC | 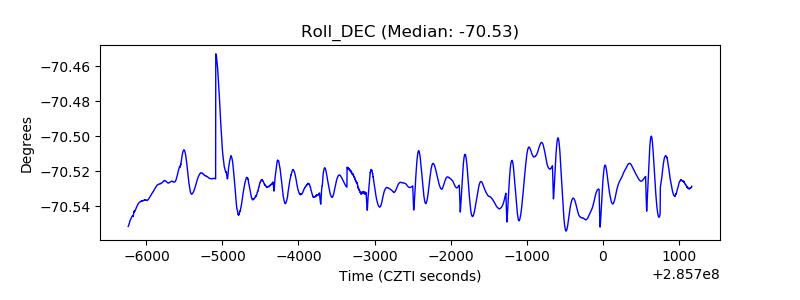 |
| _Roll_RA | 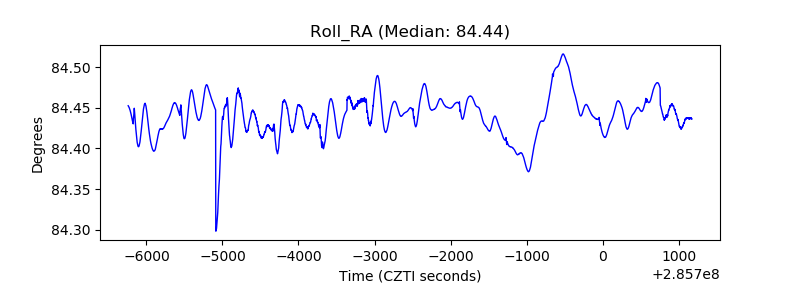 |
| Veto Counter | 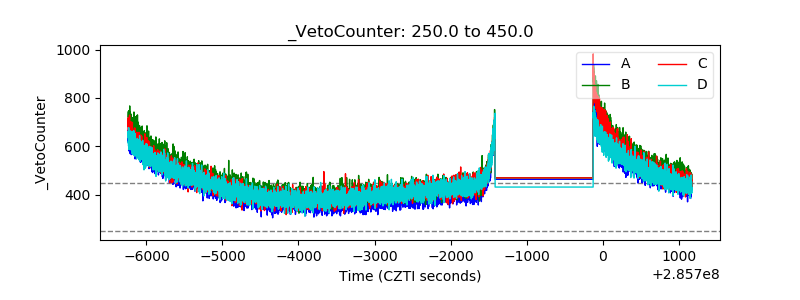 |