| Param | Original file | Final file |
|---|---|---|
| Filename | modeM0/AS1A05_096T06_9000002668_17919cztM0_level2.evt | modeM0/AS1A05_096T06_9000002668_17919cztM0_level2_quad_clean.evt |
| Size (bytes) | 447,808,320 | 125,832,960 |
| Size | 427.1 MB | 120.0 MB |
| Events in quadrant A | 3,057,742 | 876,192 |
| Events in quadrant B | 3,472,064 | 891,023 |
| Events in quadrant C | 3,209,162 | 827,174 |
| Events in quadrant D | 3,411,470 | 794,020 |
| Mode M0 | |||
|---|---|---|---|
| Quadrant | BADHDUFLAG | Total packets | Discarded packets |
| A | 0 | 13022 | 1 |
| B | 0 | 14174 | 1 |
| C | 0 | 13503 | 2 |
| D | 0 | 14409 | 1 |
| Mode M9 | |||
|---|---|---|---|
| Quadrant | BADHDUFLAG | Total packets | Discarded packets |
| A | 0 | 14 | 0 |
| B | 0 | 14 | 0 |
| C | 0 | 14 | 0 |
| D | 0 | 14 | 0 |
| Mode SS | |||
|---|---|---|---|
| Quadrant | BADHDUFLAG | Total packets | Discarded packets |
| A | 0 | 122 | 0 |
| B | 0 | 122 | 0 |
| C | 0 | 122 | 0 |
| D | 0 | 122 | 0 |
| Quadrant | Total seconds | Saturated seconds | Saturation percentage |
|---|---|---|---|
| A | 6057 | 36 | 0.594354% |
| B | 6058 | 159 | 2.624629% |
| C | 6057 | 58 | 0.957570% |
| D | 6057 | 264 | 4.358593% |
Noise dominated data is calculated using 1-second bins in cleaned event files. If a bin has >2000 counts, and if more than 50% of those come from <1% of pixels, then it is considered to be noise-dominated and hence unusable.
| Quadrant | # 1 sec bins | Bins with >0 counts | Bins with >2000 counts | High rate bins dominated by noise | Noise dominated (total time) | Noise dominated (detector-on time) | Marked lightcurve |
|---|---|---|---|---|---|---|---|
| A | 7432 | 6059 | 11 | 11 | 0.15% | 0.18% | 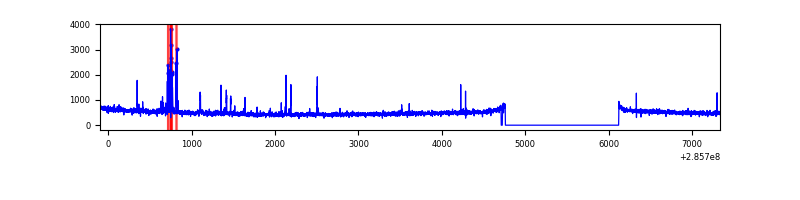 |
| B | 7433 | 6060 | 69 | 69 | 0.93% | 1.14% | 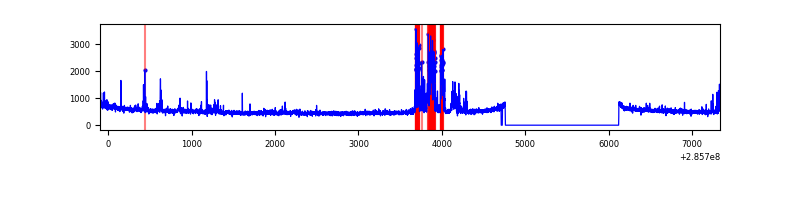 |
| C | 7432 | 6059 | 0 | 0 | 0.00% | 0.00% | 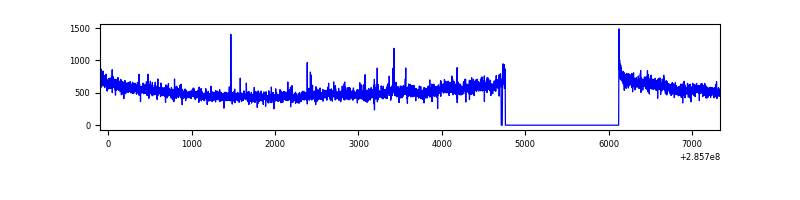 |
| D | 7432 | 6059 | 232 | 232 | 3.12% | 3.83% | 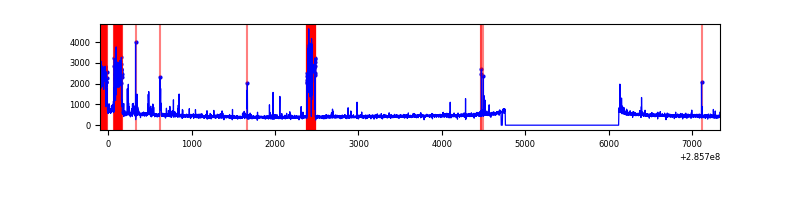 |
Top three noisy pixels from each quadrant. If the there are fewer than three noisy pixels in the level2.evt file, extra rows are filled as -1
| Pixel properties | Quadrant properties | ||||||
|---|---|---|---|---|---|---|---|
| Quadrant | DetID | PixID | Counts | Sigma | Mean | Median | Sigma |
| A | 15 | 174 | 107401 | 706.43 | 761 | 748 | 151.0 |
| A | 4 | 2 | 13273 | 82.96 | 761 | 748 | 151.0 |
| A | 0 | 226 | 6797 | 40.07 | 761 | 748 | 151.0 |
| B | 15 | 222 | 359486 | 2520.33 | 763 | 746 | 142.3 |
| B | 0 | 244 | 44745 | 309.12 | 763 | 746 | 142.3 |
| B | 0 | 219 | 20735 | 140.43 | 763 | 746 | 142.3 |
| C | 3 | 233 | 278119 | 1675.72 | 715 | 720 | 165.5 |
| C | 14 | 238 | 114118 | 685.02 | 715 | 720 | 165.5 |
| C | 9 | 54 | 13654 | 78.13 | 715 | 720 | 165.5 |
| D | 7 | 238 | 637881 | 3440.26 | 698 | 683 | 185.2 |
| D | 5 | 222 | 30449 | 160.71 | 698 | 683 | 185.2 |
| D | 10 | 70 | 26451 | 139.12 | 698 | 683 | 185.2 |
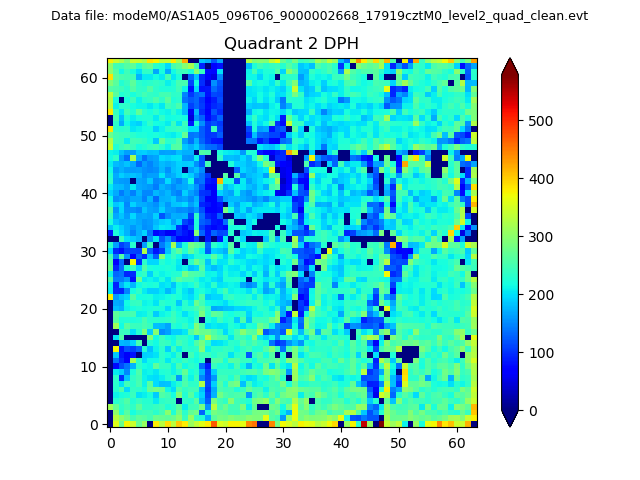
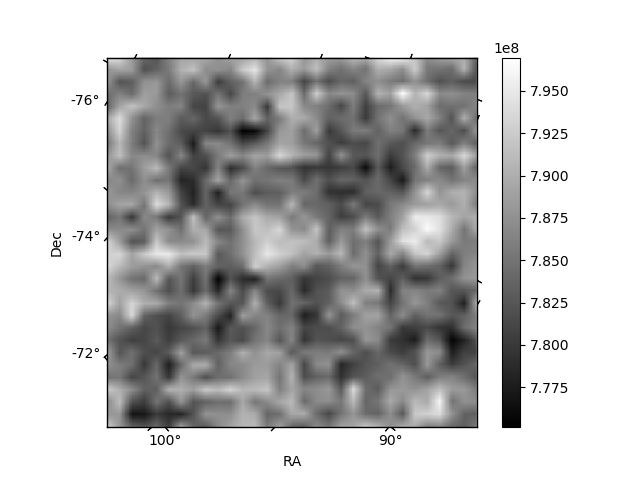
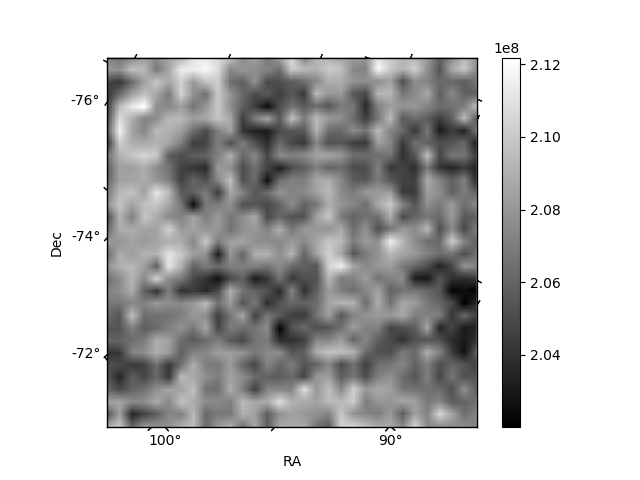
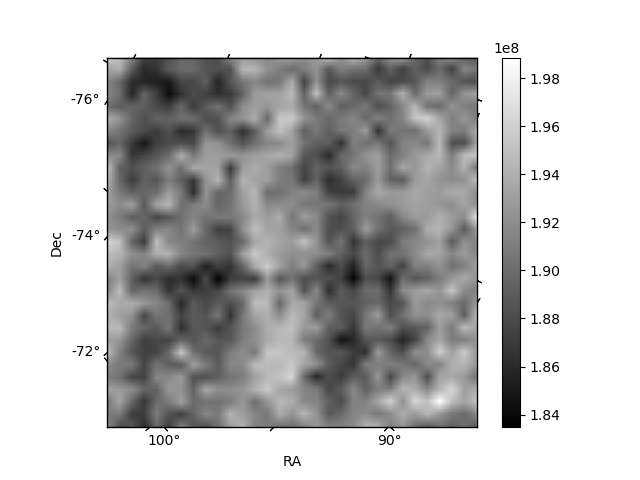
Histogram calculated using DETX and DETY for each event in the final _common_clean file
| Quadrant A | 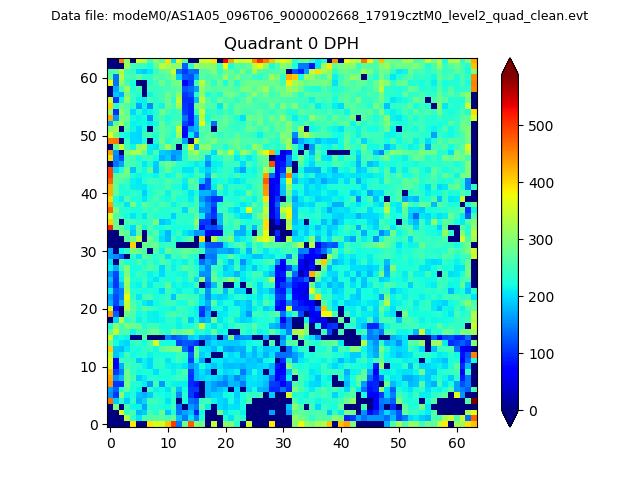 |
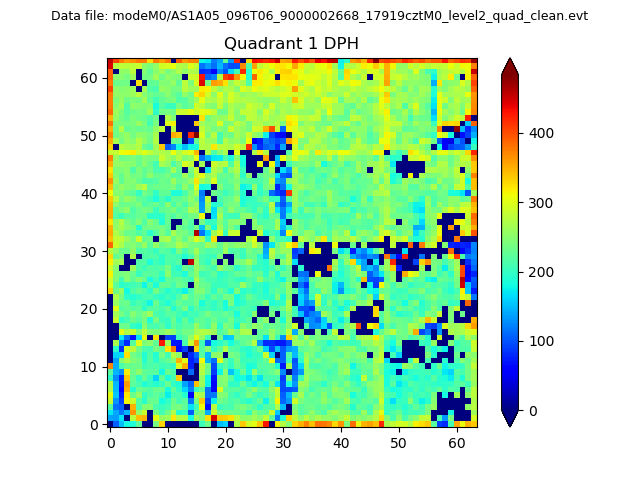 |
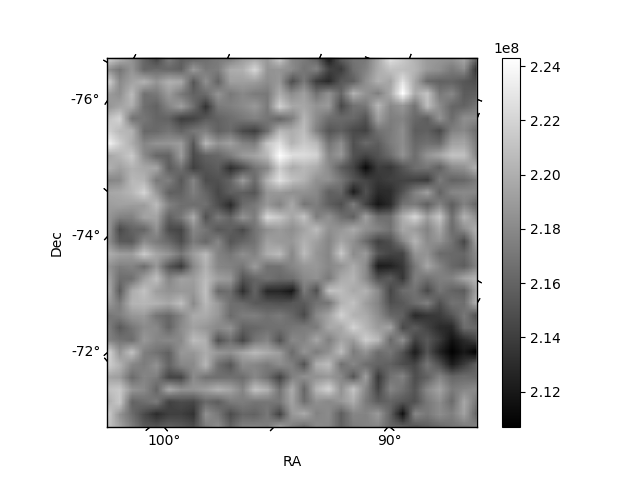
Quadrant B |
|---|---|---|---|
| Quadrant D | 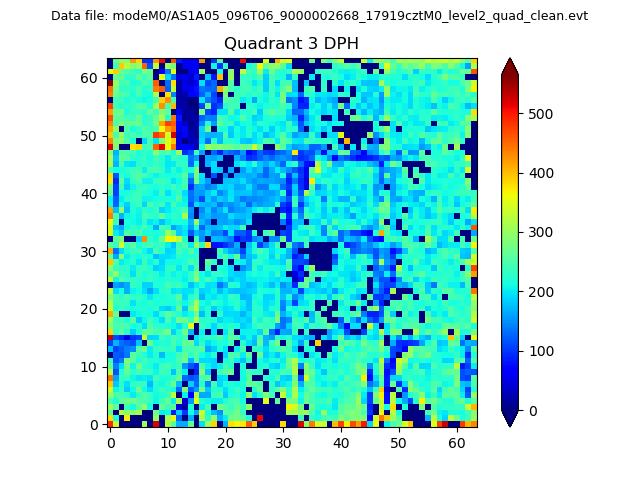 |
 |
Quadrant C |
| Plot type | Count rate plots | Images |
|---|---|---|
| Comparison with Poisson distribution Blue bars denote a histogram of data divided into 1 sec bins. Red curve is a Poisson curve with rate = median count rate of data. |
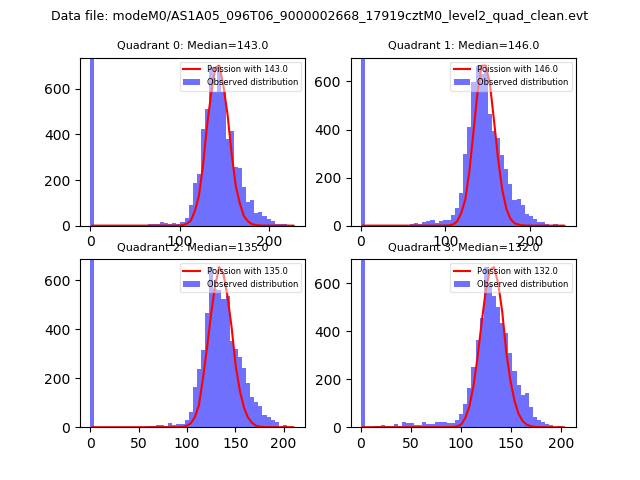 |
 |
| Quadrant-wise count rates Data is divided into 100 sec bins |
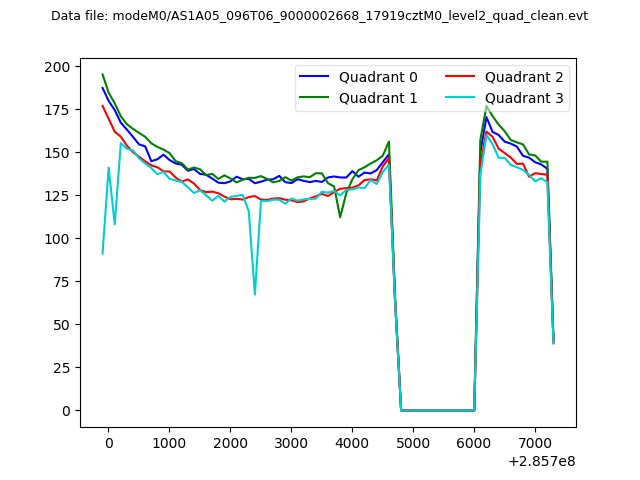 |
|
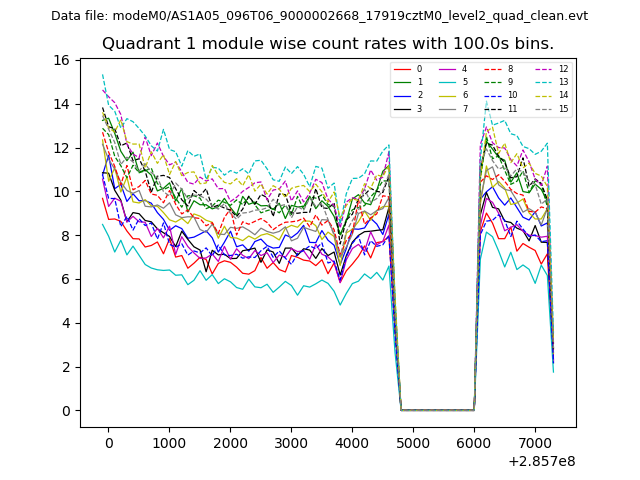
| Module-wise count rates for Quadrant A Data is divided into 100 sec bins |
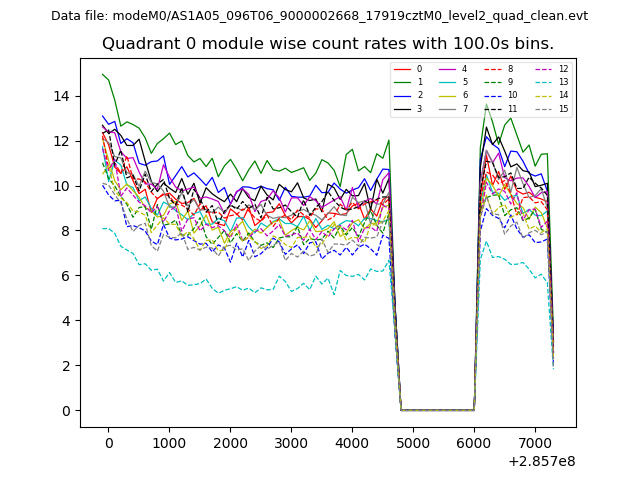 |
 |
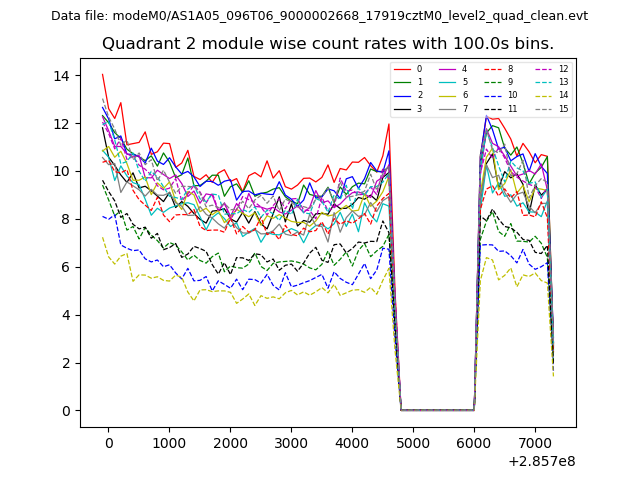
| Module-wise count rates for Quadrant B Data is divided into 100 sec bins |
 |
 |
| Module-wise count rates for Quadrant C Data is divided into 100 sec bins |
 |
 |
| Module-wise count rates for Quadrant D Data is divided into 100 sec bins |
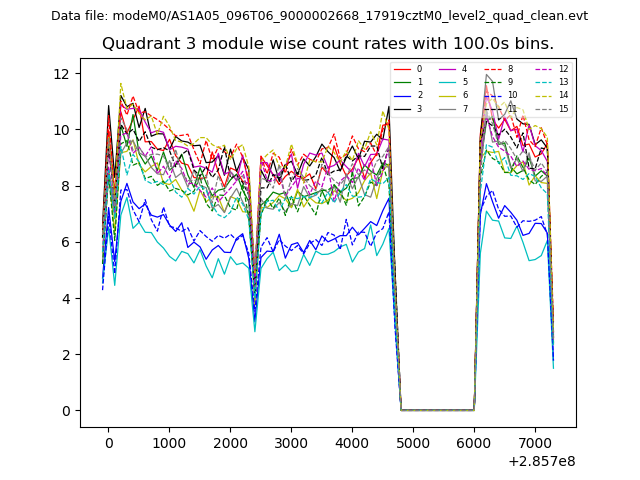 |
 |
| Parameter | Plot |
|---|---|
| CZT HV Monitor | 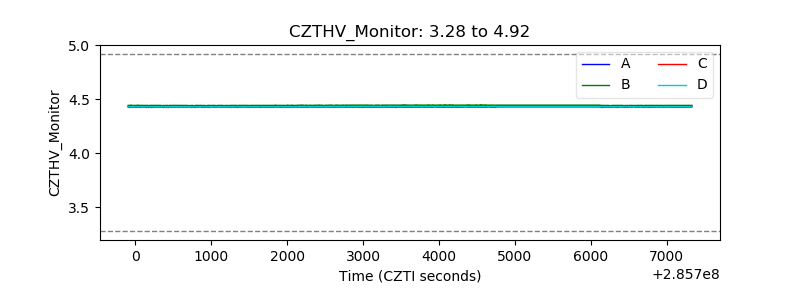 |
| D_VDD | 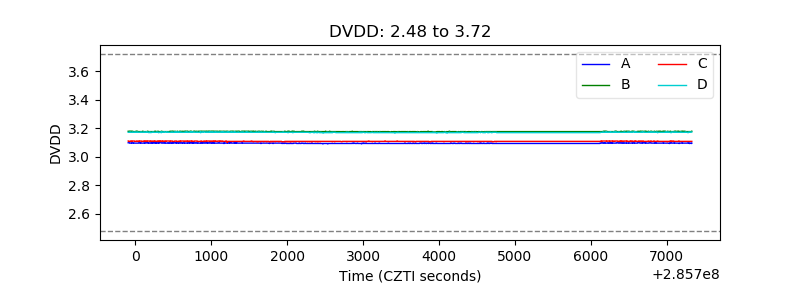 |
| Temperature 1 |  |
| Veto HV Monitor | 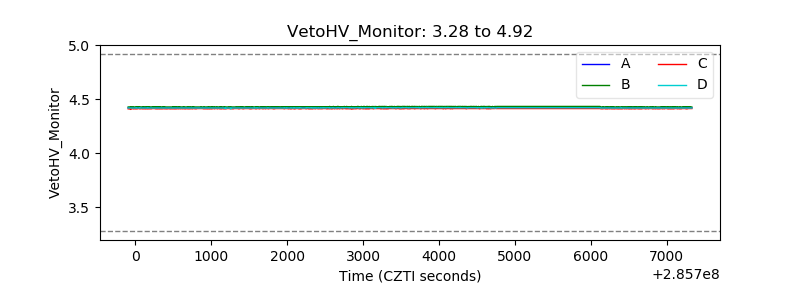 |
| Veto LLD | 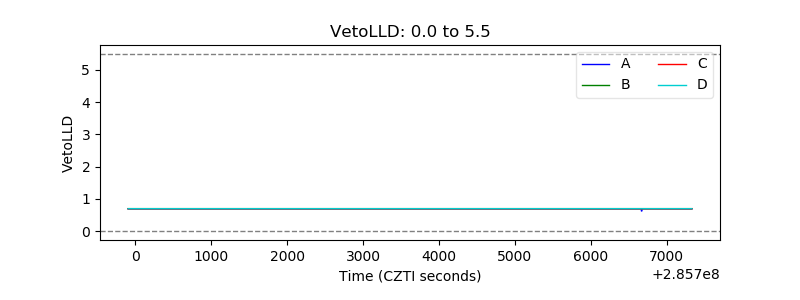 |
| Alpha Counter | 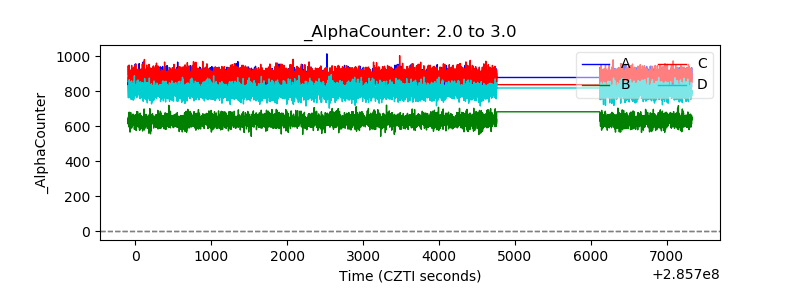 |
| _CPM_Rate | 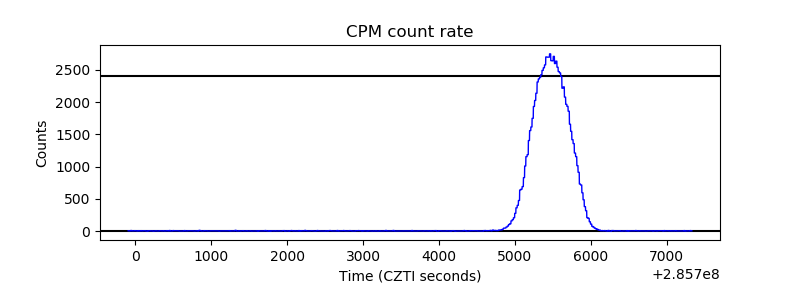 |
| CZT Counter | 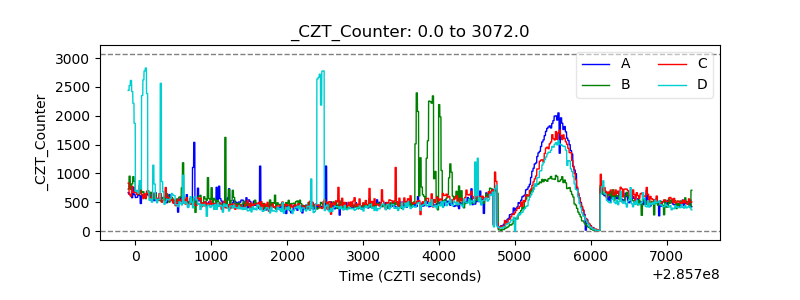 |
| +2.5 Volts monitor | 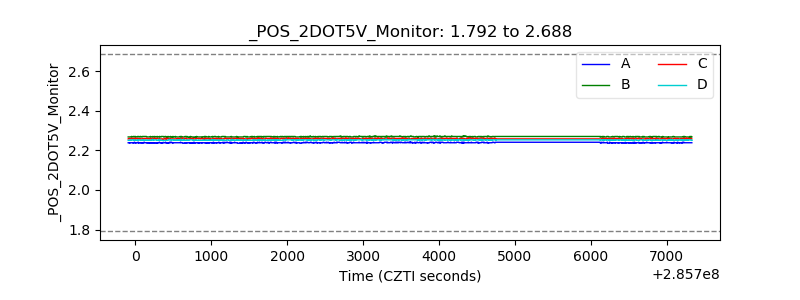 |
| +5 Volts monitor |  |
| _ROLL_ROT |  |
| _Roll_DEC |  |
| _Roll_RA | 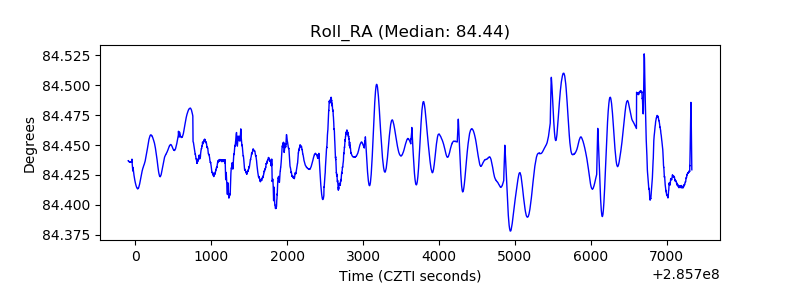 |
| Veto Counter |  |