| Param | Original file | Final file |
|---|---|---|
| Filename | modeM0/AS1A05_096T06_9000002668_17921cztM0_level2.evt | modeM0/AS1A05_096T06_9000002668_17921cztM0_level2_quad_clean.evt |
| Size (bytes) | 386,216,640 | 114,229,440 |
| Size | 368.3 MB | 108.9 MB |
| Events in quadrant A | 2,735,860 | 782,829 |
| Events in quadrant B | 2,944,086 | 805,299 |
| Events in quadrant C | 2,981,553 | 746,450 |
| Events in quadrant D | 2,654,756 | 734,363 |
| Mode M0 | |||
|---|---|---|---|
| Quadrant | BADHDUFLAG | Total packets | Discarded packets |
| A | 0 | 11804 | 2 |
| B | 0 | 12274 | 2 |
| C | 0 | 12201 | 2 |
| D | 0 | 11859 | 2 |
| Mode M9 | |||
|---|---|---|---|
| Quadrant | BADHDUFLAG | Total packets | Discarded packets |
| A | 0 | 13 | 0 |
| B | 0 | 14 | 0 |
| C | 0 | 14 | 0 |
| D | 0 | 14 | 0 |
| Mode SS | |||
|---|---|---|---|
| Quadrant | BADHDUFLAG | Total packets | Discarded packets |
| A | 0 | 114 | 0 |
| B | 0 | 114 | 0 |
| C | 0 | 114 | 0 |
| D | 0 | 114 | 0 |
| Quadrant | Total seconds | Saturated seconds | Saturation percentage |
|---|---|---|---|
| A | 5586 | 44 | 0.787683% |
| B | 5586 | 73 | 1.306839% |
| C | 5586 | 57 | 1.020408% |
| D | 5586 | 18 | 0.322234% |
Noise dominated data is calculated using 1-second bins in cleaned event files. If a bin has >2000 counts, and if more than 50% of those come from <1% of pixels, then it is considered to be noise-dominated and hence unusable.
| Quadrant | # 1 sec bins | Bins with >0 counts | Bins with >2000 counts | High rate bins dominated by noise | Noise dominated (total time) | Noise dominated (detector-on time) | Marked lightcurve |
|---|---|---|---|---|---|---|---|
| A | 6951 | 5587 | 10 | 10 | 0.14% | 0.18% | 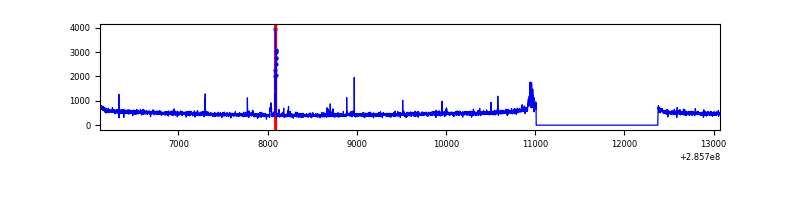 |
| B | 6951 | 5587 | 22 | 22 | 0.32% | 0.39% | 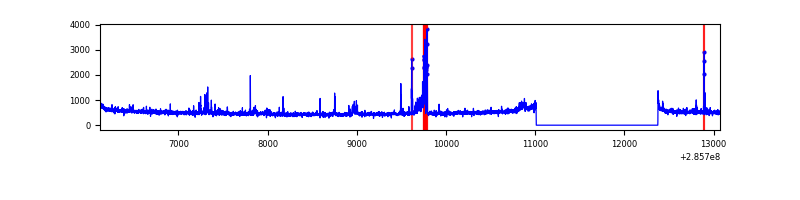 |
| C | 6951 | 5587 | 0 | 0 | 0.00% | 0.00% | 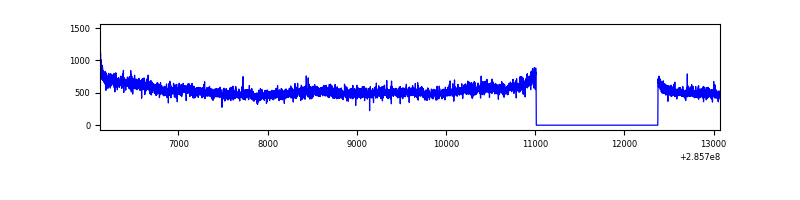 |
| D | 6951 | 5587 | 6 | 6 | 0.09% | 0.11% | 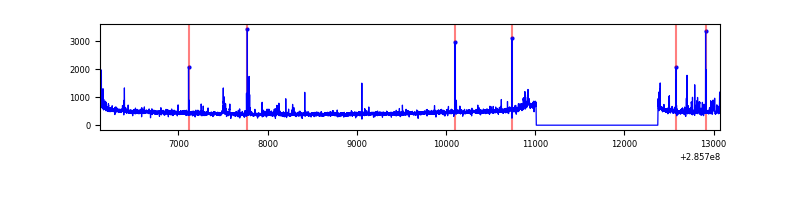 |
Top three noisy pixels from each quadrant. If the there are fewer than three noisy pixels in the level2.evt file, extra rows are filled as -1
| Pixel properties | Quadrant properties | ||||||
|---|---|---|---|---|---|---|---|
| Quadrant | DetID | PixID | Counts | Sigma | Mean | Median | Sigma |
| A | 15 | 174 | 71281 | 507.93 | 687 | 675 | 139.0 |
| A | 4 | 2 | 10746 | 72.45 | 687 | 675 | 139.0 |
| A | 0 | 226 | 6192 | 39.69 | 687 | 675 | 139.0 |
| B | 15 | 222 | 133526 | 1024.53 | 695 | 678 | 129.7 |
| B | 0 | 189 | 19362 | 144.09 | 695 | 678 | 129.7 |
| B | 0 | 244 | 17550 | 130.12 | 695 | 678 | 129.7 |
| C | 3 | 233 | 333006 | 2204.67 | 652 | 656 | 150.7 |
| C | 14 | 238 | 103245 | 680.53 | 652 | 656 | 150.7 |
| C | 13 | 61 | 4672 | 26.64 | 652 | 656 | 150.7 |
| D | 5 | 222 | 51767 | 297.36 | 652 | 635 | 172.0 |
| D | 12 | 110 | 48943 | 280.93 | 652 | 635 | 172.0 |
| D | 2 | 234 | 23029 | 130.23 | 652 | 635 | 172.0 |
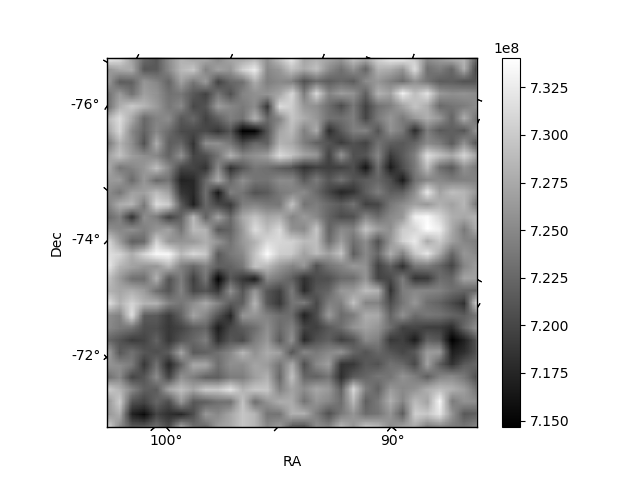
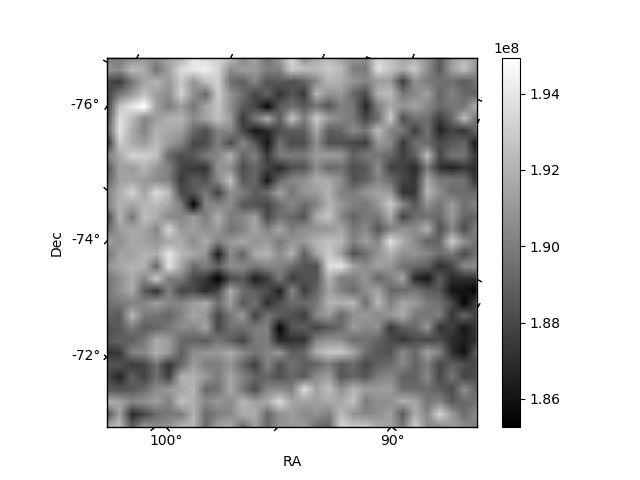
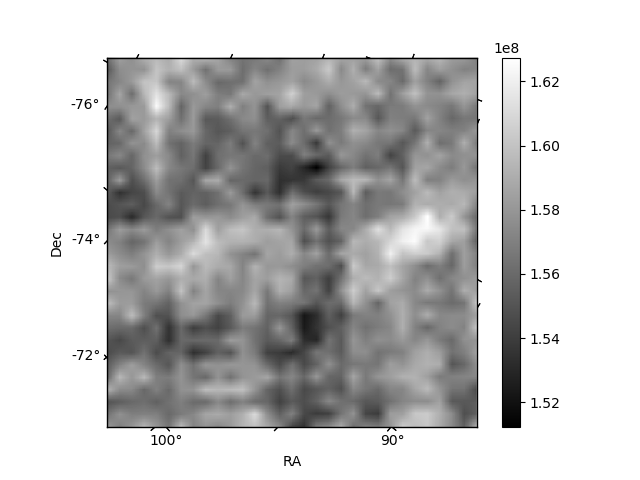
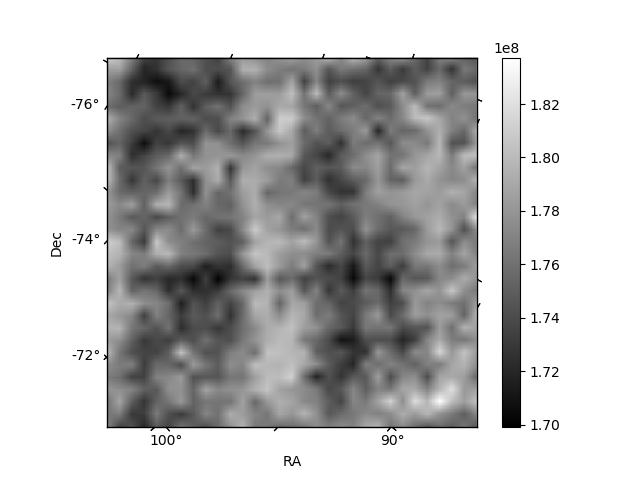
Histogram calculated using DETX and DETY for each event in the final _common_clean file
| Quadrant A | 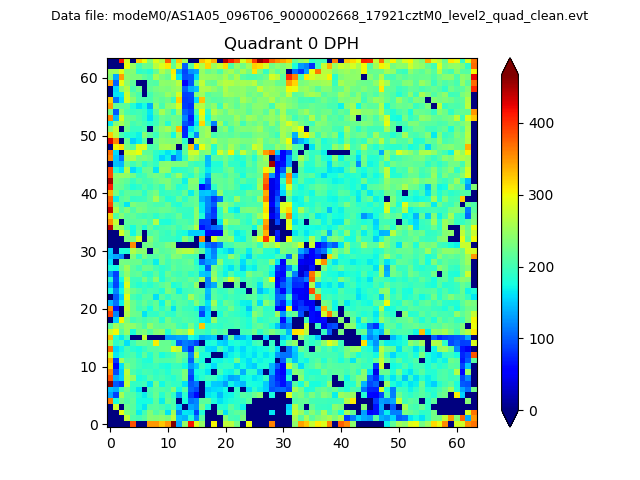 |
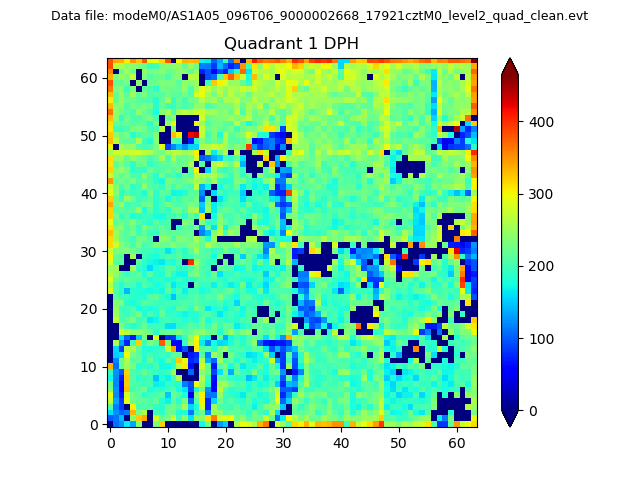 |
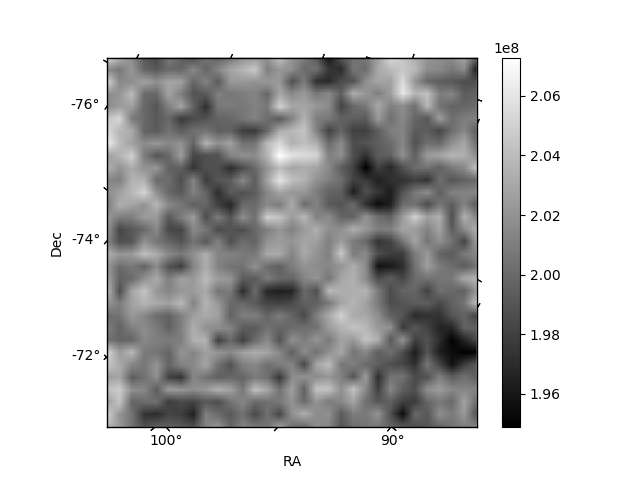
Quadrant B |
|---|---|---|---|
| Quadrant D | 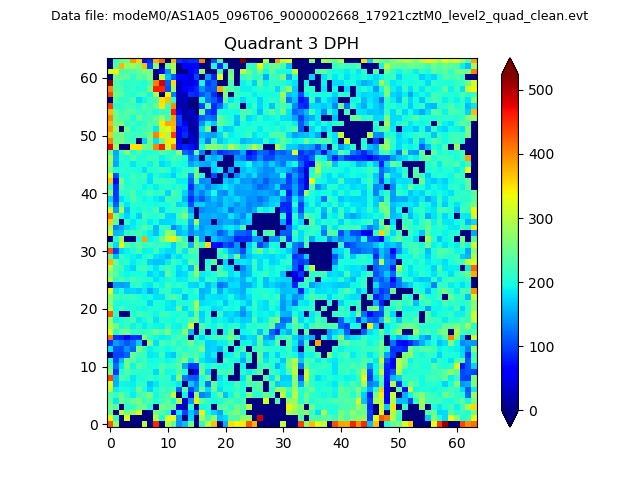 |
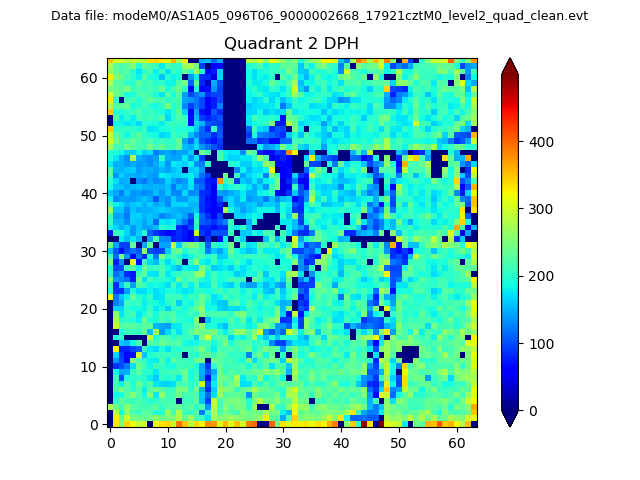 |
Quadrant C |
| Plot type | Count rate plots | Images |
|---|---|---|
| Comparison with Poisson distribution Blue bars denote a histogram of data divided into 1 sec bins. Red curve is a Poisson curve with rate = median count rate of data. |
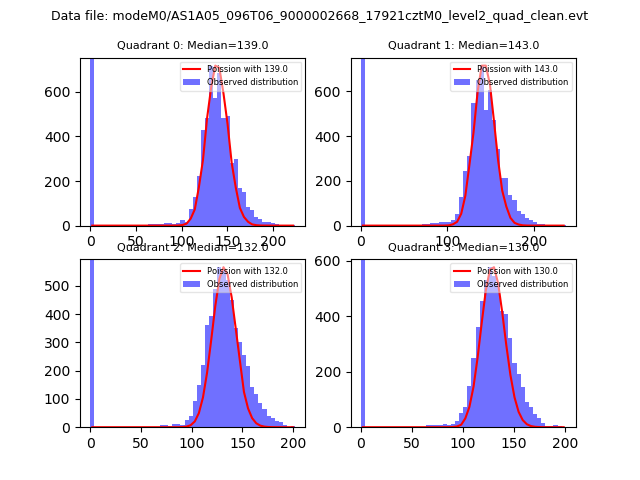 |
 |
| Quadrant-wise count rates Data is divided into 100 sec bins |
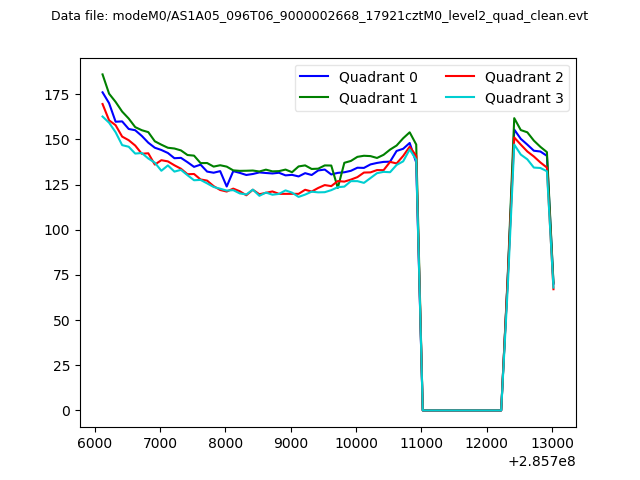 |
|
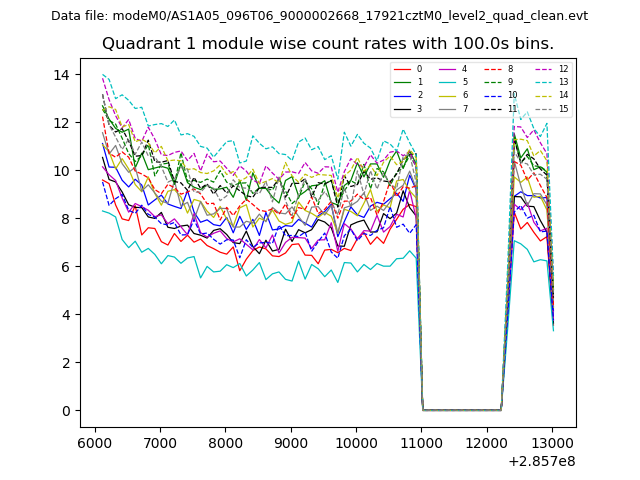
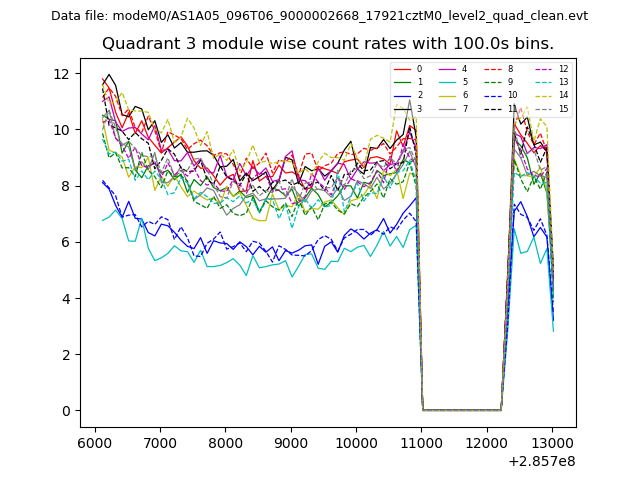
| Module-wise count rates for Quadrant A Data is divided into 100 sec bins |
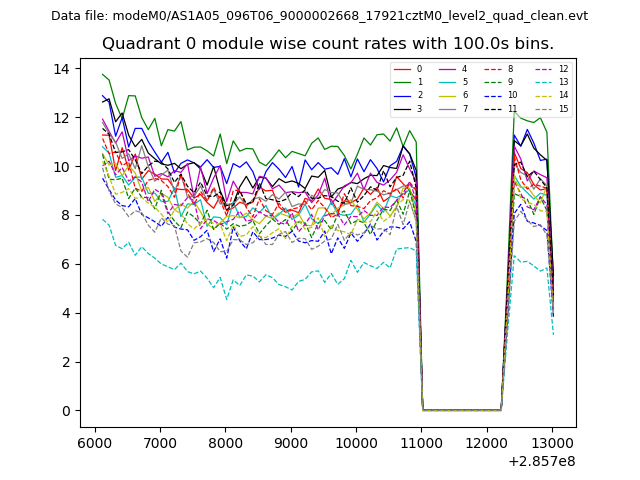 |
 |
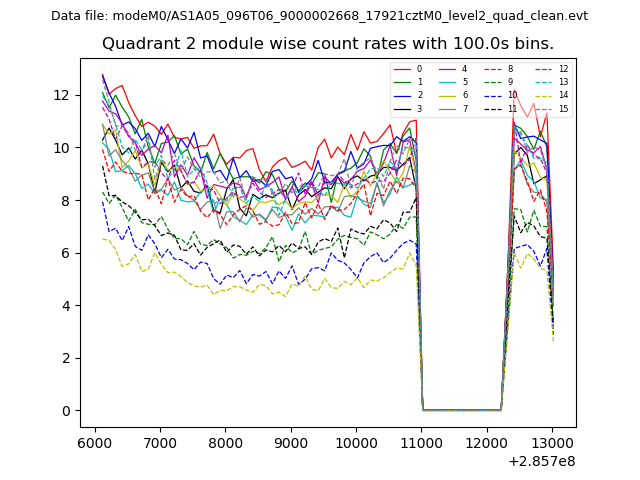
| Module-wise count rates for Quadrant B Data is divided into 100 sec bins |
 |
 |
| Module-wise count rates for Quadrant C Data is divided into 100 sec bins |
 |
 |
| Module-wise count rates for Quadrant D Data is divided into 100 sec bins |
 |
 |
| Parameter | Plot |
|---|---|
| CZT HV Monitor | 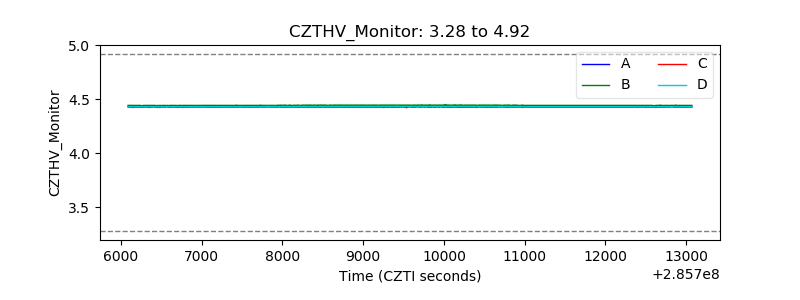 |
| D_VDD | 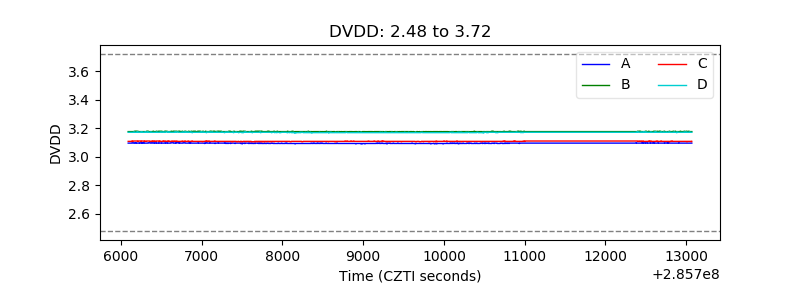 |
| Temperature 1 | 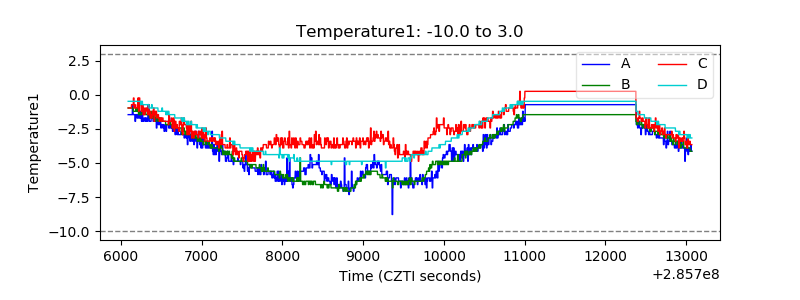 |
| Veto HV Monitor | 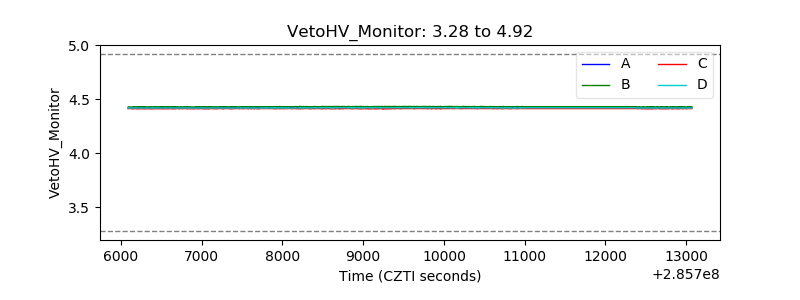 |
| Veto LLD | 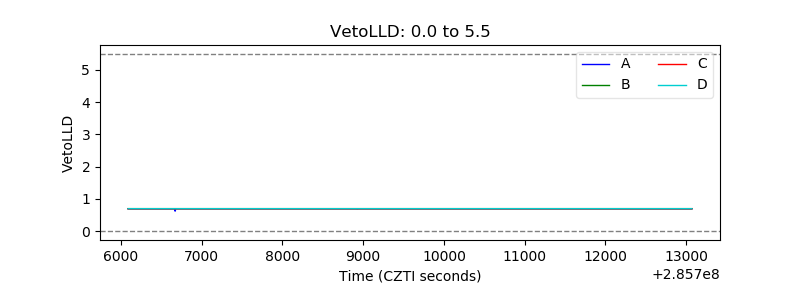 |
| Alpha Counter | 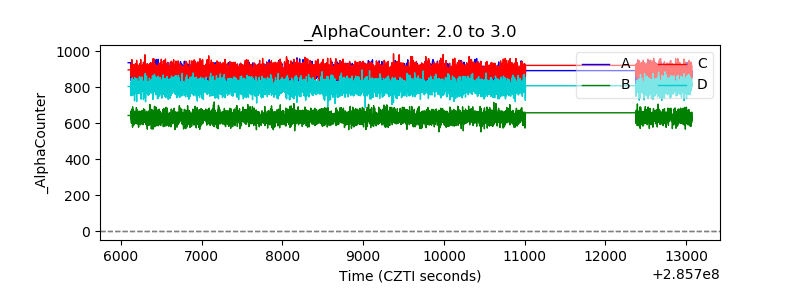 |
| _CPM_Rate | 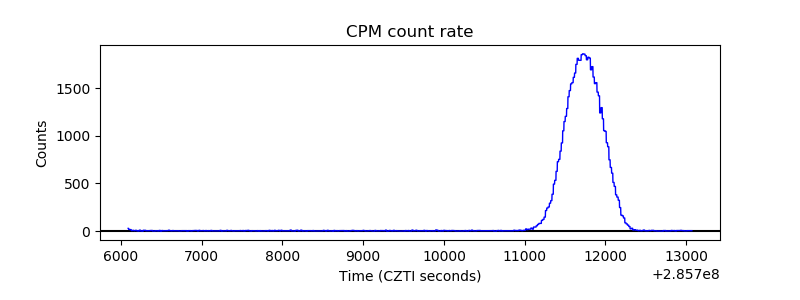 |
| CZT Counter | 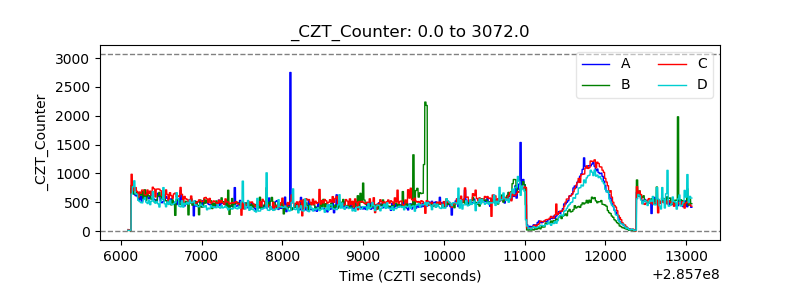 |
| +2.5 Volts monitor | 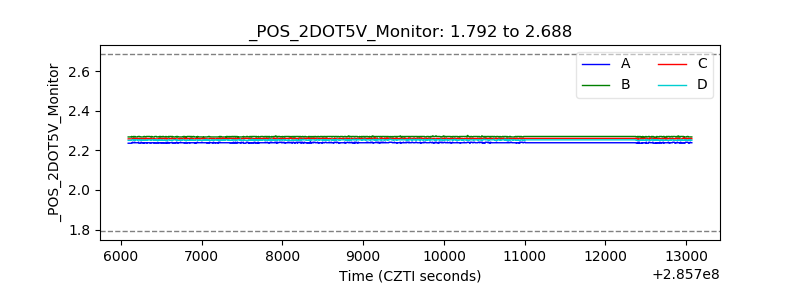 |
| +5 Volts monitor | 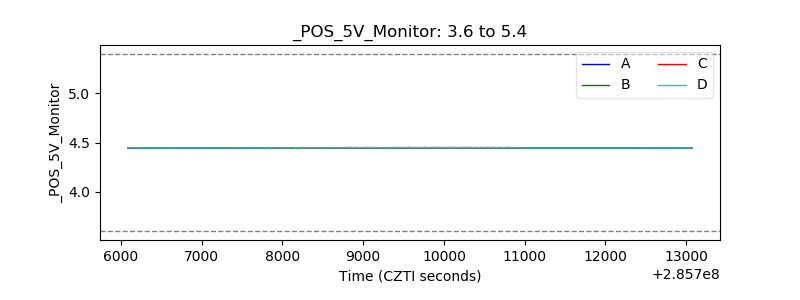 |
| _ROLL_ROT | 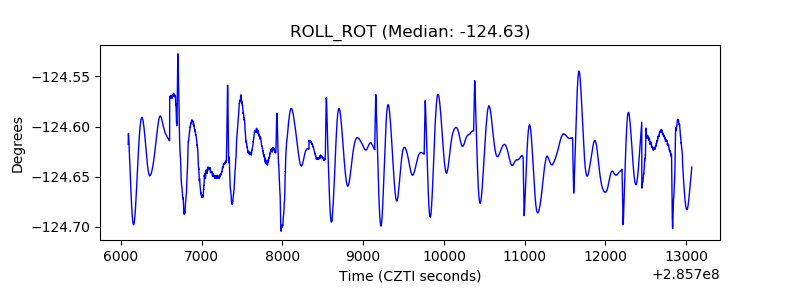 |
| _Roll_DEC | 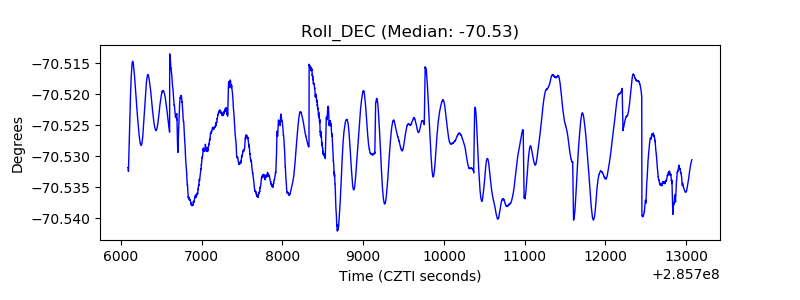 |
| _Roll_RA | 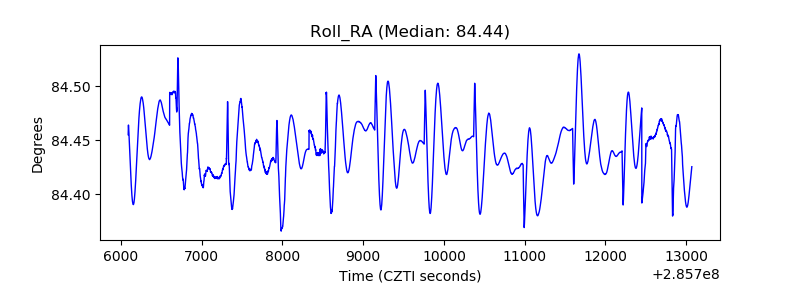 |
| Veto Counter | 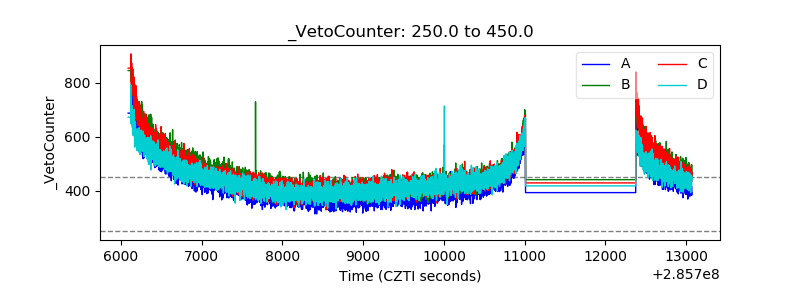 |