| Param | Original file | Final file |
|---|---|---|
| Filename | modeM0/AS1T03_025T01_9000002670cztM0_level2.fits | modeM0/AS1T03_025T01_9000002670cztM0_level2_quad_clean.evt |
| Size (bytes) | 1,782,348,480 | 2,049,016,320 |
| Size | 1.7 GB | 1.9 GB |
| Events in quadrant A | 10,818,524 | 12,776,445 |
| Events in quadrant B | 10,471,616 | 13,038,376 |
| Events in quadrant C | 10,673,996 | 12,268,947 |
| Events in quadrant D | 9,194,330 | 11,159,986 |
| Mode SS | |||
|---|---|---|---|
| Quadrant | BADHDUFLAG | Total packets | Discarded packets |
| A | 0 | 3812 | 0 |
| B | 0 | 3812 | 0 |
| C | 0 | 3812 | 0 |
| D | 0 | 3812 | 0 |
| Mode M0 | |||
|---|---|---|---|
| Quadrant | BADHDUFLAG | Total packets | Discarded packets |
| A | 0 | 399984 | 0 |
| B | 0 | 396127 | 0 |
| C | 0 | 391568 | 0 |
| D | 0 | 453830 | 0 |
| Mode M9 | |||
|---|---|---|---|
| Quadrant | BADHDUFLAG | Total packets | Discarded packets |
| A | 0 | 282 | 0 |
| B | 0 | 282 | 0 |
| C | 0 | 282 | 0 |
| D | 0 | 282 | 0 |
| Quadrant | Total seconds | Saturated seconds | Saturation percentage |
|---|---|---|---|
| A | 187122 | 2753 | 1.471233% |
| B | 187122 | 2417 | 1.291671% |
| C | 187122 | 2778 | 1.484593% |
| D | 187122 | 6169 | 3.296780% |
Noise dominated data is calculated using 1-second bins in cleaned event files. If a bin has >2000 counts, and if more than 50% of those come from <1% of pixels, then it is considered to be noise-dominated and hence unusable.
| Quadrant | # 1 sec bins | Bins with >0 counts | Bins with >2000 counts | High rate bins dominated by noise | Noise dominated (total time) | Noise dominated (detector-on time) | Marked lightcurve |
|---|---|---|---|---|---|---|---|
| A | 215348 | 187106 | 0 | 0 | 0.00% | 0.00% | 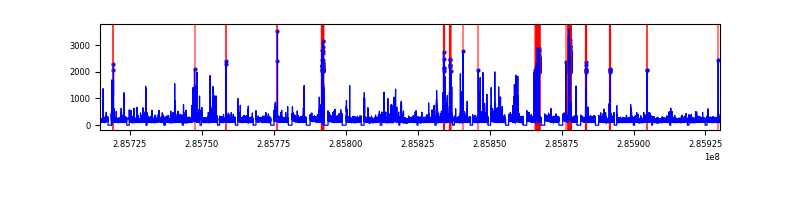 |
| B | 215348 | 187114 | 0 | 0 | 0.00% | 0.00% |  |
| C | 215348 | 187113 | 0 | 0 | 0.00% | 0.00% |  |
| D | 215348 | 186930 | 0 | 0 | 0.00% | 0.00% |  |
Top three noisy pixels from each quadrant. If the there are fewer than three noisy pixels in the level2.evt file, extra rows are filled as -1
| Pixel properties | Quadrant properties | ||||||
|---|---|---|---|---|---|---|---|
| Quadrant | DetID | PixID | Counts | Sigma | Mean | Median | Sigma |
| A | 0 | 29 | 10429 | 11.09 | 2815 | 2643 | 701.9 |
| A | 7 | 110 | 8657 | 8.57 | 2815 | 2643 | 701.9 |
| A | 0 | 30 | 8275 | 8.02 | 2815 | 2643 | 701.9 |
| B | 2 | 9 | 8592 | 11.13 | 2768 | 2648 | 534.1 |
| B | 2 | 8 | 7276 | 8.66 | 2768 | 2648 | 534.1 |
| B | 5 | 128 | 7024 | 8.19 | 2768 | 2648 | 534.1 |
| C | 12 | 241 | 7642 | 6.96 | 2823 | 2641 | 719.0 |
| C | 2 | 191 | 7064 | 6.15 | 2823 | 2641 | 719.0 |
| C | 3 | 126 | 7033 | 6.11 | 2823 | 2641 | 719.0 |
| D | 10 | 190 | 6944 | 6.57 | 2625 | 2393 | 692.6 |
| D | 3 | 14 | 6858 | 6.45 | 2625 | 2393 | 692.6 |
| D | 6 | 231 | 6648 | 6.14 | 2625 | 2393 | 692.6 |
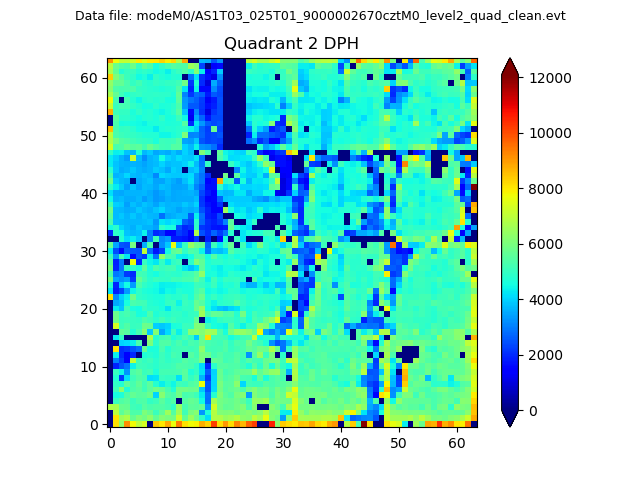
Histogram calculated using DETX and DETY for each event in the final _common_clean file
| Quadrant A | 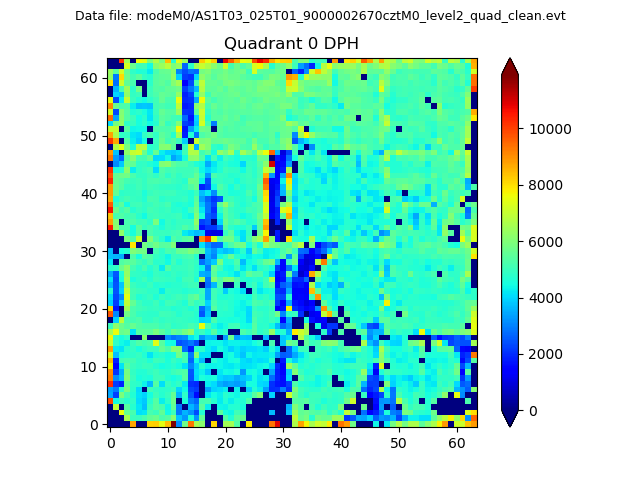 |
 |
Quadrant B |
|---|---|---|---|
| Quadrant D |  |
 |
Quadrant C |
| Plot type | Count rate plots | Images |
|---|---|---|
| Comparison with Poisson distribution Blue bars denote a histogram of data divided into 1 sec bins. Red curve is a Poisson curve with rate = median count rate of data. |
 |
 |
| Quadrant-wise count rates Data is divided into 100 sec bins |
 |
|
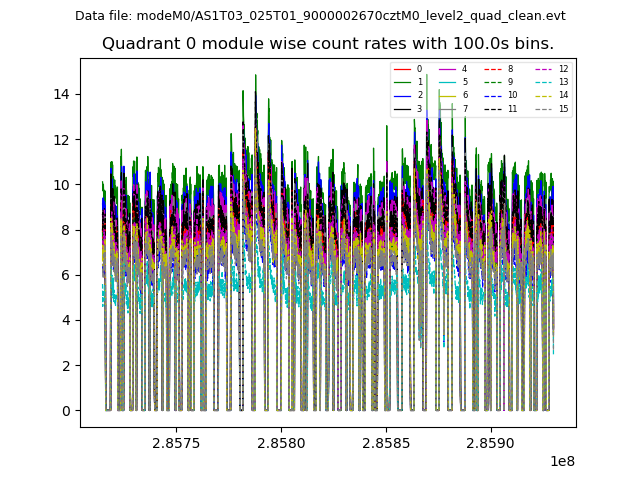
| Module-wise count rates for Quadrant A Data is divided into 100 sec bins |
 |
 |
| Module-wise count rates for Quadrant B Data is divided into 100 sec bins |
 |
 |
| Module-wise count rates for Quadrant C Data is divided into 100 sec bins |
 |
 |
| Module-wise count rates for Quadrant D Data is divided into 100 sec bins |
 |
 |
| Parameter | Plot |
|---|---|
| CZT HV Monitor |  |
| D_VDD |  |
| Temperature 1 |  |
| Veto HV Monitor |  |
| Veto LLD |  |
| Alpha Counter |  |
| _CPM_Rate | 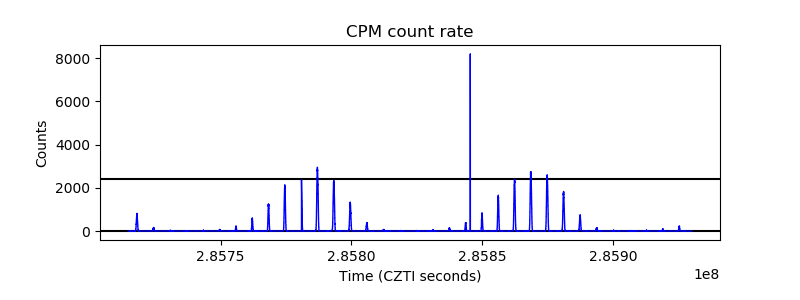 |
| CZT Counter |  |
| +2.5 Volts monitor |  |
| +5 Volts monitor |  |
| _ROLL_ROT |  |
| _Roll_DEC |  |
| _Roll_RA |  |
| Veto Counter |  |