| Param | Original file | Final file |
|---|---|---|
| Filename | modeM0/AS1T03_025T01_9000002670_17923cztM0_level2.evt | modeM0/AS1T03_025T01_9000002670_17923cztM0_level2_quad_clean.evt |
| Size (bytes) | 514,321,920 | 126,086,400 |
| Size | 490.5 MB | 120.2 MB |
| Events in quadrant A | 3,724,544 | 824,083 |
| Events in quadrant B | 3,777,322 | 849,191 |
| Events in quadrant C | 3,706,776 | 802,169 |
| Events in quadrant D | 3,825,083 | 788,281 |
| Mode SS | |||
|---|---|---|---|
| Quadrant | BADHDUFLAG | Total packets | Discarded packets |
| A | 0 | 166 | 0 |
| B | 0 | 166 | 0 |
| C | 0 | 166 | 0 |
| D | 0 | 166 | 0 |
| Mode M0 | |||
|---|---|---|---|
| Quadrant | BADHDUFLAG | Total packets | Discarded packets |
| A | 0 | 16658 | 2 |
| B | 0 | 16686 | 2 |
| C | 0 | 16490 | 2 |
| D | 0 | 17274 | 2 |
| Mode M9 | |||
|---|---|---|---|
| Quadrant | BADHDUFLAG | Total packets | Discarded packets |
| A | 0 | 12 | 0 |
| B | 0 | 12 | 0 |
| C | 0 | 12 | 0 |
| D | 0 | 12 | 0 |
| Quadrant | Total seconds | Saturated seconds | Saturation percentage |
|---|---|---|---|
| A | 7977 | 84 | 1.053027% |
| B | 7978 | 96 | 1.203309% |
| C | 7978 | 99 | 1.240913% |
| D | 7978 | 97 | 1.215844% |
Noise dominated data is calculated using 1-second bins in cleaned event files. If a bin has >2000 counts, and if more than 50% of those come from <1% of pixels, then it is considered to be noise-dominated and hence unusable.
| Quadrant | # 1 sec bins | Bins with >0 counts | Bins with >2000 counts | High rate bins dominated by noise | Noise dominated (total time) | Noise dominated (detector-on time) | Marked lightcurve |
|---|---|---|---|---|---|---|---|
| A | 9257 | 7979 | 8 | 8 | 0.09% | 0.10% | 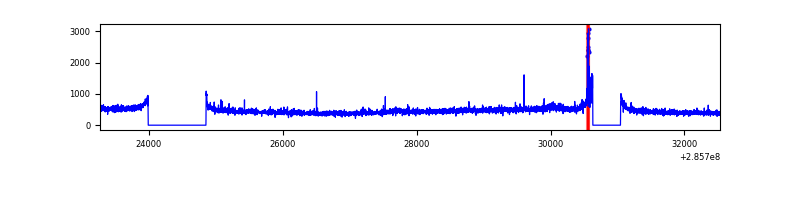 |
| B | 9258 | 7980 | 1 | 1 | 0.01% | 0.01% | 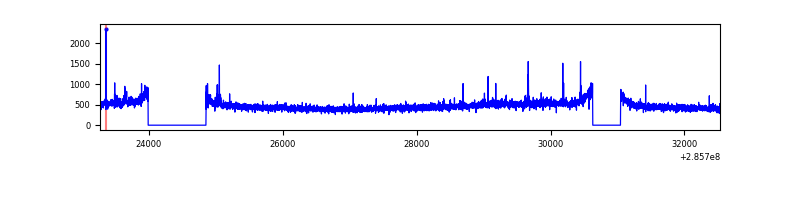 |
| C | 9258 | 7980 | 1 | 1 | 0.01% | 0.01% | 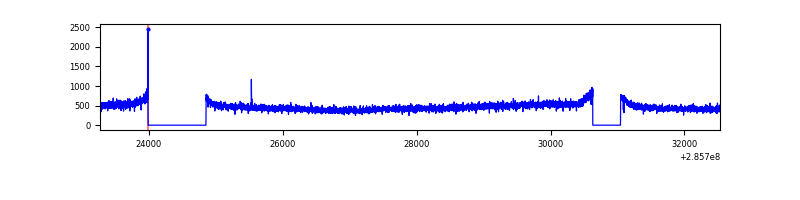 |
| D | 9258 | 7980 | 55 | 55 | 0.59% | 0.69% | 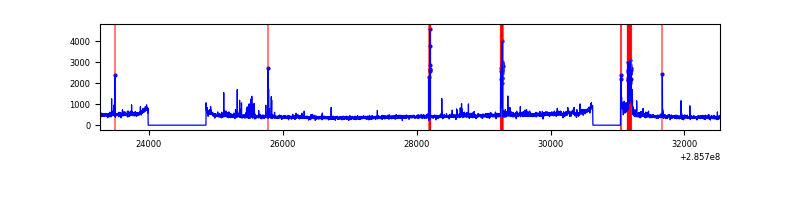 |
Top three noisy pixels from each quadrant. If the there are fewer than three noisy pixels in the level2.evt file, extra rows are filled as -1
| Pixel properties | Quadrant properties | ||||||
|---|---|---|---|---|---|---|---|
| Quadrant | DetID | PixID | Counts | Sigma | Mean | Median | Sigma |
| A | 15 | 174 | 96206 | 501.81 | 941 | 918 | 189.9 |
| A | 2 | 242 | 9503 | 45.21 | 941 | 918 | 189.9 |
| A | 0 | 226 | 8310 | 38.93 | 941 | 918 | 189.9 |
| B | 12 | 111 | 21589 | 114.94 | 952 | 928 | 179.8 |
| B | 11 | 111 | 18715 | 98.95 | 952 | 928 | 179.8 |
| B | 4 | 216 | 16898 | 88.84 | 952 | 928 | 179.8 |
| C | 14 | 238 | 140042 | 652.32 | 910 | 914 | 213.3 |
| C | 3 | 233 | 11264 | 48.53 | 910 | 914 | 213.3 |
| C | 13 | 61 | 6523 | 26.3 | 910 | 914 | 213.3 |
| D | 7 | 238 | 223078 | 1005.82 | 913 | 886 | 220.9 |
| D | 10 | 70 | 64270 | 286.93 | 913 | 886 | 220.9 |
| D | 12 | 110 | 49471 | 219.94 | 913 | 886 | 220.9 |
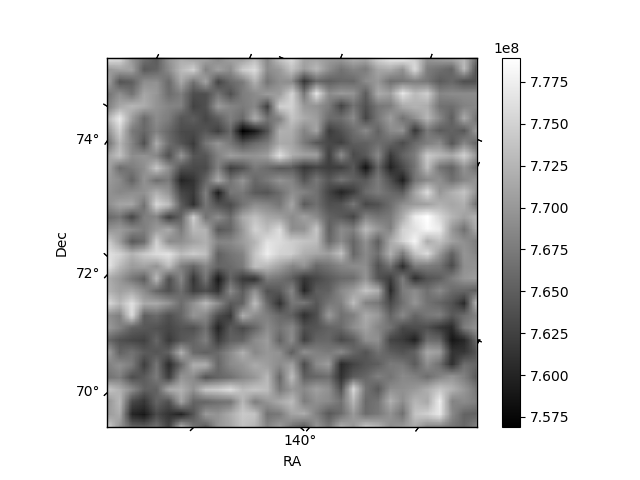
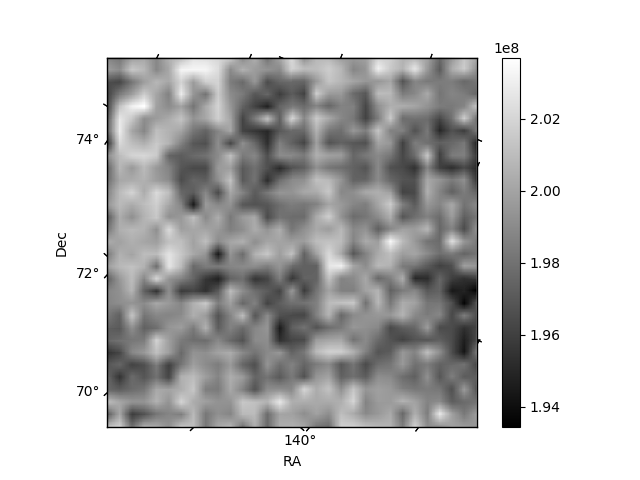
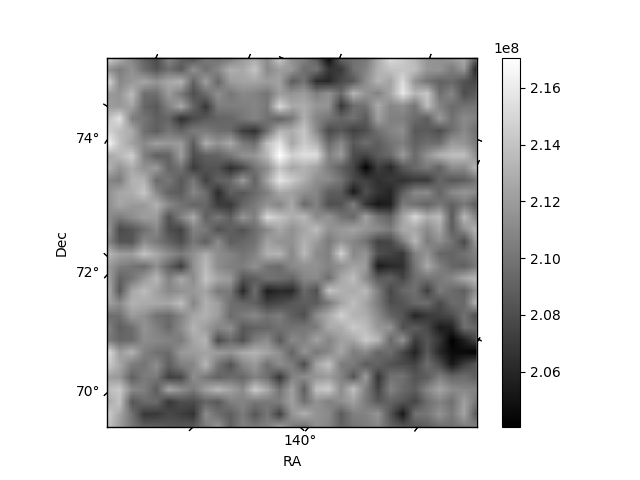
Histogram calculated using DETX and DETY for each event in the final _common_clean file
| Quadrant A | 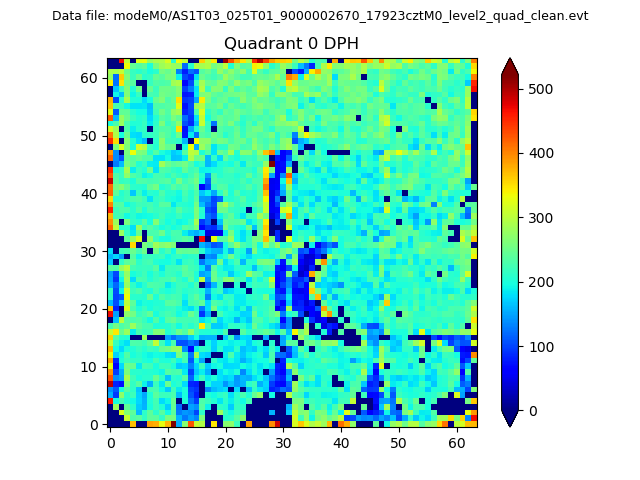 |
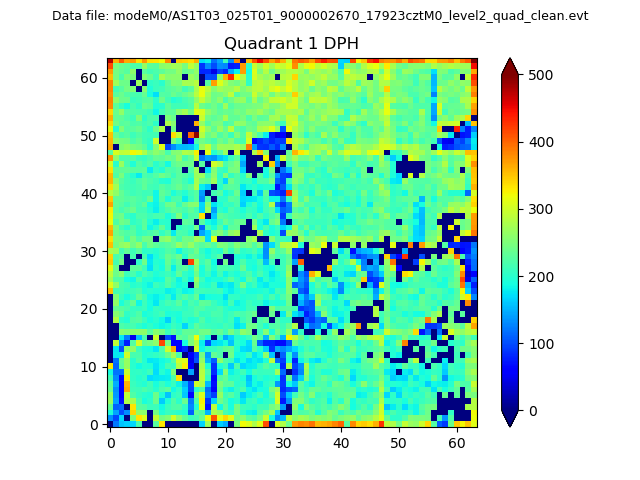 |
Quadrant B |
|---|---|---|---|
| Quadrant D | 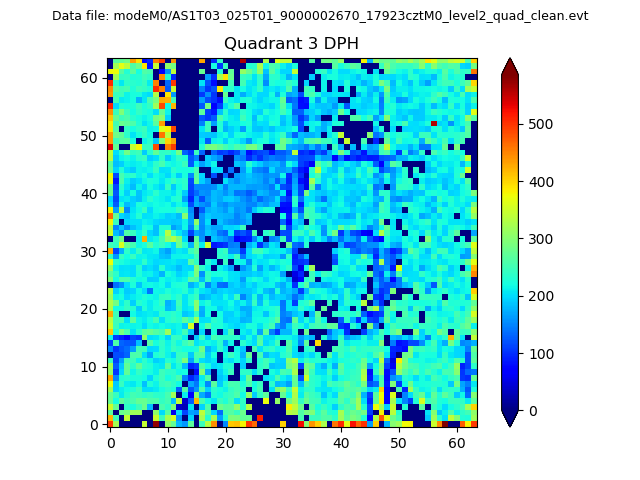 |
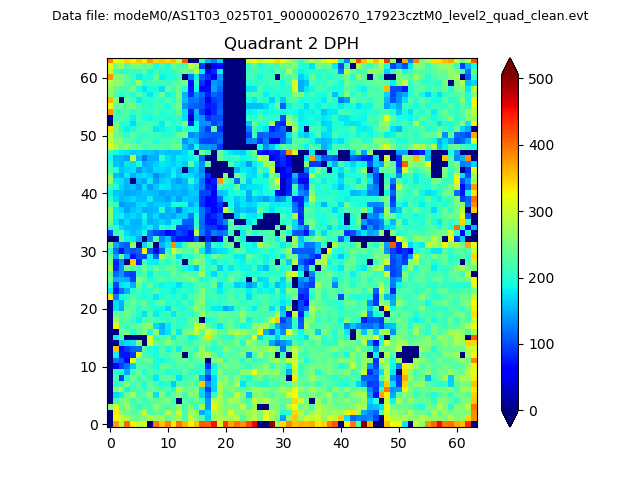 |
Quadrant C |
| Plot type | Count rate plots | Images |
|---|---|---|
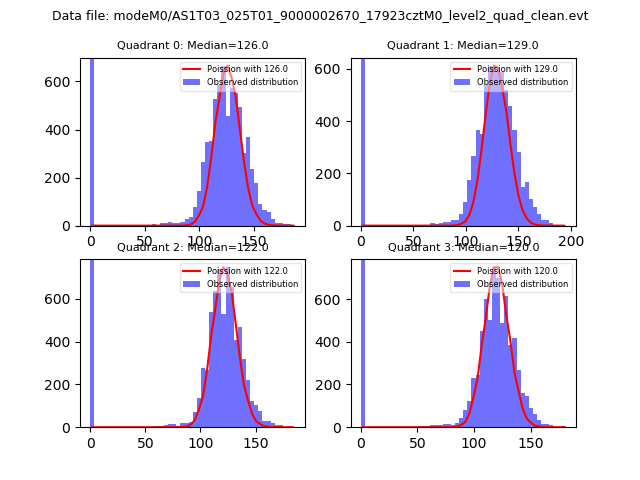
| Comparison with Poisson distribution Blue bars denote a histogram of data divided into 1 sec bins. Red curve is a Poisson curve with rate = median count rate of data. |
 |
 |
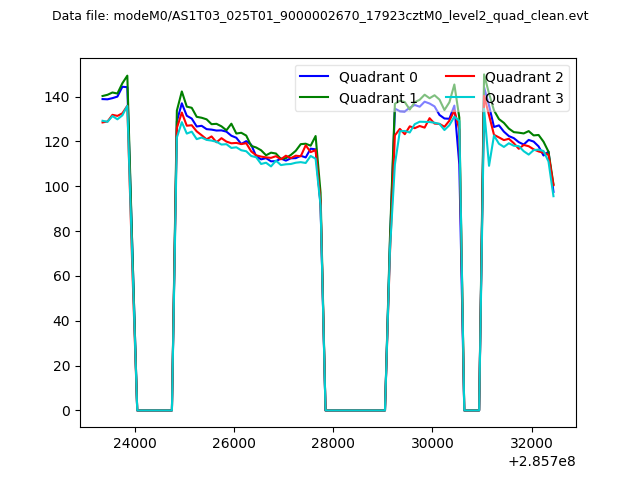
| Quadrant-wise count rates Data is divided into 100 sec bins |
 |
|
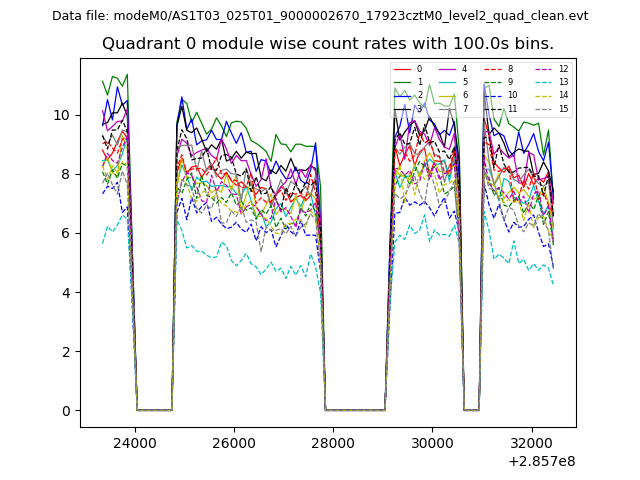
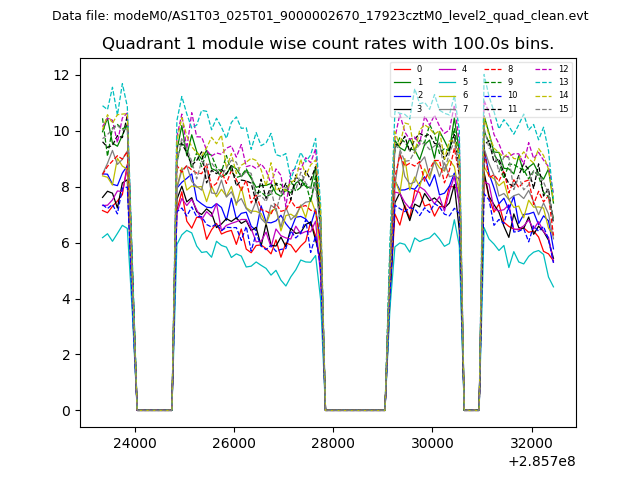
| Module-wise count rates for Quadrant A Data is divided into 100 sec bins |
 |
 |
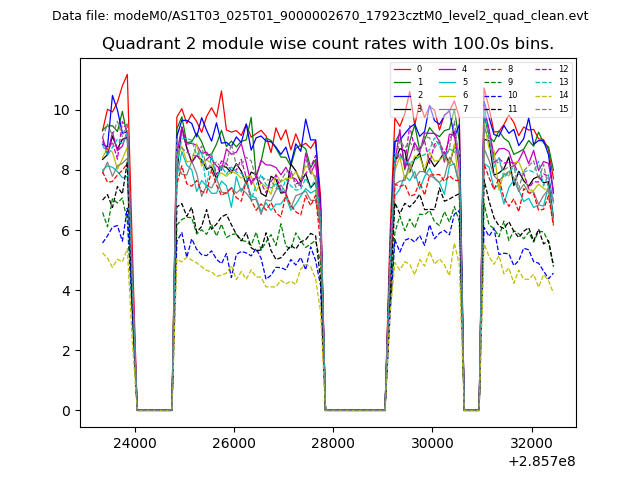
| Module-wise count rates for Quadrant B Data is divided into 100 sec bins |
 |
 |
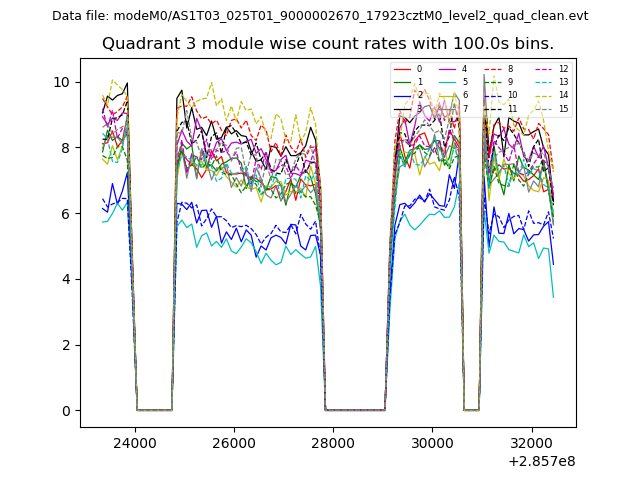
| Module-wise count rates for Quadrant C Data is divided into 100 sec bins |
 |
 |
| Module-wise count rates for Quadrant D Data is divided into 100 sec bins |
 |
 |
| Parameter | Plot |
|---|---|
| CZT HV Monitor | 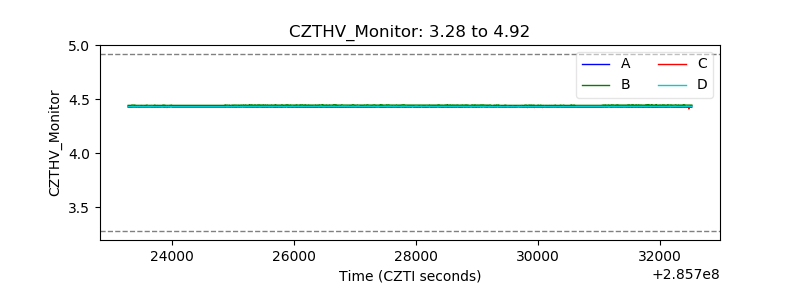 |
| D_VDD | 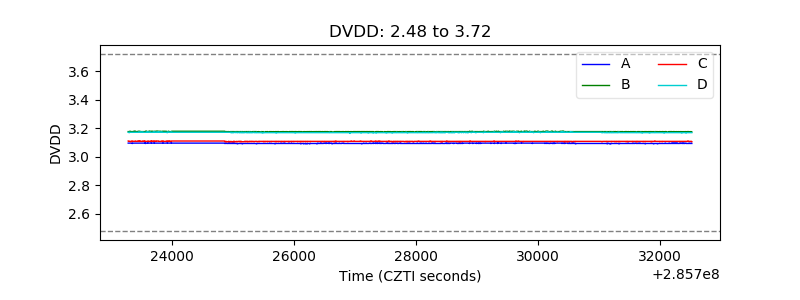 |
| Temperature 1 | 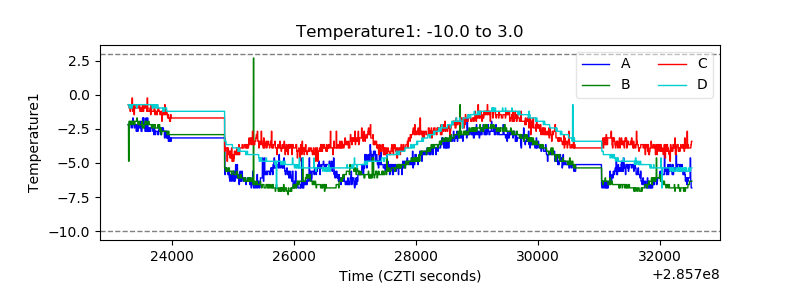 |
| Veto HV Monitor | 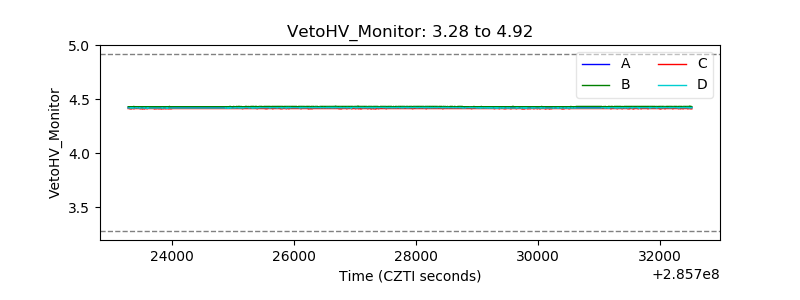 |
| Veto LLD | 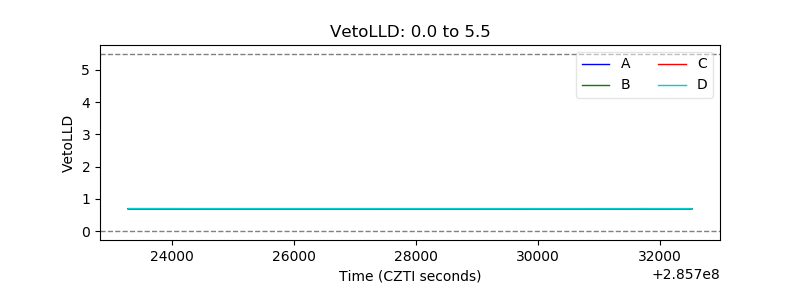 |
| Alpha Counter | 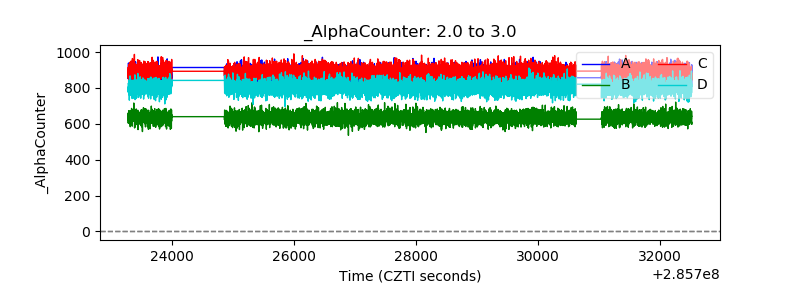 |
| _CPM_Rate | 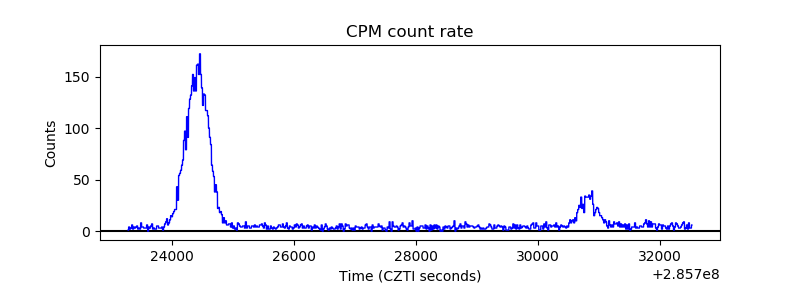 |
| CZT Counter | 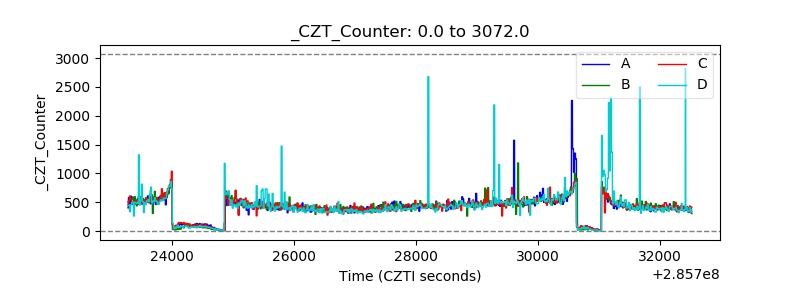 |
| +2.5 Volts monitor |  |
| +5 Volts monitor |  |
| _ROLL_ROT | 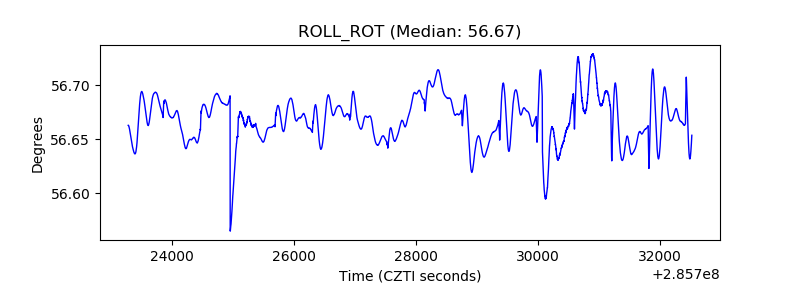 |
| _Roll_DEC | 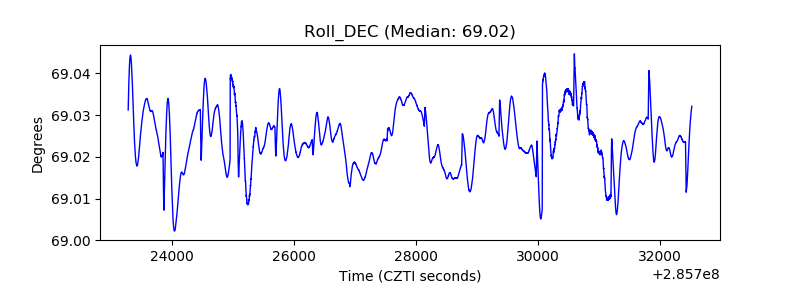 |
| _Roll_RA | 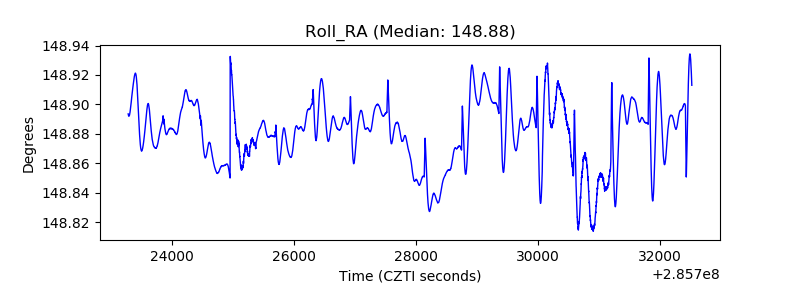 |
| Veto Counter | 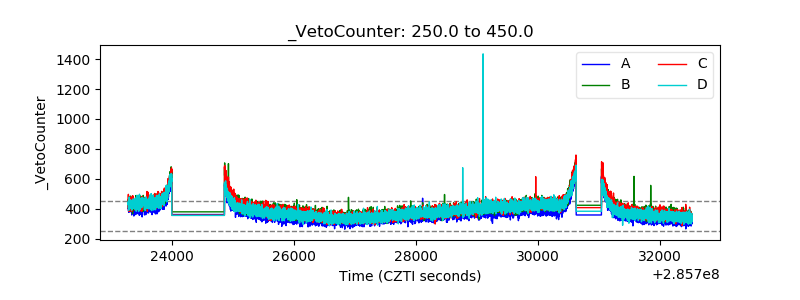 |