| Param | Original file | Final file |
|---|---|---|
| Filename | modeM0/AS1T03_025T01_9000002670_17924cztM0_level2.evt | modeM0/AS1T03_025T01_9000002670_17924cztM0_level2_quad_clean.evt |
| Size (bytes) | 478,503,360 | 117,722,880 |
| Size | 456.3 MB | 112.3 MB |
| Events in quadrant A | 3,372,918 | 764,186 |
| Events in quadrant B | 3,464,434 | 787,419 |
| Events in quadrant C | 3,427,356 | 748,665 |
| Events in quadrant D | 3,710,595 | 737,100 |
| Mode SS | |||
|---|---|---|---|
| Quadrant | BADHDUFLAG | Total packets | Discarded packets |
| A | 0 | 154 | 0 |
| B | 0 | 154 | 0 |
| C | 0 | 154 | 0 |
| D | 0 | 154 | 0 |
| Mode M0 | |||
|---|---|---|---|
| Quadrant | BADHDUFLAG | Total packets | Discarded packets |
| A | 0 | 15508 | 2 |
| B | 0 | 15580 | 2 |
| C | 0 | 15538 | 2 |
| D | 0 | 16838 | 2 |
| Mode M9 | |||
|---|---|---|---|
| Quadrant | BADHDUFLAG | Total packets | Discarded packets |
| A | 0 | 4 | 0 |
| B | 0 | 5 | 0 |
| C | 0 | 5 | 0 |
| D | 0 | 5 | 0 |
| Quadrant | Total seconds | Saturated seconds | Saturation percentage |
|---|---|---|---|
| A | 7599 | 69 | 0.908014% |
| B | 7599 | 84 | 1.105409% |
| C | 7599 | 85 | 1.118568% |
| D | 7598 | 129 | 1.697815% |
Noise dominated data is calculated using 1-second bins in cleaned event files. If a bin has >2000 counts, and if more than 50% of those come from <1% of pixels, then it is considered to be noise-dominated and hence unusable.
| Quadrant | # 1 sec bins | Bins with >0 counts | Bins with >2000 counts | High rate bins dominated by noise | Noise dominated (total time) | Noise dominated (detector-on time) | Marked lightcurve |
|---|---|---|---|---|---|---|---|
| A | 7855 | 7601 | 0 | 0 | 0.00% | 0.00% | 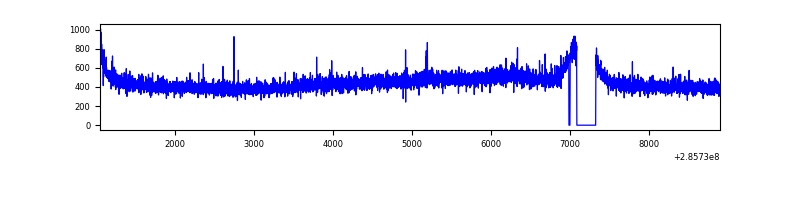 |
| B | 7855 | 7601 | 0 | 0 | 0.00% | 0.00% | 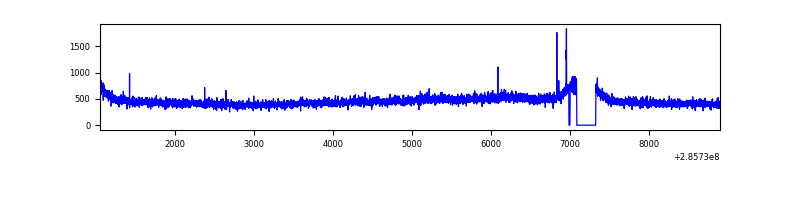 |
| C | 7855 | 7601 | 0 | 0 | 0.00% | 0.00% |  |
| D | 7854 | 7600 | 70 | 70 | 0.89% | 0.92% | 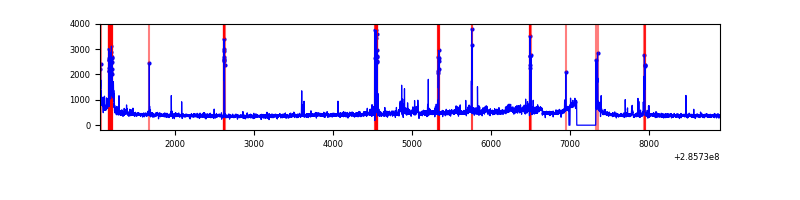 |
Top three noisy pixels from each quadrant. If the there are fewer than three noisy pixels in the level2.evt file, extra rows are filled as -1
| Pixel properties | Quadrant properties | ||||||
|---|---|---|---|---|---|---|---|
| Quadrant | DetID | PixID | Counts | Sigma | Mean | Median | Sigma |
| A | 15 | 174 | 10193 | 52.8 | 873 | 855 | 176.9 |
| A | 0 | 226 | 7612 | 38.21 | 873 | 855 | 176.9 |
| A | 3 | 137 | 6791 | 33.56 | 873 | 855 | 176.9 |
| B | 12 | 111 | 20269 | 114.57 | 882 | 857 | 169.4 |
| B | 11 | 111 | 17621 | 98.94 | 882 | 857 | 169.4 |
| B | 14 | 111 | 14848 | 82.57 | 882 | 857 | 169.4 |
| C | 14 | 238 | 130508 | 656.25 | 843 | 847 | 197.6 |
| C | 3 | 233 | 7153 | 31.92 | 843 | 847 | 197.6 |
| C | 13 | 61 | 5836 | 25.25 | 843 | 847 | 197.6 |
| D | 7 | 238 | 227570 | 1103.5 | 844 | 819 | 205.5 |
| D | 12 | 110 | 87088 | 419.84 | 844 | 819 | 205.5 |
| D | 10 | 70 | 84634 | 407.89 | 844 | 819 | 205.5 |
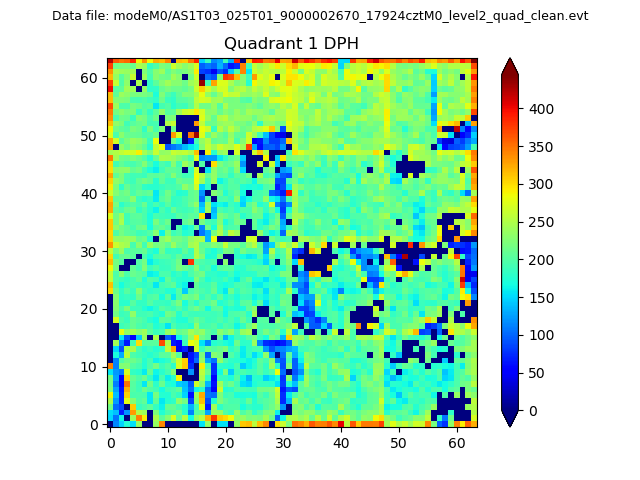
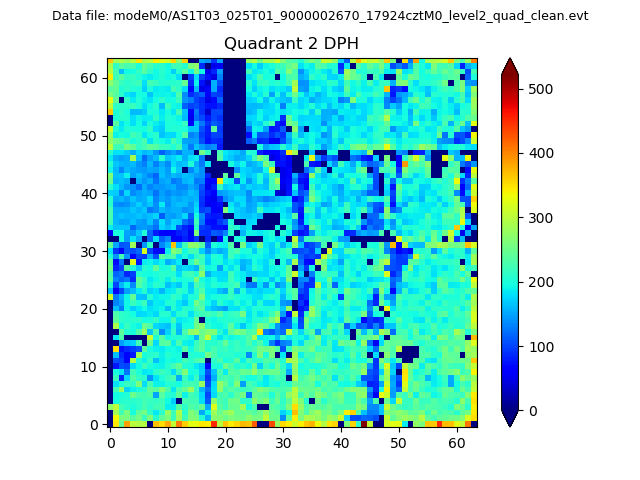
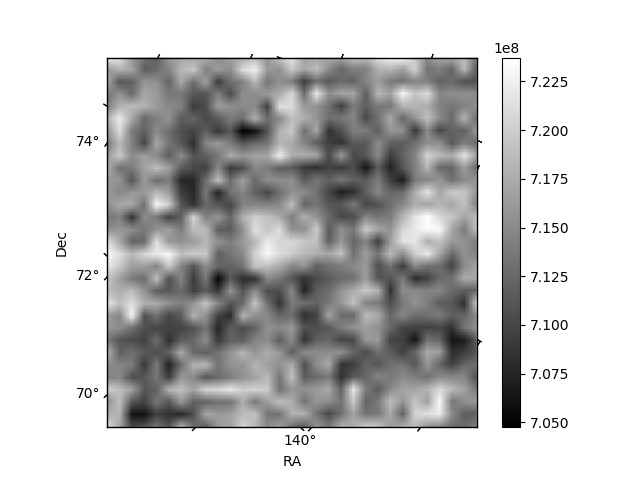
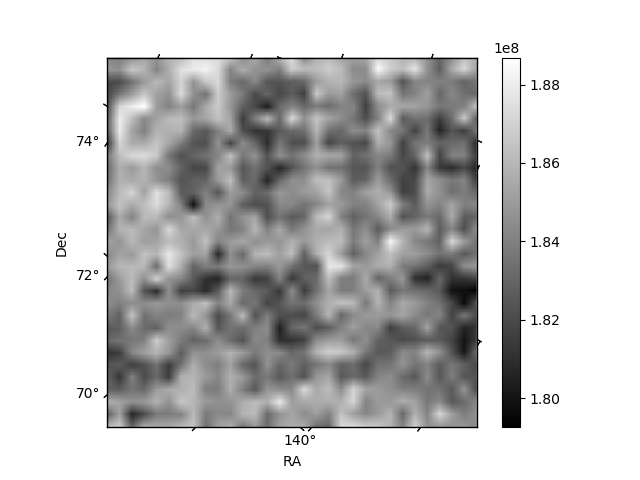
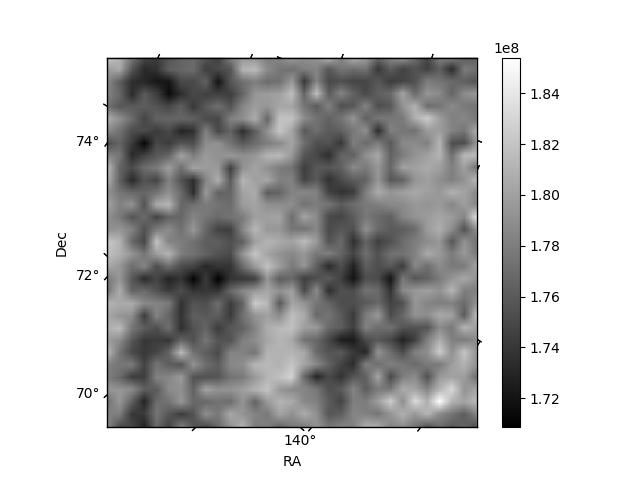
Histogram calculated using DETX and DETY for each event in the final _common_clean file
| Quadrant A | 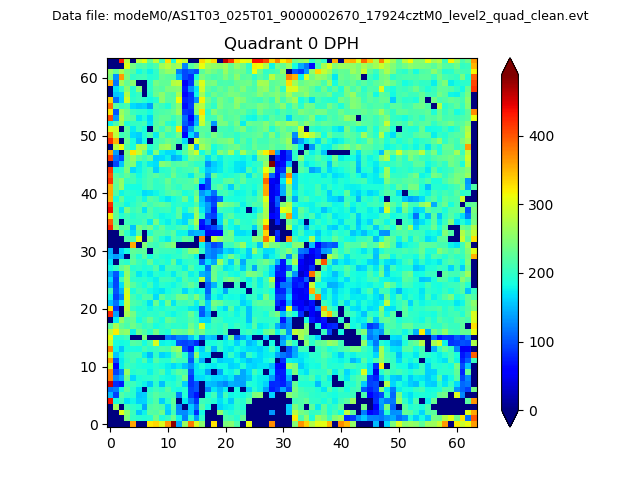 |
 |
Quadrant B |
|---|---|---|---|
| Quadrant D | 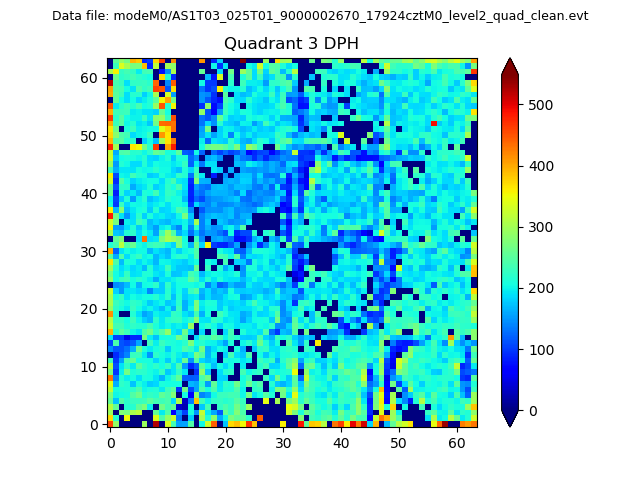 |
 |
Quadrant C |
| Plot type | Count rate plots | Images |
|---|---|---|
| Comparison with Poisson distribution Blue bars denote a histogram of data divided into 1 sec bins. Red curve is a Poisson curve with rate = median count rate of data. |
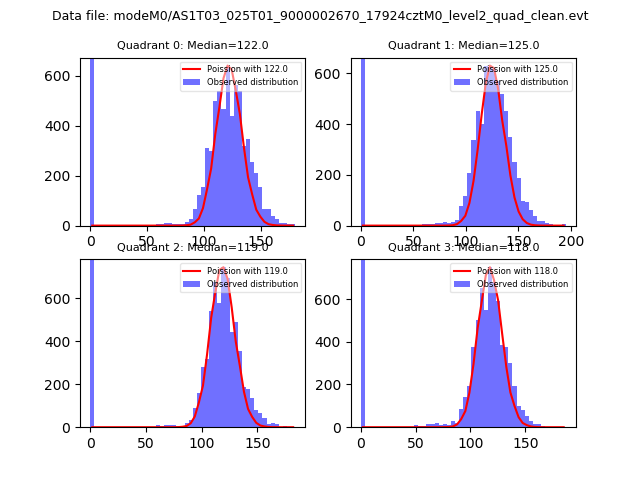 |
 |
| Quadrant-wise count rates Data is divided into 100 sec bins |
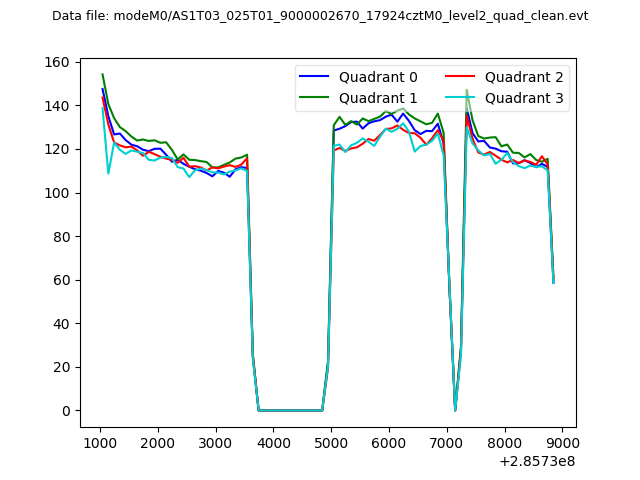 |
|
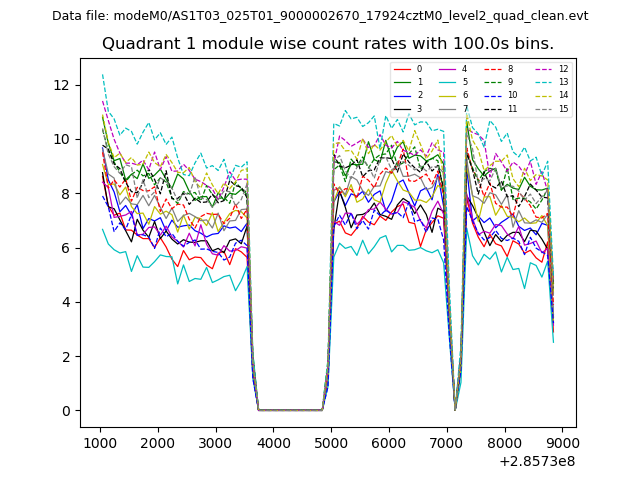
| Module-wise count rates for Quadrant A Data is divided into 100 sec bins |
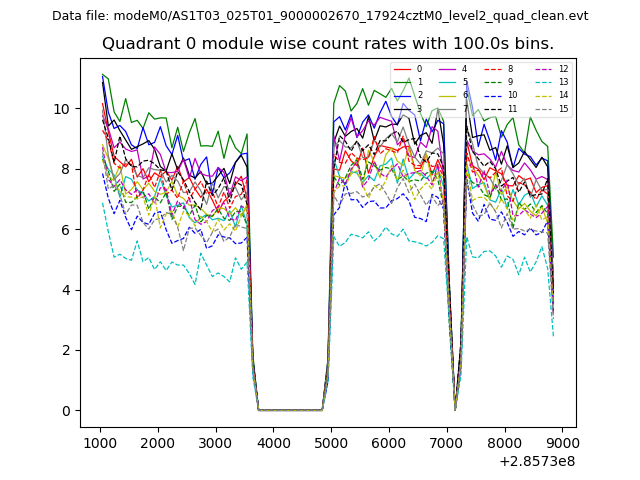 |
 |
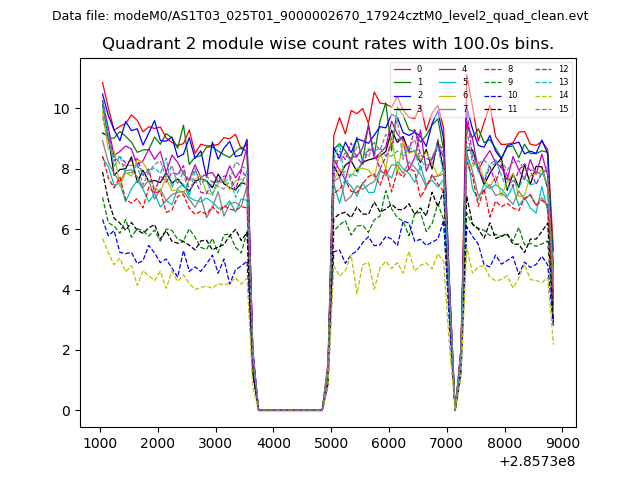
| Module-wise count rates for Quadrant B Data is divided into 100 sec bins |
 |
 |
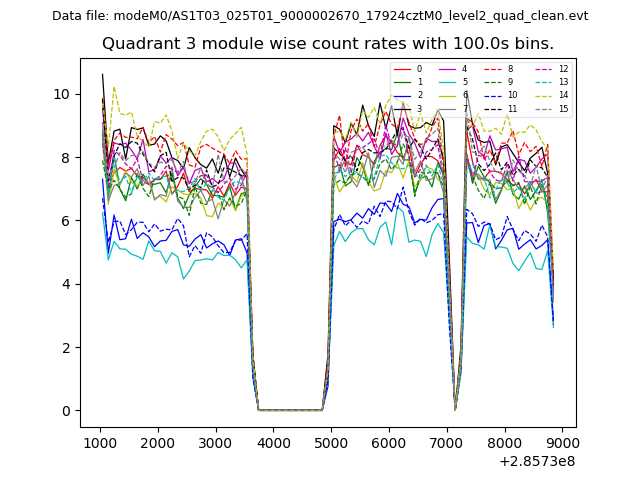
| Module-wise count rates for Quadrant C Data is divided into 100 sec bins |
 |
 |
| Module-wise count rates for Quadrant D Data is divided into 100 sec bins |
 |
 |
| Parameter | Plot |
|---|---|
| CZT HV Monitor | 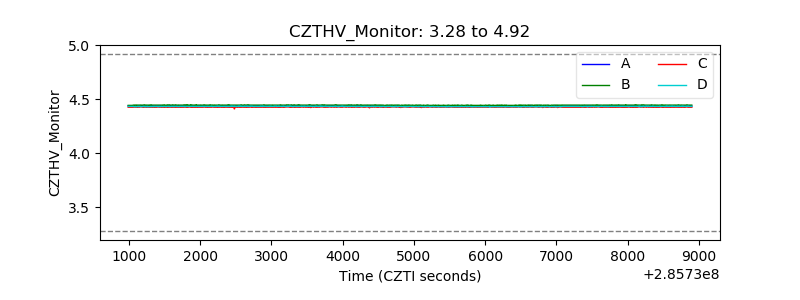 |
| D_VDD | 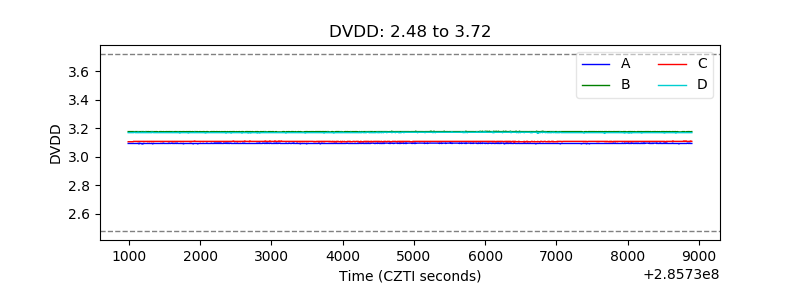 |
| Temperature 1 | 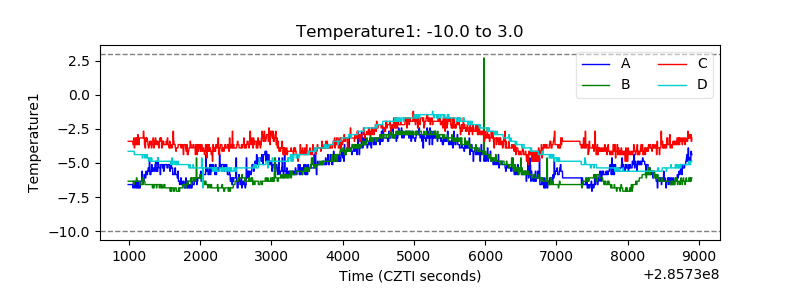 |
| Veto HV Monitor | 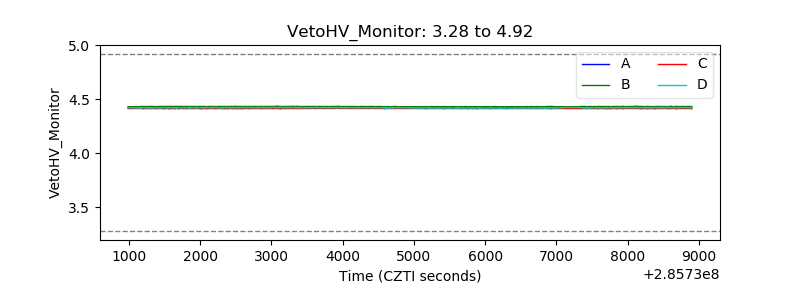 |
| Veto LLD | 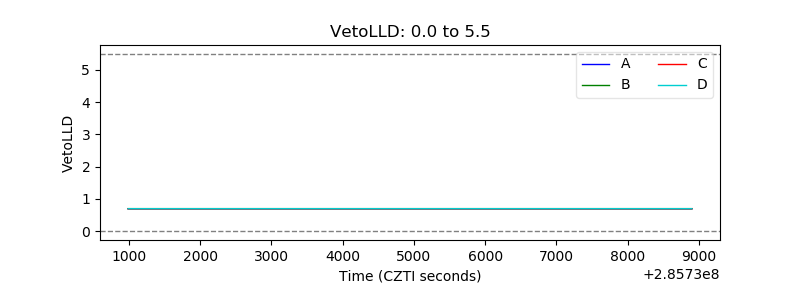 |
| Alpha Counter | 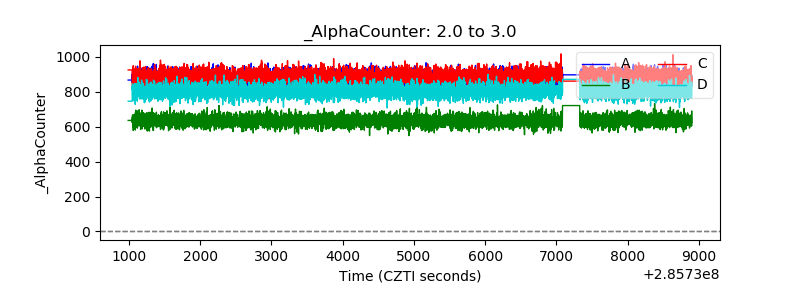 |
| _CPM_Rate | 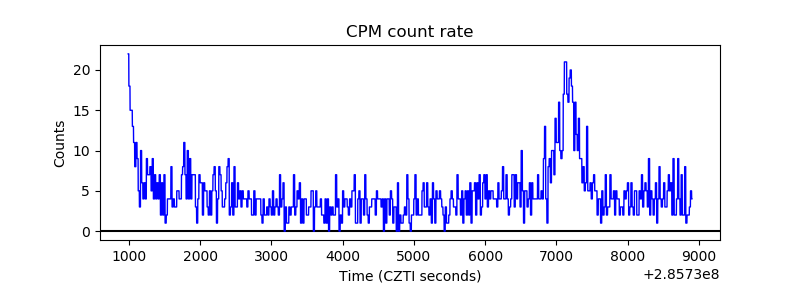 |
| CZT Counter | 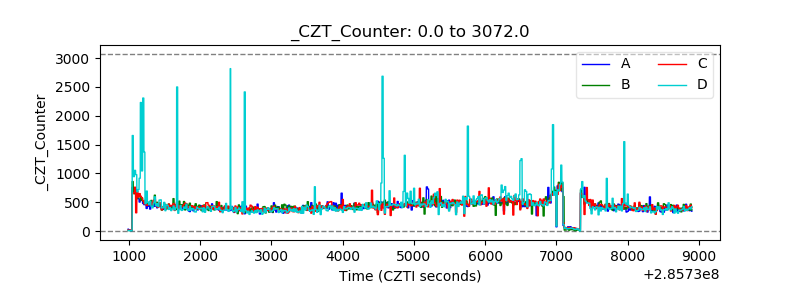 |
| +2.5 Volts monitor |  |
| +5 Volts monitor |  |
| _ROLL_ROT | 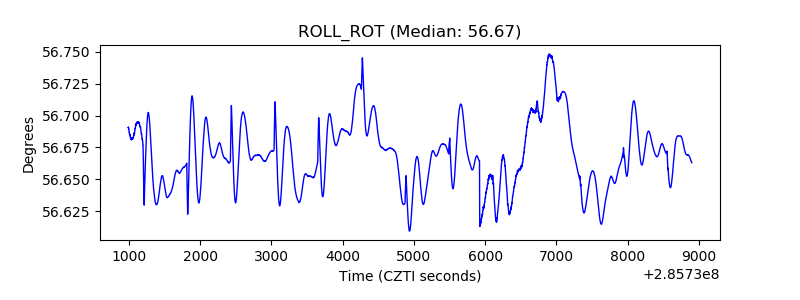 |
| _Roll_DEC | 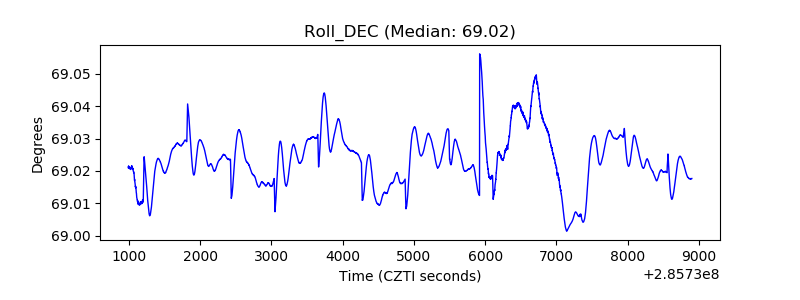 |
| _Roll_RA | 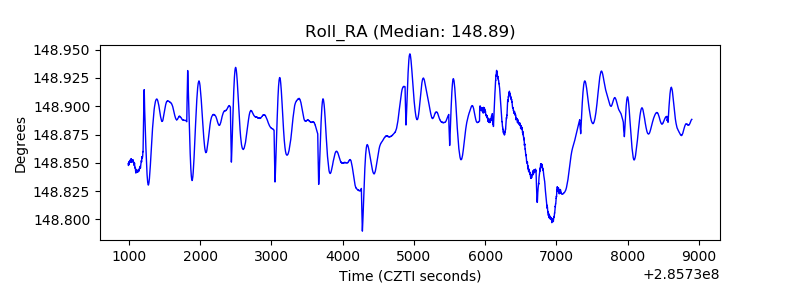 |
| Veto Counter | 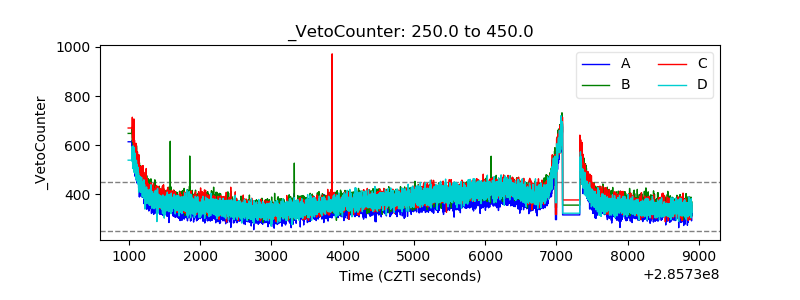 |