| Param | Original file | Final file |
|---|---|---|
| Filename | modeM0/AS1T03_025T01_9000002670_17927cztM0_level2.evt | modeM0/AS1T03_025T01_9000002670_17927cztM0_level2_quad_clean.evt |
| Size (bytes) | 713,738,880 | 154,019,520 |
| Size | 680.7 MB | 146.9 MB |
| Events in quadrant A | 5,502,727 | 989,769 |
| Events in quadrant B | 4,954,412 | 1,017,787 |
| Events in quadrant C | 4,921,385 | 961,349 |
| Events in quadrant D | 5,505,707 | 949,030 |
| Mode SS | |||
|---|---|---|---|
| Quadrant | BADHDUFLAG | Total packets | Discarded packets |
| A | 0 | 220 | 0 |
| B | 0 | 220 | 0 |
| C | 0 | 220 | 0 |
| D | 0 | 220 | 0 |
| Mode M0 | |||
|---|---|---|---|
| Quadrant | BADHDUFLAG | Total packets | Discarded packets |
| A | 0 | 23704 | 2 |
| B | 0 | 21881 | 2 |
| C | 0 | 21806 | 2 |
| D | 0 | 24041 | 2 |
| Mode M9 | |||
|---|---|---|---|
| Quadrant | BADHDUFLAG | Total packets | Discarded packets |
| A | 0 | 12 | 0 |
| B | 0 | 12 | 0 |
| C | 0 | 12 | 0 |
| D | 0 | 12 | 0 |
| Quadrant | Total seconds | Saturated seconds | Saturation percentage |
|---|---|---|---|
| A | 10783 | 148 | 1.372531% |
| B | 10784 | 91 | 0.843843% |
| C | 10784 | 90 | 0.834570% |
| D | 10784 | 124 | 1.149852% |
Noise dominated data is calculated using 1-second bins in cleaned event files. If a bin has >2000 counts, and if more than 50% of those come from <1% of pixels, then it is considered to be noise-dominated and hence unusable.
| Quadrant | # 1 sec bins | Bins with >0 counts | Bins with >2000 counts | High rate bins dominated by noise | Noise dominated (total time) | Noise dominated (detector-on time) | Marked lightcurve |
|---|---|---|---|---|---|---|---|
| A | 12008 | 10785 | 41 | 41 | 0.34% | 0.38% | 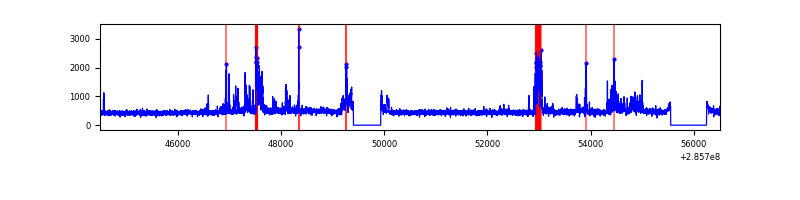 |
| B | 12009 | 10786 | 3 | 3 | 0.02% | 0.03% | 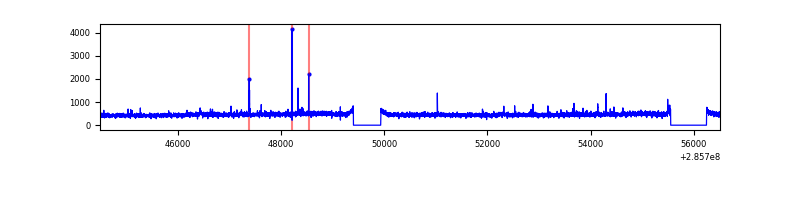 |
| C | 12009 | 10786 | 0 | 0 | 0.00% | 0.00% |  |
| D | 12009 | 10786 | 82 | 82 | 0.68% | 0.76% | 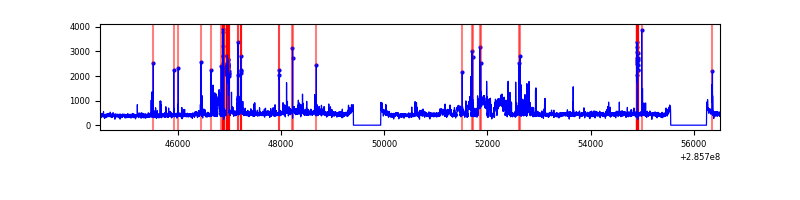 |
Top three noisy pixels from each quadrant. If the there are fewer than three noisy pixels in the level2.evt file, extra rows are filled as -1
| Pixel properties | Quadrant properties | ||||||
|---|---|---|---|---|---|---|---|
| Quadrant | DetID | PixID | Counts | Sigma | Mean | Median | Sigma |
| A | 15 | 174 | 701515 | 2798.19 | 1245 | 1217 | 250.3 |
| A | 3 | 254 | 13747 | 50.07 | 1245 | 1217 | 250.3 |
| A | 0 | 226 | 10705 | 37.91 | 1245 | 1217 | 250.3 |
| B | 12 | 111 | 28996 | 116.06 | 1251 | 1217 | 239.4 |
| B | 11 | 111 | 25155 | 100.01 | 1251 | 1217 | 239.4 |
| B | 0 | 189 | 21344 | 84.09 | 1251 | 1217 | 239.4 |
| C | 14 | 238 | 185024 | 656.96 | 1196 | 1199 | 279.8 |
| C | 3 | 233 | 64812 | 227.34 | 1196 | 1199 | 279.8 |
| C | 13 | 61 | 8518 | 26.16 | 1196 | 1199 | 279.8 |
| D | 12 | 110 | 325569 | 1110.64 | 1206 | 1172 | 292.1 |
| D | 7 | 238 | 257008 | 875.91 | 1206 | 1172 | 292.1 |
| D | 10 | 70 | 163878 | 557.06 | 1206 | 1172 | 292.1 |
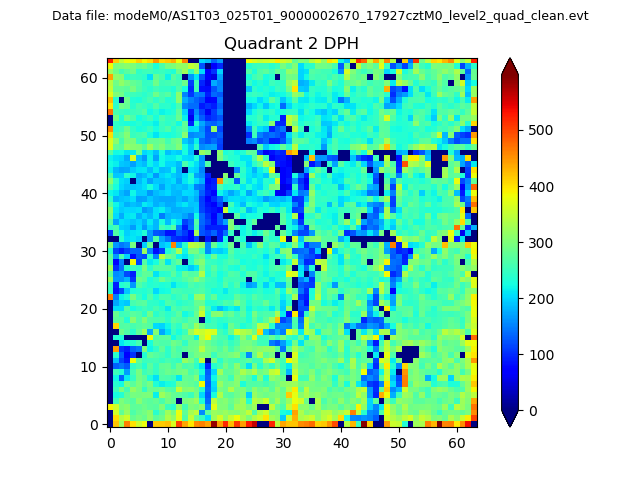
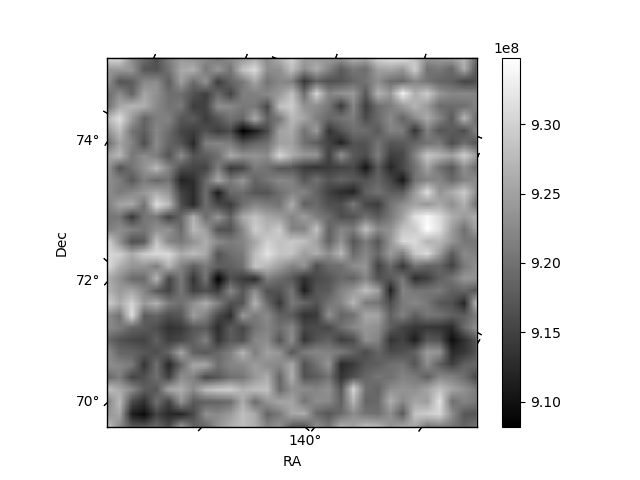
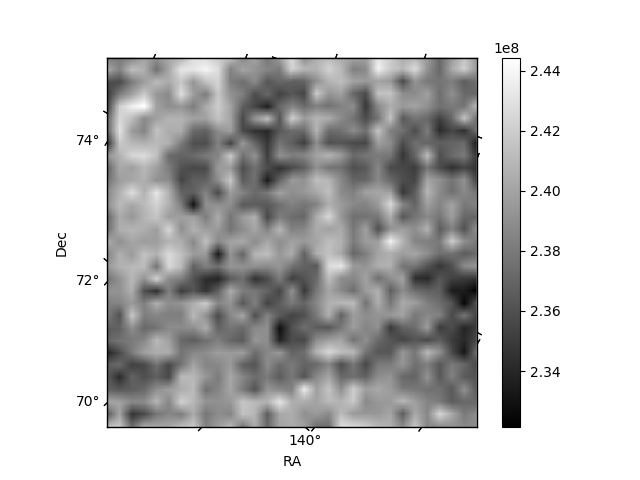
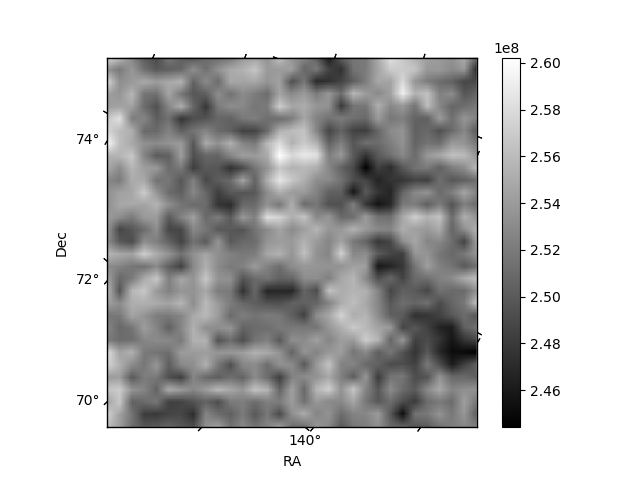
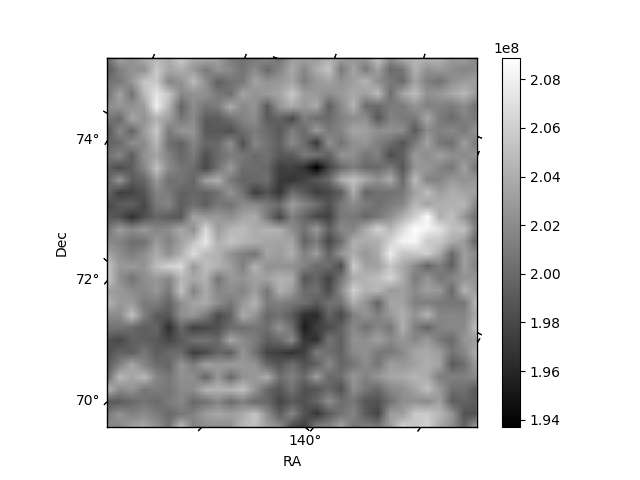
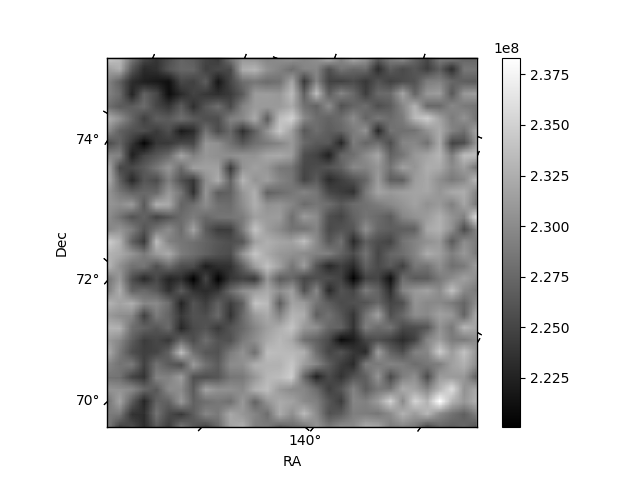
Histogram calculated using DETX and DETY for each event in the final _common_clean file
| Quadrant A | 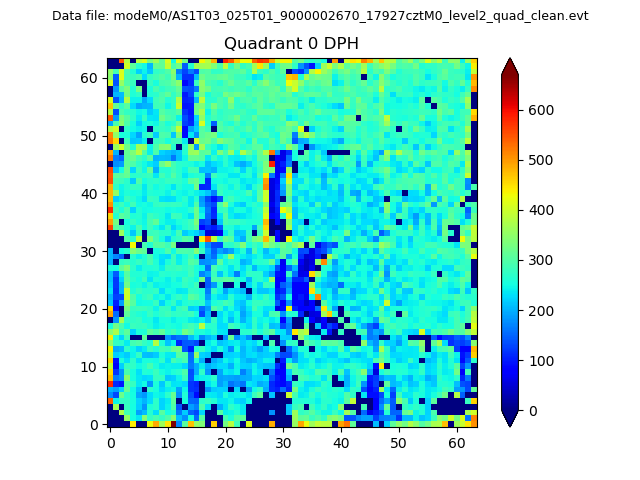 |
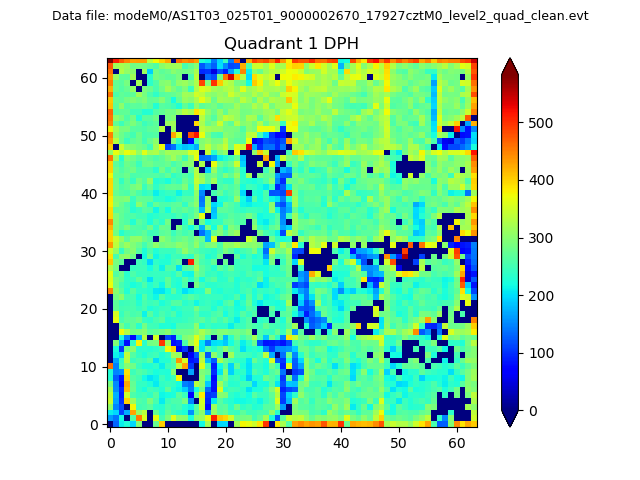 |
Quadrant B |
|---|---|---|---|
| Quadrant D | 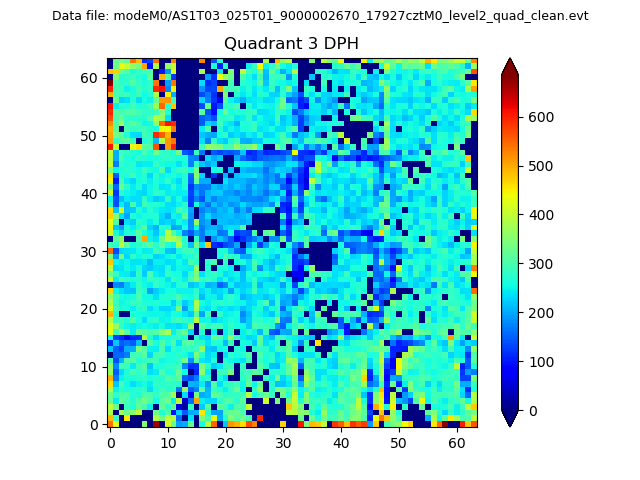 |
 |
Quadrant C |
| Plot type | Count rate plots | Images |
|---|---|---|
| Comparison with Poisson distribution Blue bars denote a histogram of data divided into 1 sec bins. Red curve is a Poisson curve with rate = median count rate of data. |
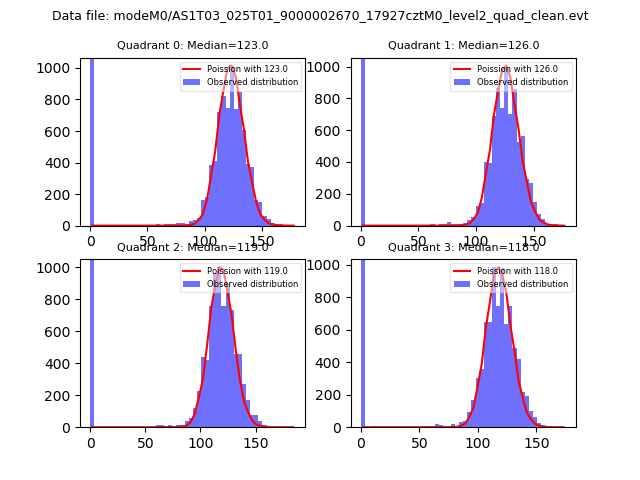 |
 |
| Quadrant-wise count rates Data is divided into 100 sec bins |
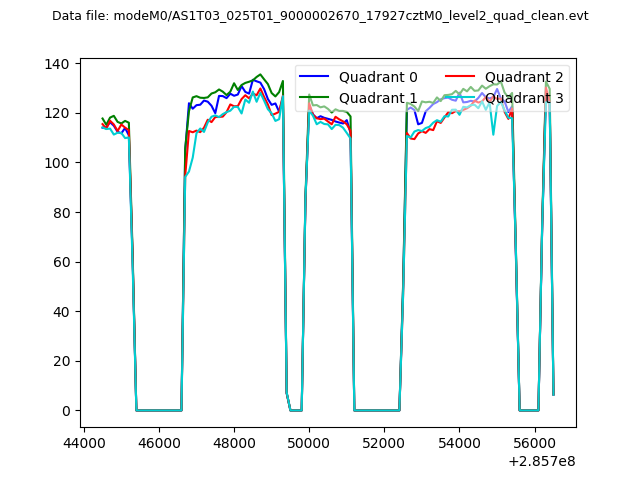 |
|
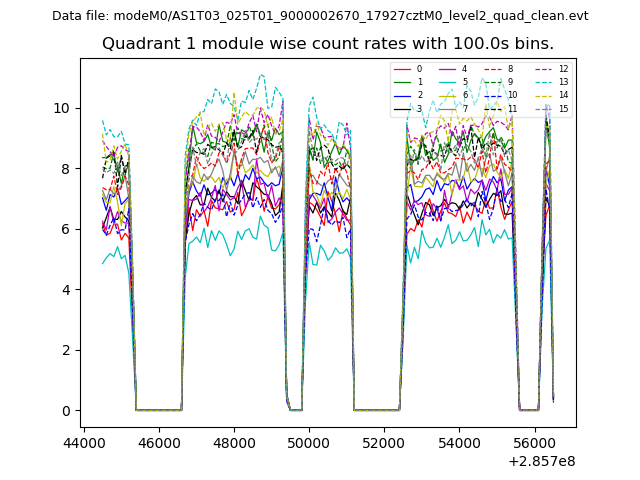
| Module-wise count rates for Quadrant A Data is divided into 100 sec bins |
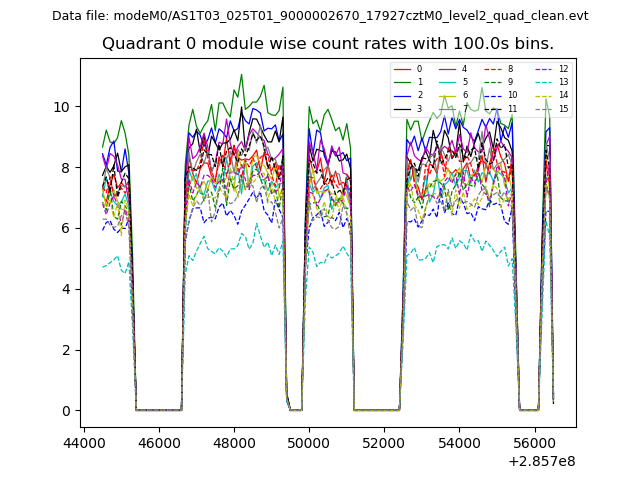 |
 |
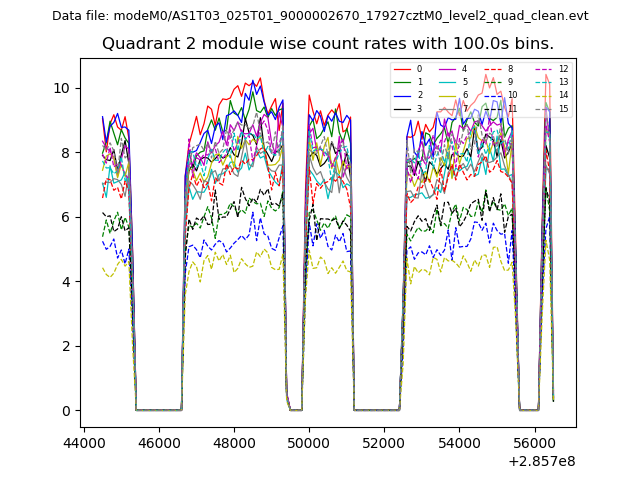
| Module-wise count rates for Quadrant B Data is divided into 100 sec bins |
 |
 |
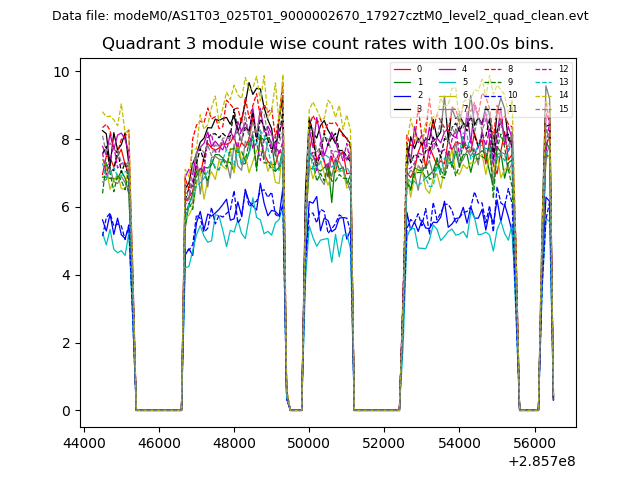
| Module-wise count rates for Quadrant C Data is divided into 100 sec bins |
 |
 |
| Module-wise count rates for Quadrant D Data is divided into 100 sec bins |
 |
 |
| Parameter | Plot |
|---|---|
| CZT HV Monitor | 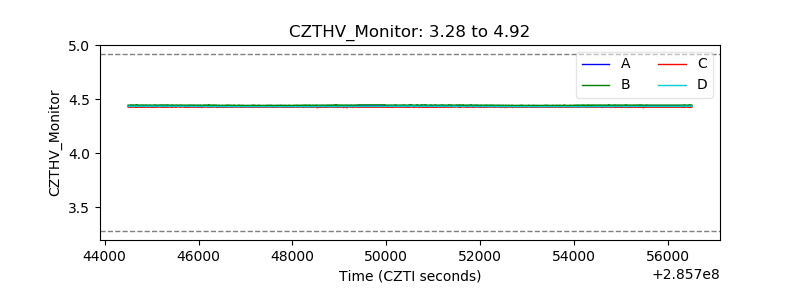 |
| D_VDD | 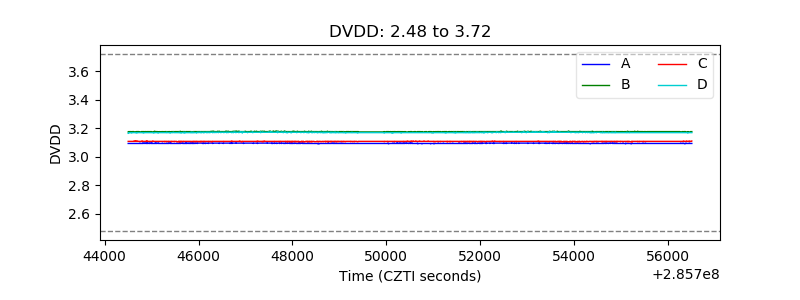 |
| Temperature 1 | 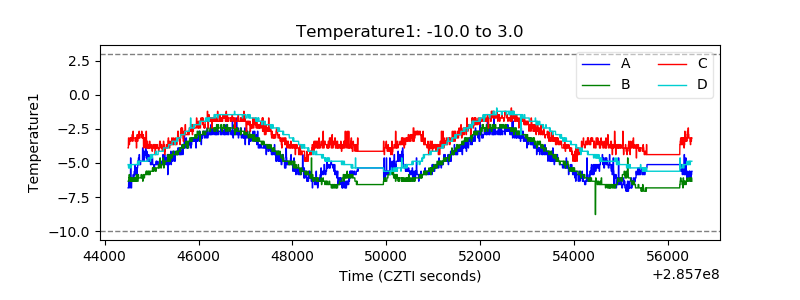 |
| Veto HV Monitor |  |
| Veto LLD | 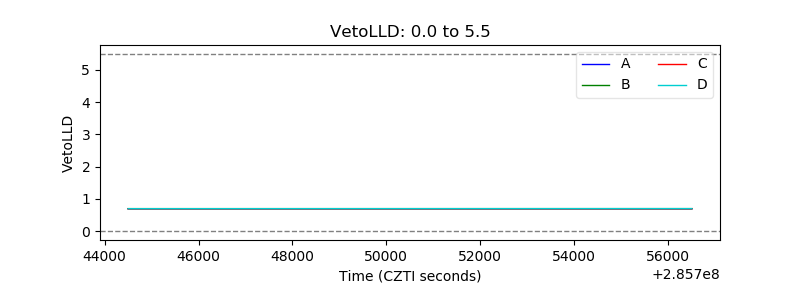 |
| Alpha Counter | 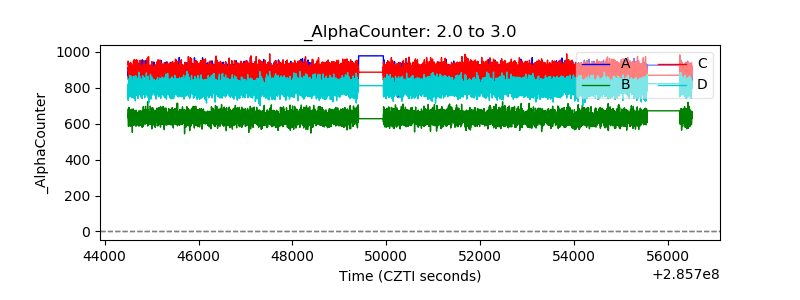 |
| _CPM_Rate | 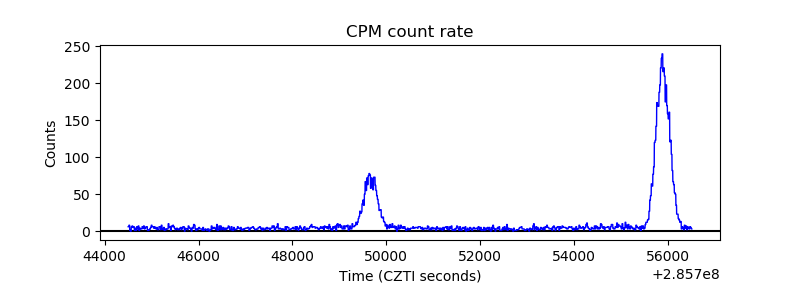 |
| CZT Counter | 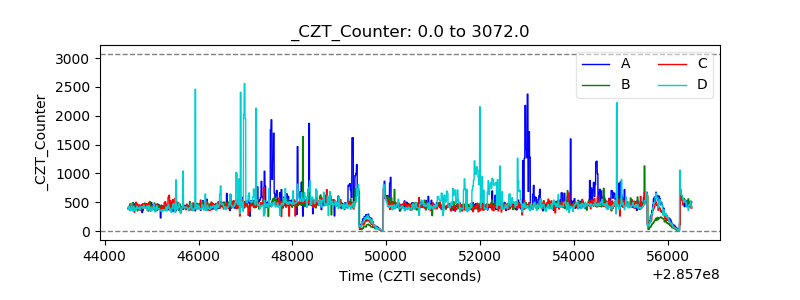 |
| +2.5 Volts monitor |  |
| +5 Volts monitor |  |
| _ROLL_ROT | 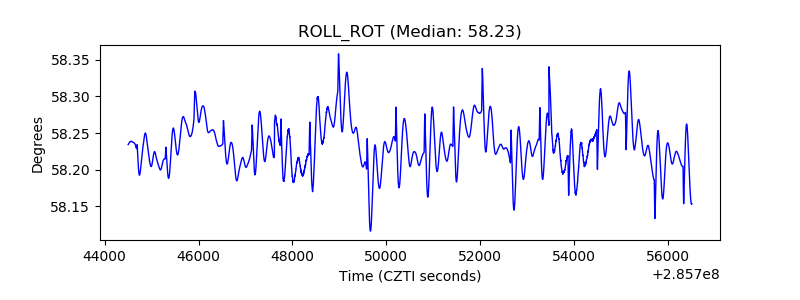 |
| _Roll_DEC | 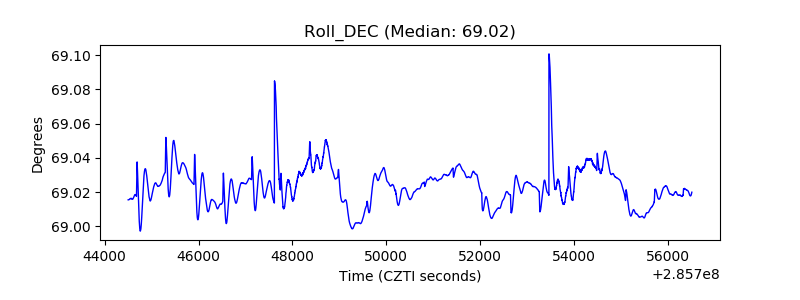 |
| _Roll_RA | 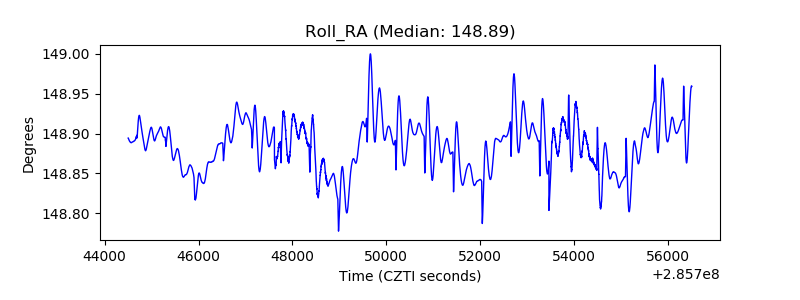 |
| Veto Counter | 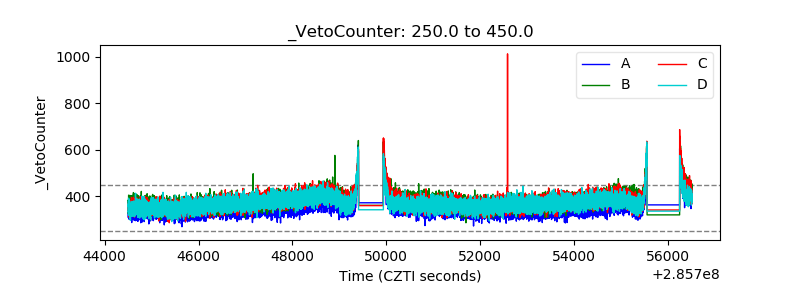 |