| Param | Original file | Final file |
|---|---|---|
| Filename | modeM0/AS1T03_025T01_9000002670_17928cztM0_level2.evt | modeM0/AS1T03_025T01_9000002670_17928cztM0_level2_quad_clean.evt |
| Size (bytes) | 494,838,720 | 90,100,800 |
| Size | 471.9 MB | 85.9 MB |
| Events in quadrant A | 3,368,502 | 567,451 |
| Events in quadrant B | 3,425,897 | 579,996 |
| Events in quadrant C | 3,334,071 | 546,250 |
| Events in quadrant D | 4,371,624 | 536,388 |
| Mode SS | |||
|---|---|---|---|
| Quadrant | BADHDUFLAG | Total packets | Discarded packets |
| A | 0 | 148 | 0 |
| B | 0 | 148 | 0 |
| C | 0 | 148 | 0 |
| D | 0 | 148 | 0 |
| Mode M0 | |||
|---|---|---|---|
| Quadrant | BADHDUFLAG | Total packets | Discarded packets |
| A | 0 | 14734 | 2 |
| B | 0 | 14676 | 2 |
| C | 0 | 14593 | 2 |
| D | 0 | 17967 | 2 |
| Mode M9 | |||
|---|---|---|---|
| Quadrant | BADHDUFLAG | Total packets | Discarded packets |
| A | 0 | 15 | 0 |
| B | 0 | 15 | 0 |
| C | 0 | 15 | 0 |
| D | 0 | 15 | 0 |
| Quadrant | Total seconds | Saturated seconds | Saturation percentage |
|---|---|---|---|
| A | 7153 | 98 | 1.370055% |
| B | 7153 | 99 | 1.384035% |
| C | 7154 | 110 | 1.537601% |
| D | 7154 | 181 | 2.530053% |
Noise dominated data is calculated using 1-second bins in cleaned event files. If a bin has >2000 counts, and if more than 50% of those come from <1% of pixels, then it is considered to be noise-dominated and hence unusable.
| Quadrant | # 1 sec bins | Bins with >0 counts | Bins with >2000 counts | High rate bins dominated by noise | Noise dominated (total time) | Noise dominated (detector-on time) | Marked lightcurve |
|---|---|---|---|---|---|---|---|
| A | 8688 | 7155 | 3 | 3 | 0.03% | 0.04% | 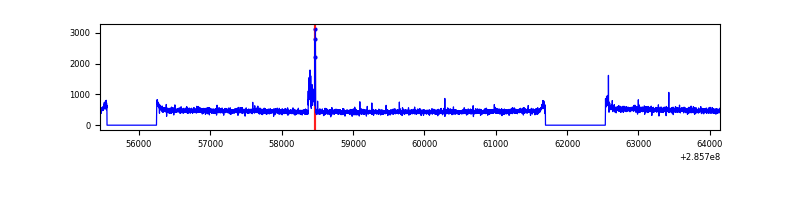 |
| B | 8688 | 7155 | 2 | 2 | 0.02% | 0.03% | 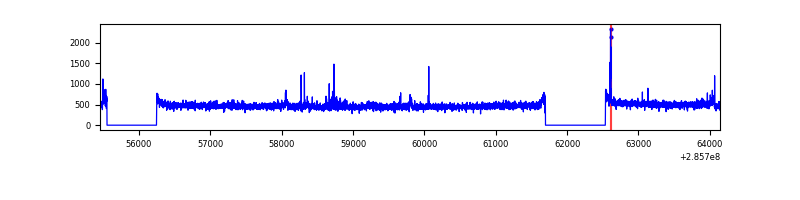 |
| C | 8689 | 7155 | 4 | 4 | 0.05% | 0.06% | 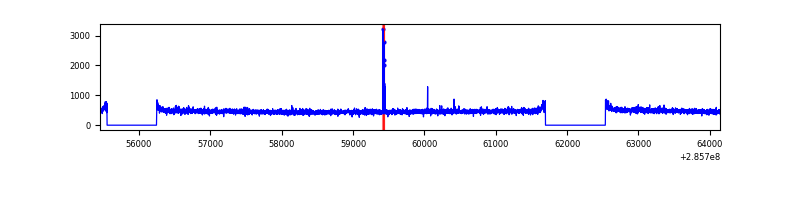 |
| D | 8689 | 7156 | 91 | 91 | 1.05% | 1.27% | 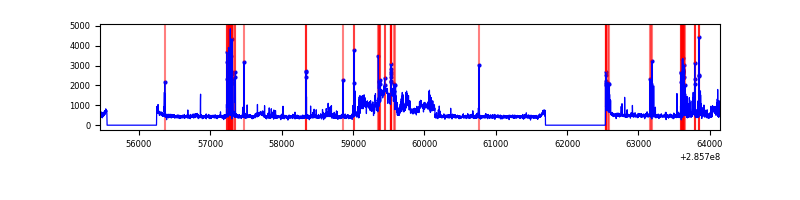 |
Top three noisy pixels from each quadrant. If the there are fewer than three noisy pixels in the level2.evt file, extra rows are filled as -1
| Pixel properties | Quadrant properties | ||||||
|---|---|---|---|---|---|---|---|
| Quadrant | DetID | PixID | Counts | Sigma | Mean | Median | Sigma |
| A | 15 | 174 | 72320 | 409.52 | 855 | 835 | 174.6 |
| A | 0 | 226 | 7329 | 37.2 | 855 | 835 | 174.6 |
| A | 3 | 137 | 6488 | 32.38 | 855 | 835 | 174.6 |
| B | 0 | 189 | 31085 | 183.31 | 854 | 833 | 165.0 |
| B | 12 | 111 | 20012 | 116.21 | 854 | 833 | 165.0 |
| B | 11 | 111 | 17299 | 99.77 | 854 | 833 | 165.0 |
| C | 14 | 238 | 126018 | 659.32 | 810 | 811 | 189.9 |
| C | 3 | 233 | 18398 | 92.61 | 810 | 811 | 189.9 |
| C | 9 | 160 | 16807 | 84.23 | 810 | 811 | 189.9 |
| D | 7 | 238 | 1055708 | 5312.39 | 818 | 793 | 198.6 |
| D | 10 | 70 | 62527 | 310.88 | 818 | 793 | 198.6 |
| D | 7 | 223 | 55374 | 274.86 | 818 | 793 | 198.6 |
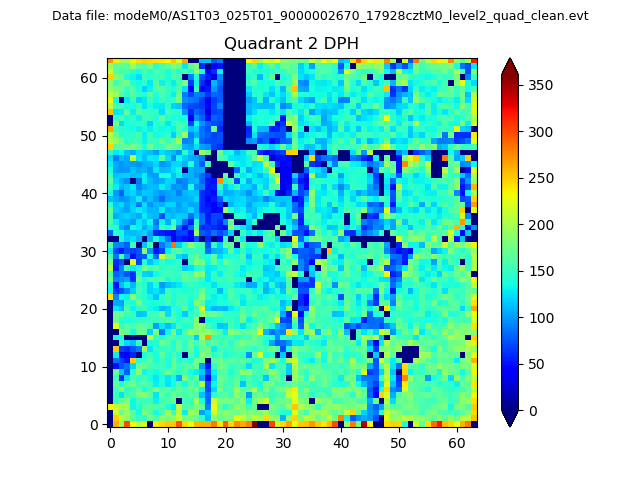
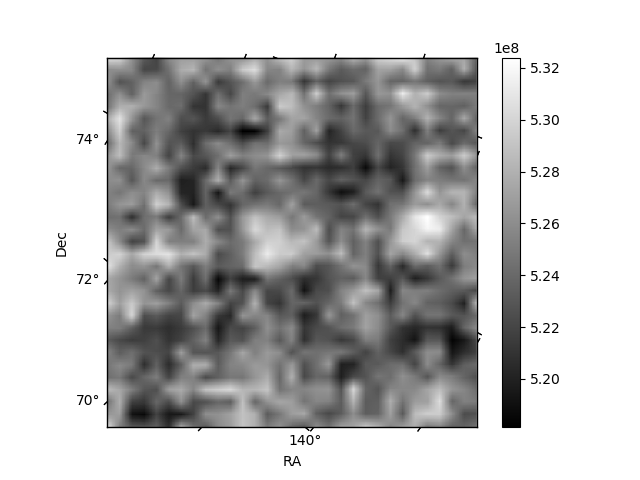
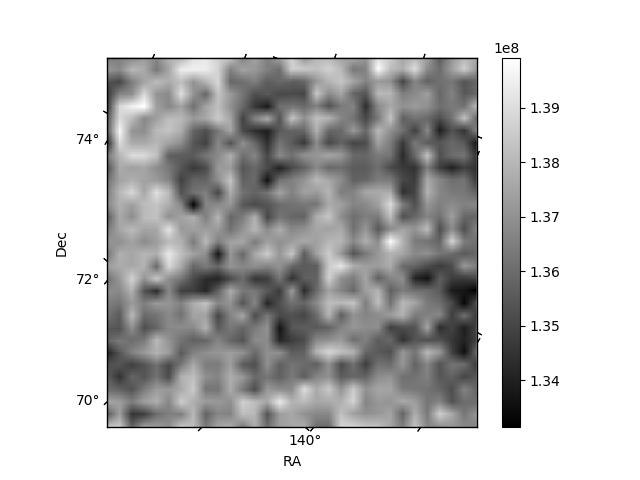
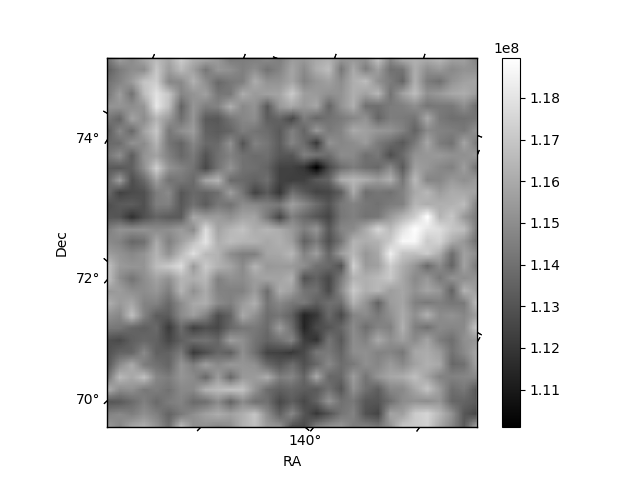
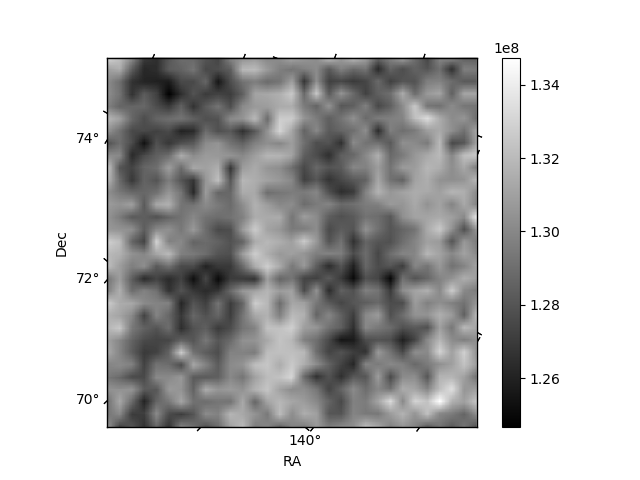
Histogram calculated using DETX and DETY for each event in the final _common_clean file
| Quadrant A | 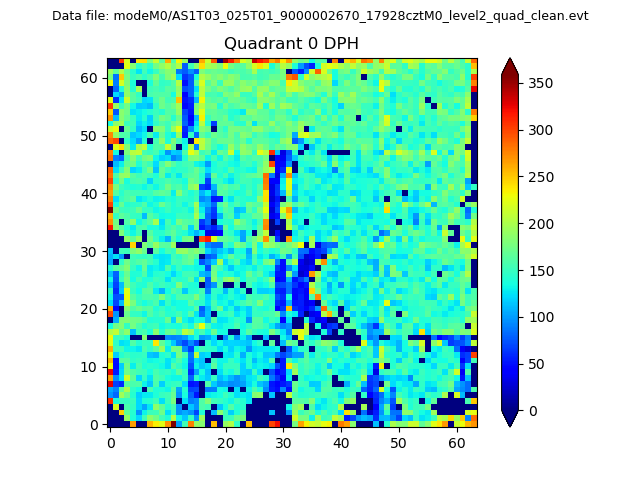 |
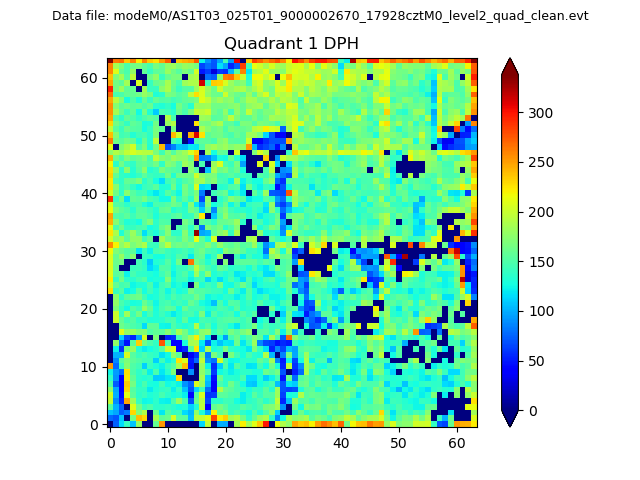 |
Quadrant B |
|---|---|---|---|
| Quadrant D | 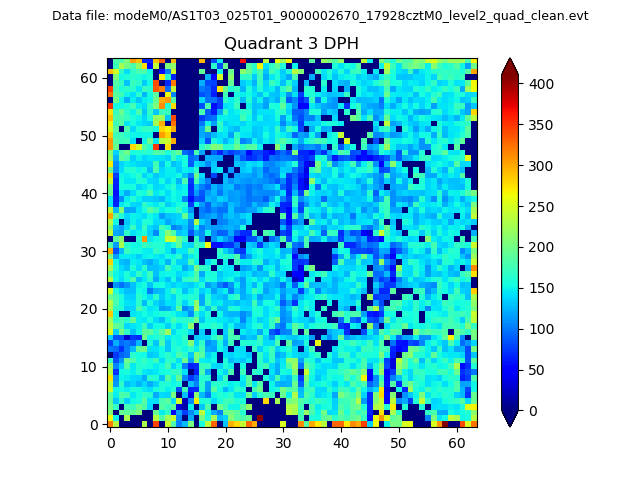 |
 |
Quadrant C |
| Plot type | Count rate plots | Images |
|---|---|---|
| Comparison with Poisson distribution Blue bars denote a histogram of data divided into 1 sec bins. Red curve is a Poisson curve with rate = median count rate of data. |
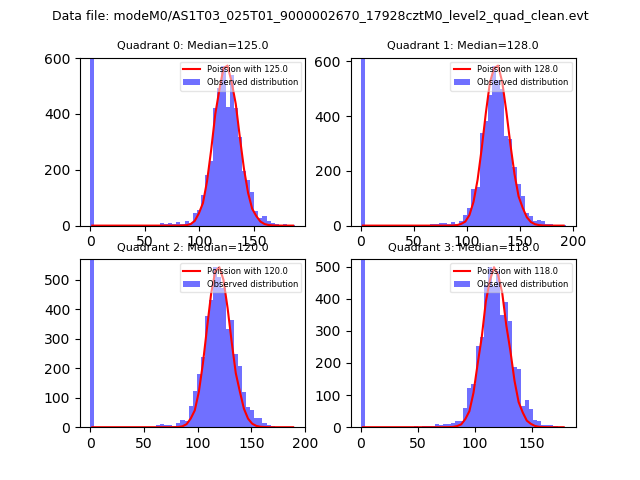 |
 |
| Quadrant-wise count rates Data is divided into 100 sec bins |
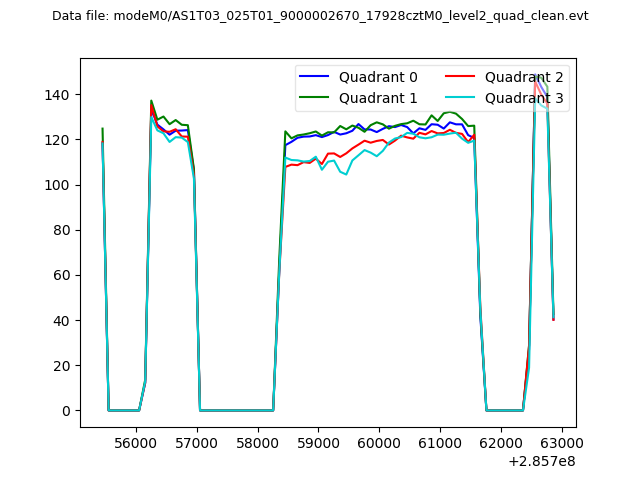 |
|
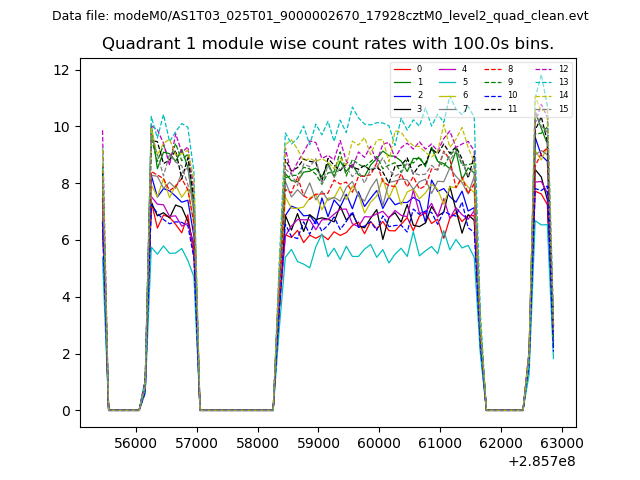
| Module-wise count rates for Quadrant A Data is divided into 100 sec bins |
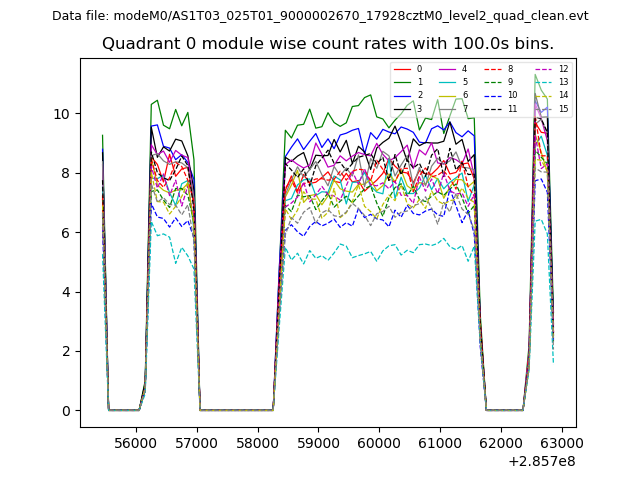 |
 |
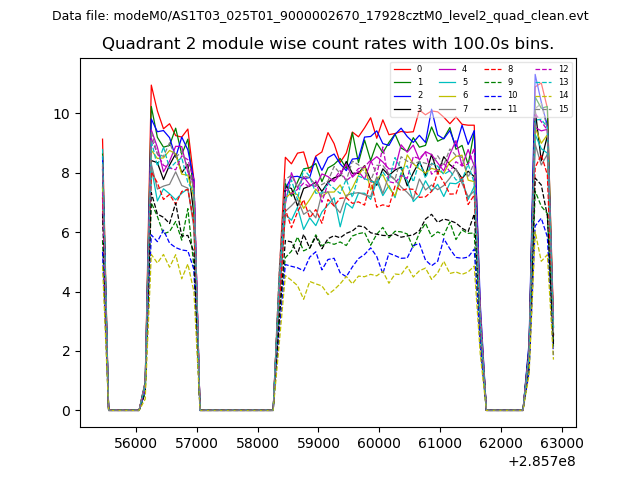
| Module-wise count rates for Quadrant B Data is divided into 100 sec bins |
 |
 |
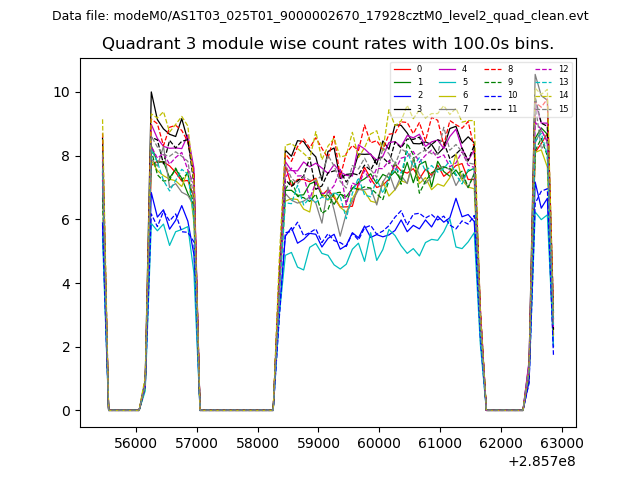
| Module-wise count rates for Quadrant C Data is divided into 100 sec bins |
 |
 |
| Module-wise count rates for Quadrant D Data is divided into 100 sec bins |
 |
 |
| Parameter | Plot |
|---|---|
| CZT HV Monitor | 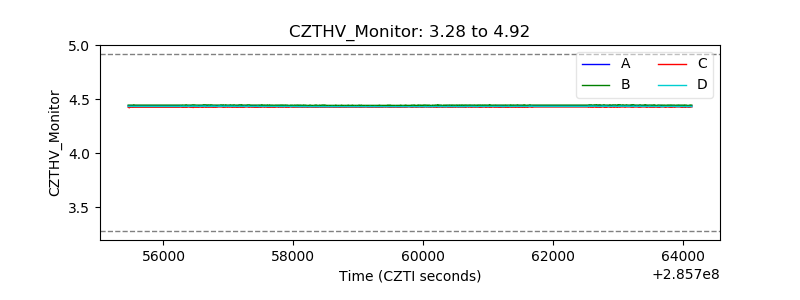 |
| D_VDD | 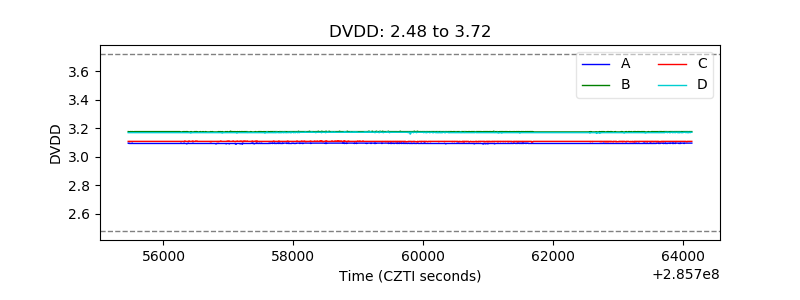 |
| Temperature 1 | 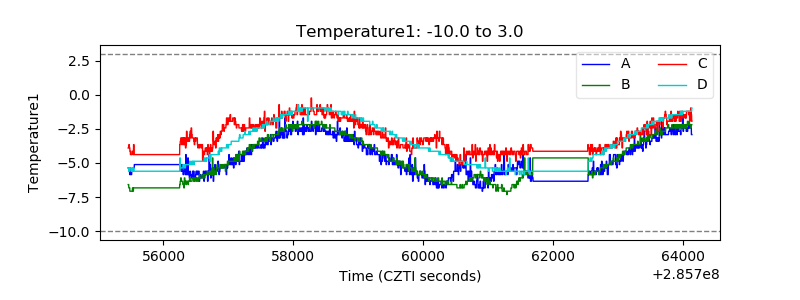 |
| Veto HV Monitor | 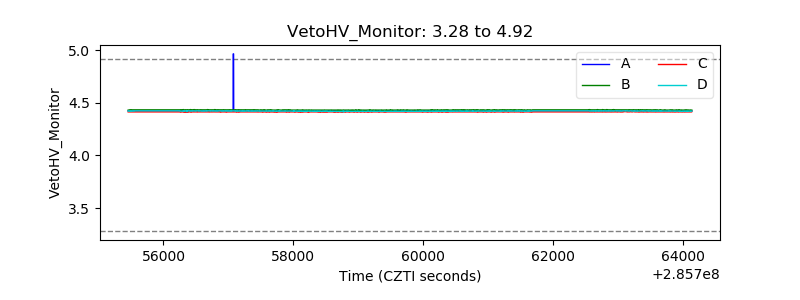 |
| Veto LLD | 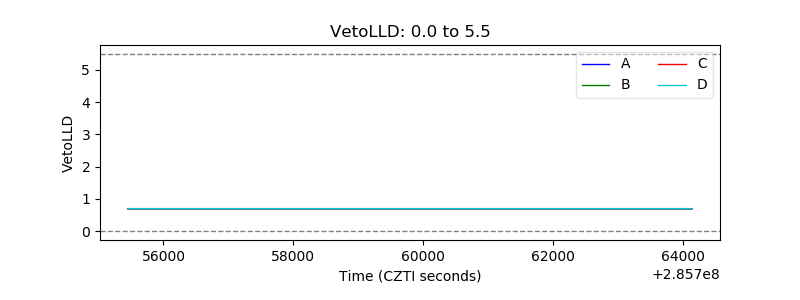 |
| Alpha Counter | 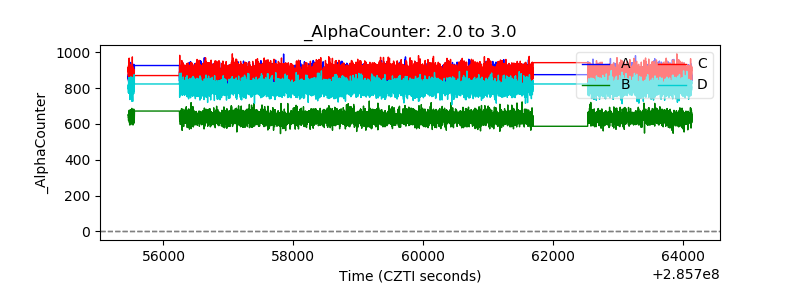 |
| _CPM_Rate | 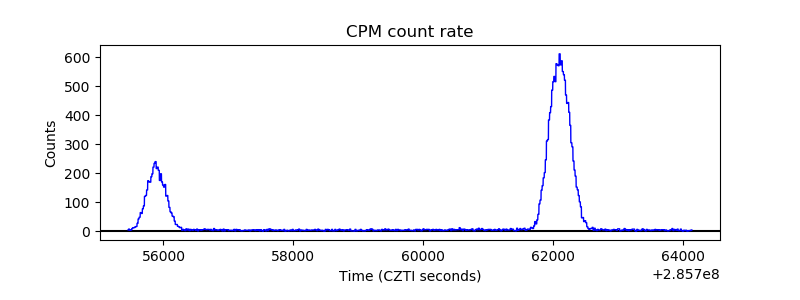 |
| CZT Counter | 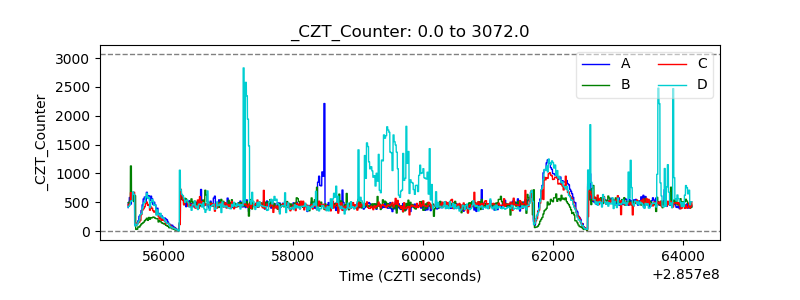 |
| +2.5 Volts monitor |  |
| +5 Volts monitor |  |
| _ROLL_ROT | 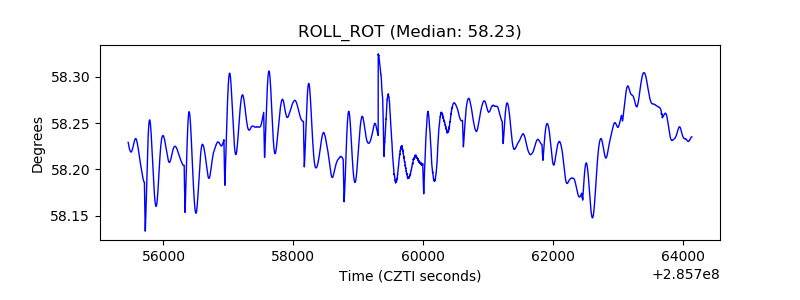 |
| _Roll_DEC | 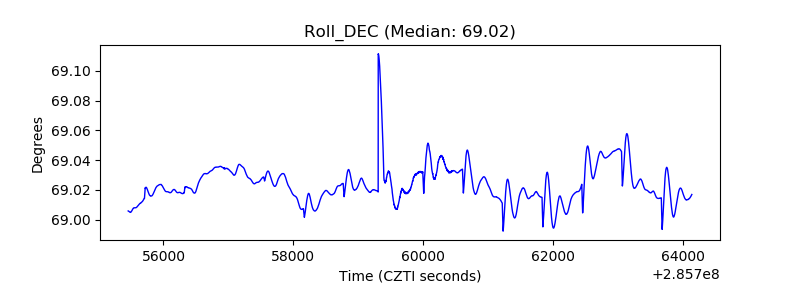 |
| _Roll_RA | 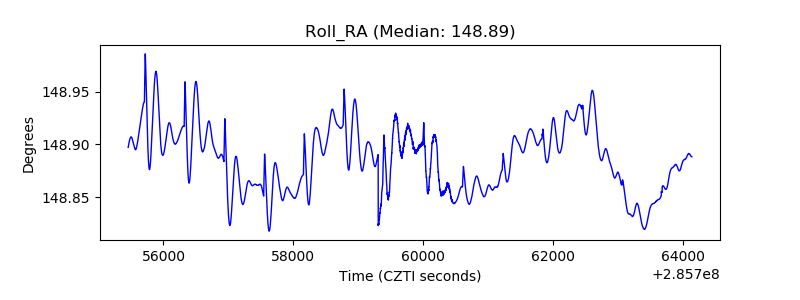 |
| Veto Counter | 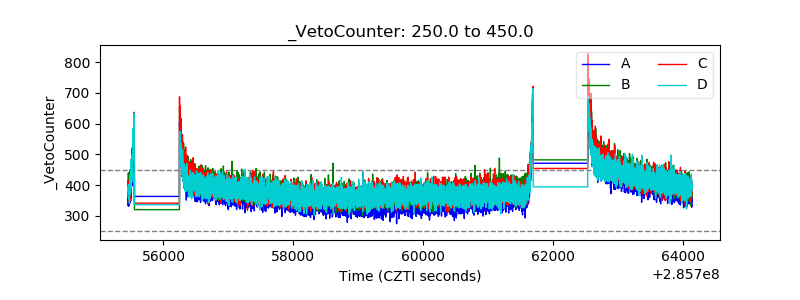 |