| Param | Original file | Final file |
|---|---|---|
| Filename | modeM0/AS1T03_025T01_9000002670_17929cztM0_level2.evt | modeM0/AS1T03_025T01_9000002670_17929cztM0_level2_quad_clean.evt |
| Size (bytes) | 469,402,560 | 82,088,640 |
| Size | 447.7 MB | 78.3 MB |
| Events in quadrant A | 3,156,505 | 517,106 |
| Events in quadrant B | 3,283,643 | 524,687 |
| Events in quadrant C | 3,171,876 | 492,982 |
| Events in quadrant D | 4,148,241 | 483,443 |
| Mode SS | |||
|---|---|---|---|
| Quadrant | BADHDUFLAG | Total packets | Discarded packets |
| A | 0 | 136 | 0 |
| B | 0 | 136 | 0 |
| C | 0 | 136 | 0 |
| D | 0 | 136 | 0 |
| Mode M0 | |||
|---|---|---|---|
| Quadrant | BADHDUFLAG | Total packets | Discarded packets |
| A | 0 | 13773 | 1 |
| B | 0 | 13990 | 1 |
| C | 0 | 13727 | 1 |
| D | 0 | 16765 | 1 |
| Mode M9 | |||
|---|---|---|---|
| Quadrant | BADHDUFLAG | Total packets | Discarded packets |
| A | 0 | 10 | 0 |
| B | 0 | 10 | 0 |
| C | 0 | 10 | 0 |
| D | 0 | 10 | 0 |
| Quadrant | Total seconds | Saturated seconds | Saturation percentage |
|---|---|---|---|
| A | 6706 | 70 | 1.043841% |
| B | 6707 | 66 | 0.984047% |
| C | 6707 | 76 | 1.133144% |
| D | 6707 | 178 | 2.653944% |
Noise dominated data is calculated using 1-second bins in cleaned event files. If a bin has >2000 counts, and if more than 50% of those come from <1% of pixels, then it is considered to be noise-dominated and hence unusable.
| Quadrant | # 1 sec bins | Bins with >0 counts | Bins with >2000 counts | High rate bins dominated by noise | Noise dominated (total time) | Noise dominated (detector-on time) | Marked lightcurve |
|---|---|---|---|---|---|---|---|
| A | 7716 | 6706 | 4 | 4 | 0.05% | 0.06% | 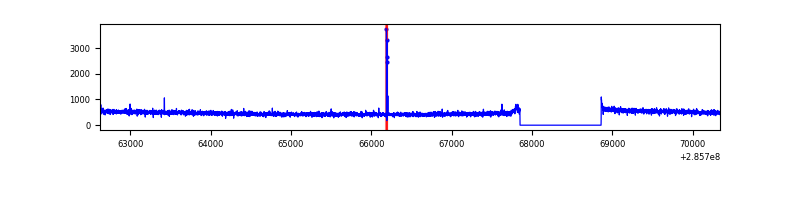 |
| B | 7717 | 6707 | 3 | 3 | 0.04% | 0.04% | 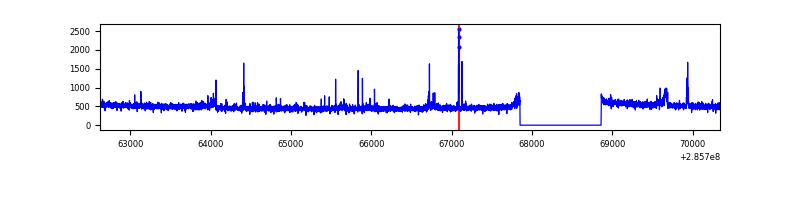 |
| C | 7717 | 6707 | 1 | 1 | 0.01% | 0.01% | 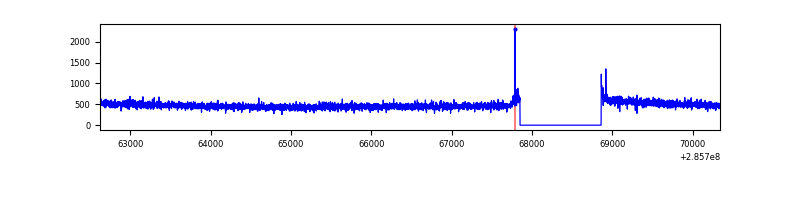 |
| D | 7717 | 6707 | 140 | 140 | 1.81% | 2.09% | 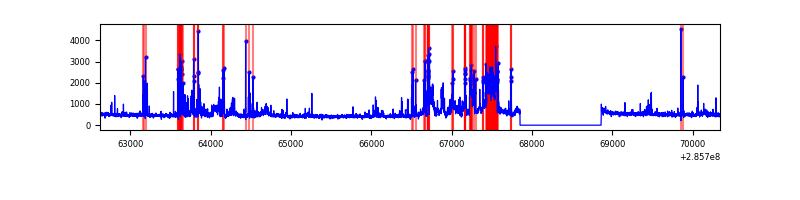 |
Top three noisy pixels from each quadrant. If the there are fewer than three noisy pixels in the level2.evt file, extra rows are filled as -1
| Pixel properties | Quadrant properties | ||||||
|---|---|---|---|---|---|---|---|
| Quadrant | DetID | PixID | Counts | Sigma | Mean | Median | Sigma |
| A | 15 | 174 | 15173 | 87.1 | 816 | 797 | 165.1 |
| A | 0 | 226 | 6960 | 37.34 | 816 | 797 | 165.1 |
| A | 3 | 137 | 6055 | 31.85 | 816 | 797 | 165.1 |
| B | 0 | 189 | 39673 | 249.39 | 813 | 793 | 155.9 |
| B | 15 | 222 | 25193 | 156.51 | 813 | 793 | 155.9 |
| B | 12 | 111 | 18302 | 112.31 | 813 | 793 | 155.9 |
| C | 14 | 238 | 121390 | 662.98 | 776 | 778 | 181.9 |
| C | 3 | 233 | 12179 | 62.67 | 776 | 778 | 181.9 |
| C | 9 | 160 | 7409 | 36.45 | 776 | 778 | 181.9 |
| D | 7 | 238 | 964524 | 5057.99 | 784 | 760 | 190.5 |
| D | 10 | 70 | 77575 | 403.14 | 784 | 760 | 190.5 |
| D | 2 | 14 | 53350 | 276.0 | 784 | 760 | 190.5 |
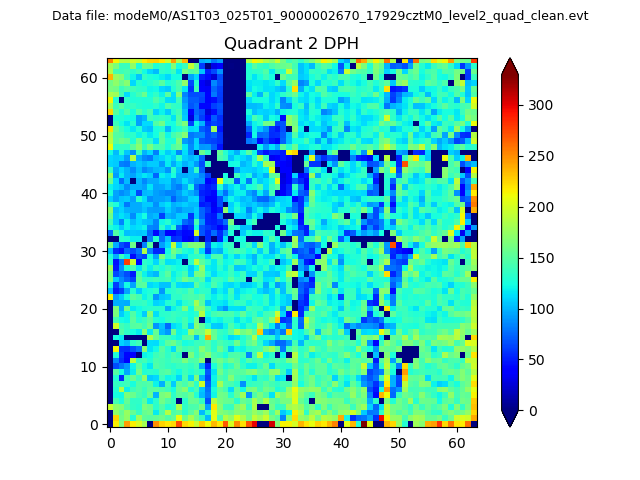
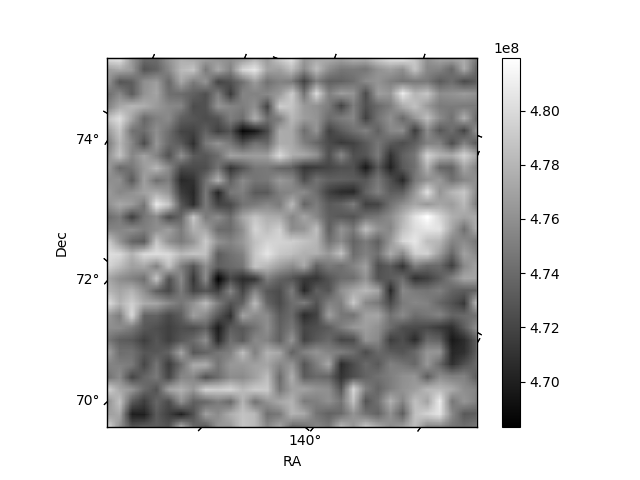
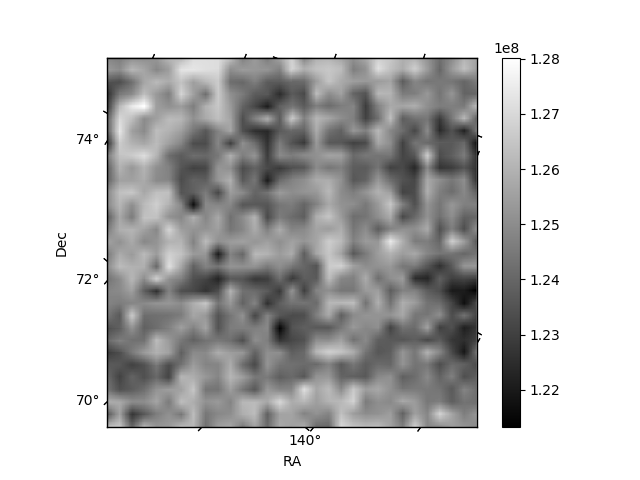
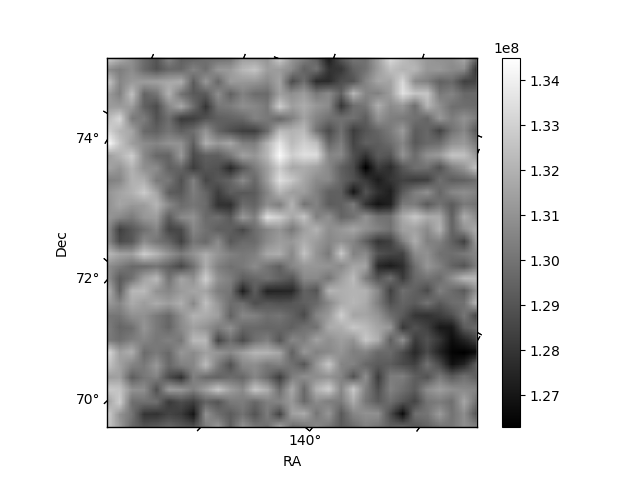
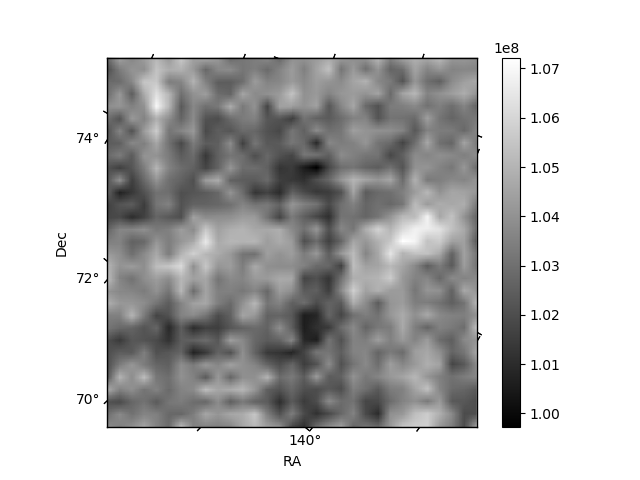
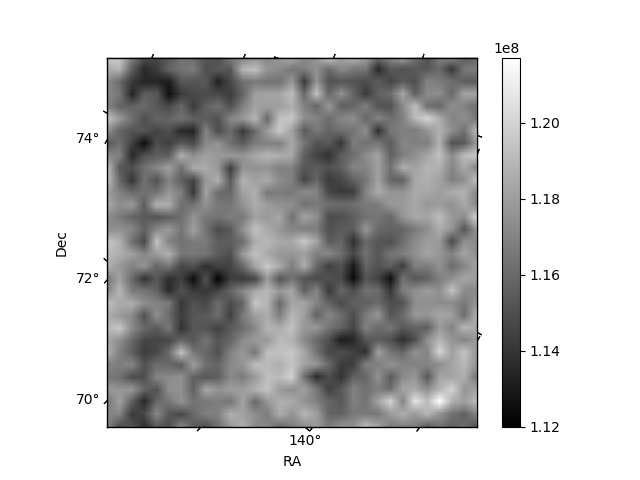
Histogram calculated using DETX and DETY for each event in the final _common_clean file
| Quadrant A | 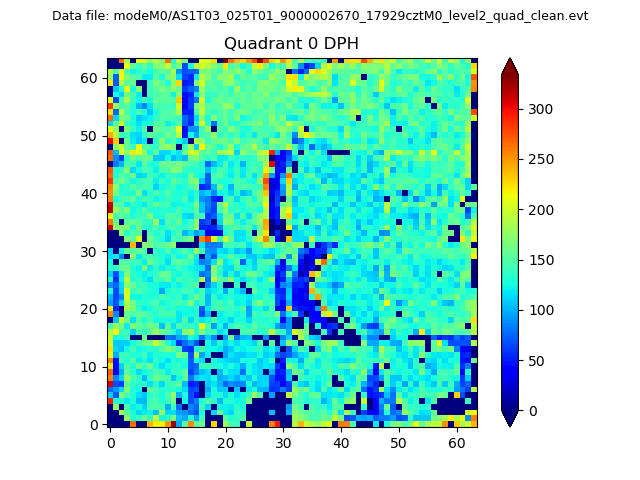 |
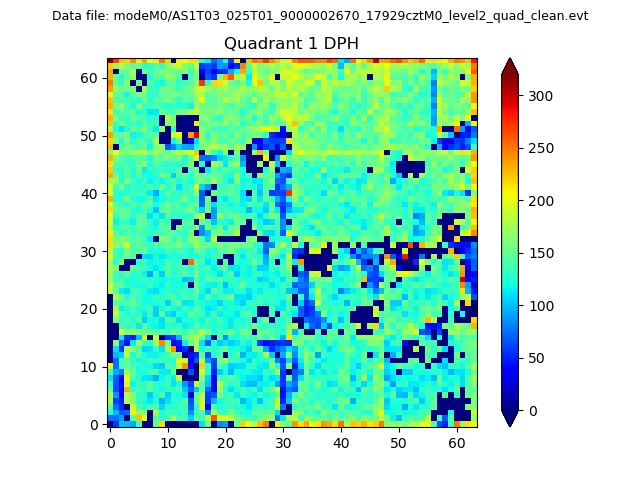 |
Quadrant B |
|---|---|---|---|
| Quadrant D | 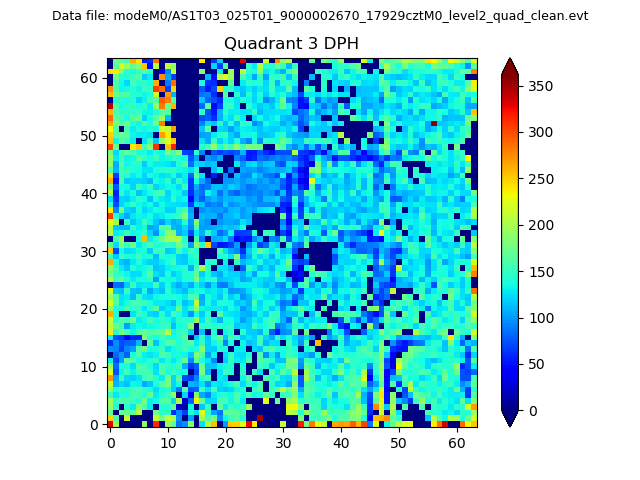 |
 |
Quadrant C |
| Plot type | Count rate plots | Images |
|---|---|---|
| Comparison with Poisson distribution Blue bars denote a histogram of data divided into 1 sec bins. Red curve is a Poisson curve with rate = median count rate of data. |
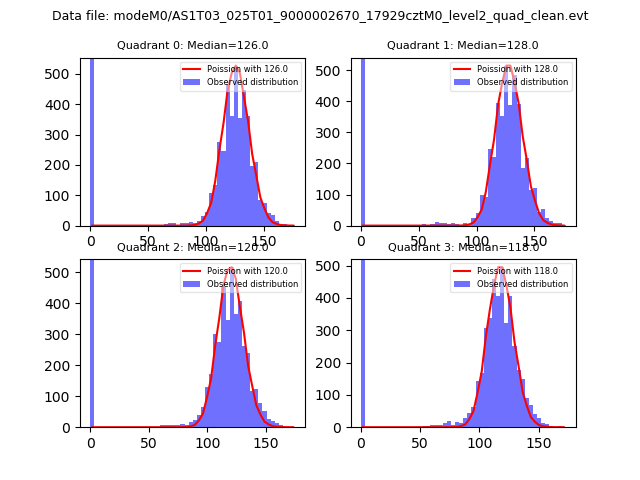 |
 |
| Quadrant-wise count rates Data is divided into 100 sec bins |
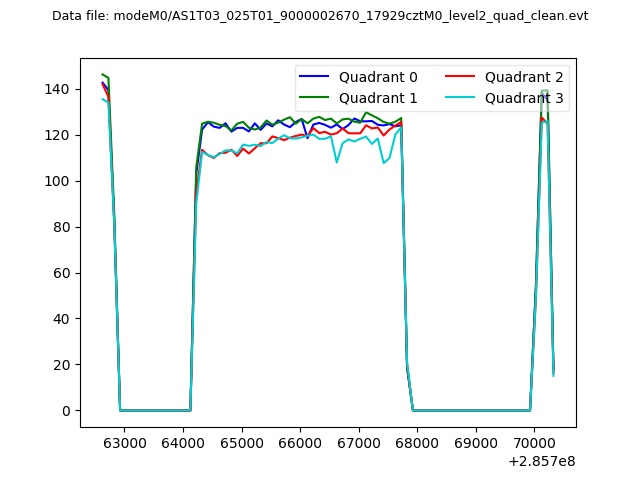 |
|
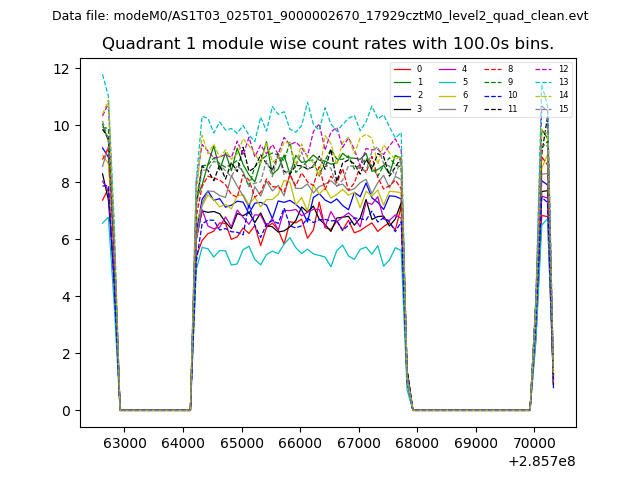
| Module-wise count rates for Quadrant A Data is divided into 100 sec bins |
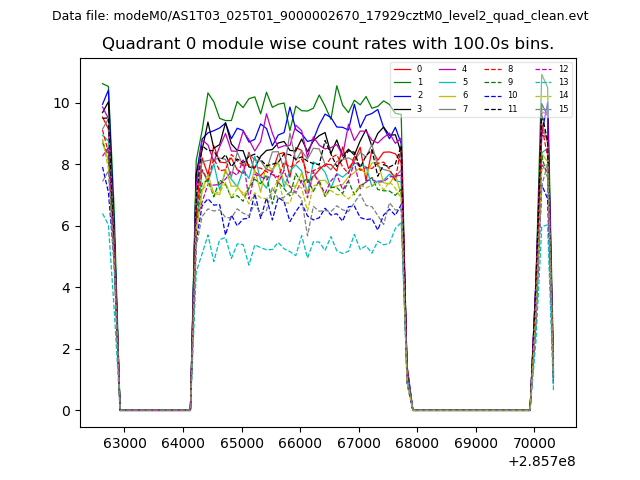 |
 |
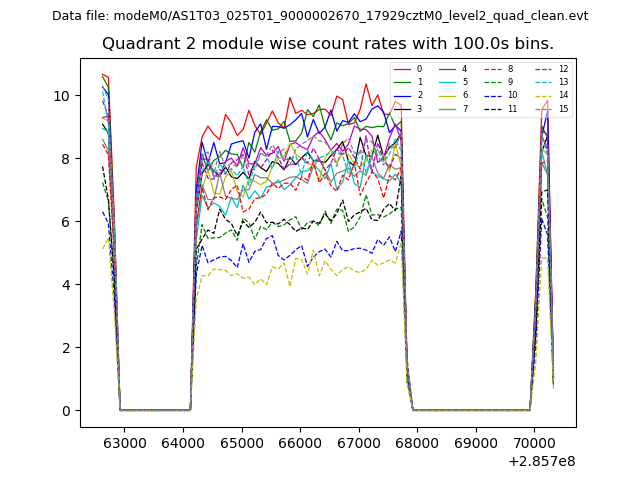
| Module-wise count rates for Quadrant B Data is divided into 100 sec bins |
 |
 |
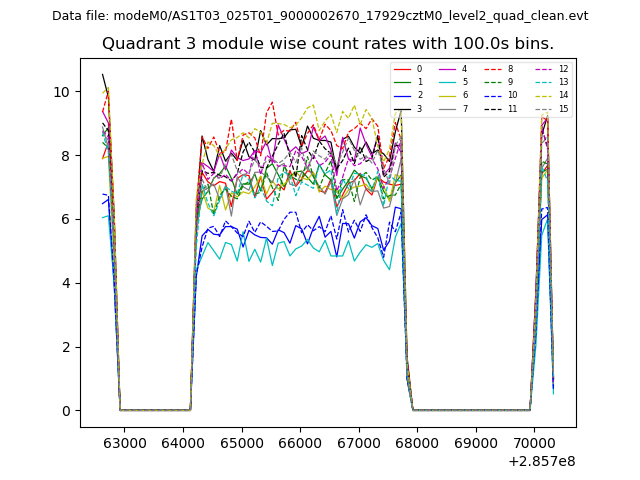
| Module-wise count rates for Quadrant C Data is divided into 100 sec bins |
 |
 |
| Module-wise count rates for Quadrant D Data is divided into 100 sec bins |
 |
 |
| Parameter | Plot |
|---|---|
| CZT HV Monitor | 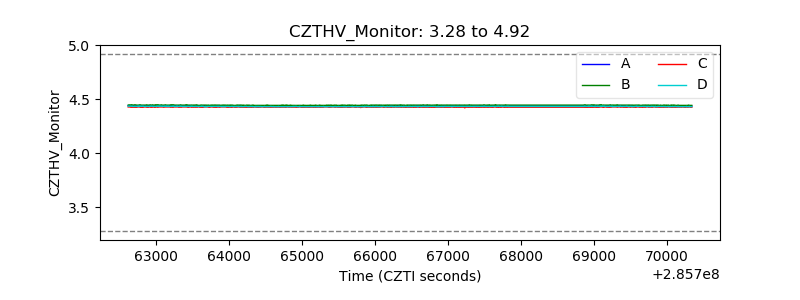 |
| D_VDD | 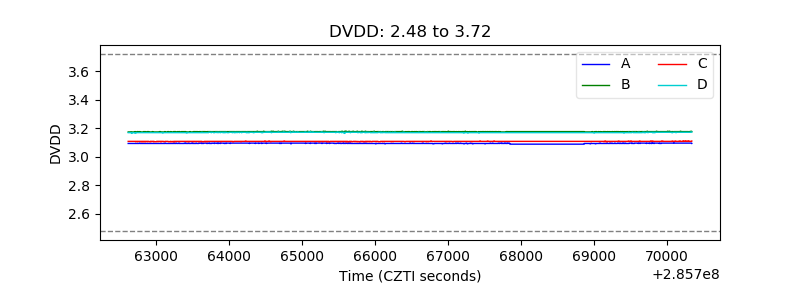 |
| Temperature 1 | 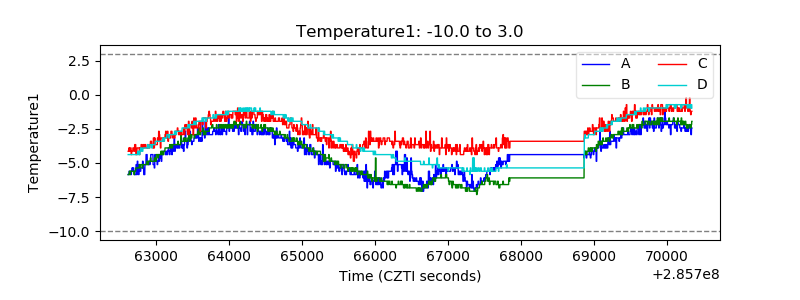 |
| Veto HV Monitor | 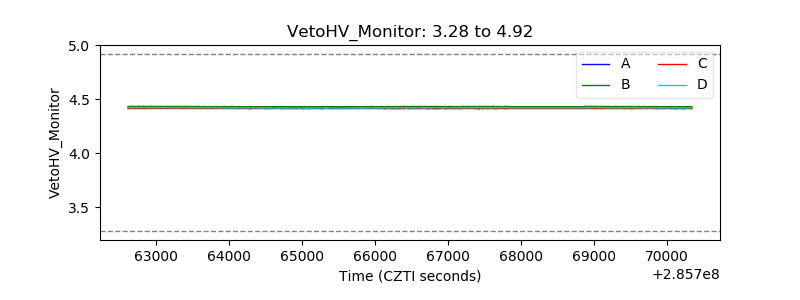 |
| Veto LLD | 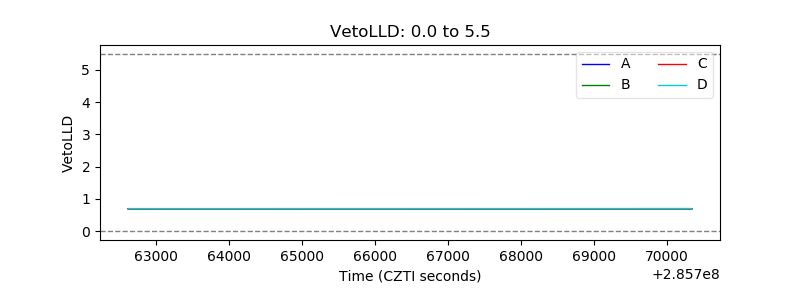 |
| Alpha Counter | 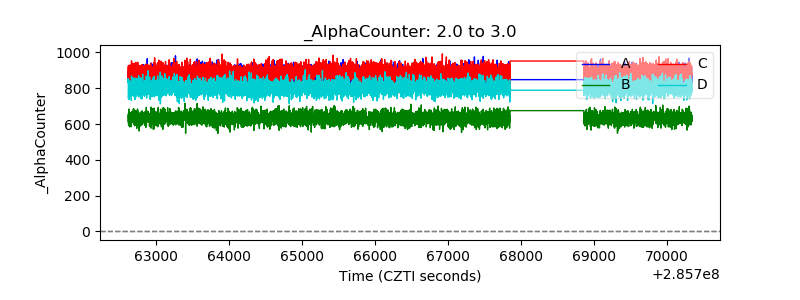 |
| _CPM_Rate | 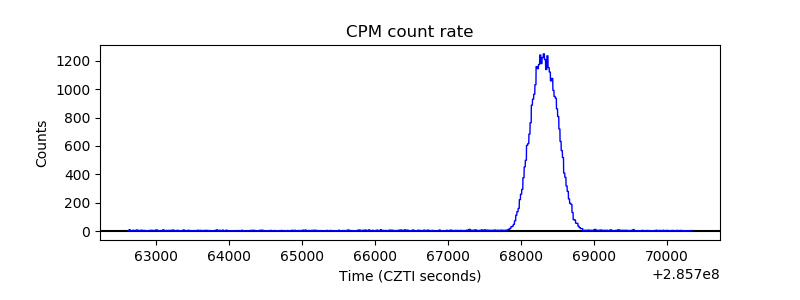 |
| CZT Counter | 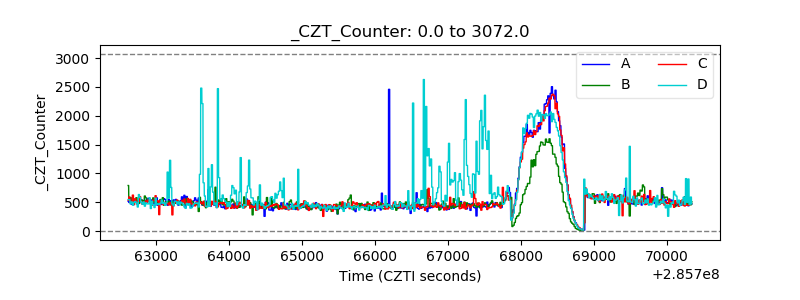 |
| +2.5 Volts monitor |  |
| +5 Volts monitor |  |
| _ROLL_ROT | 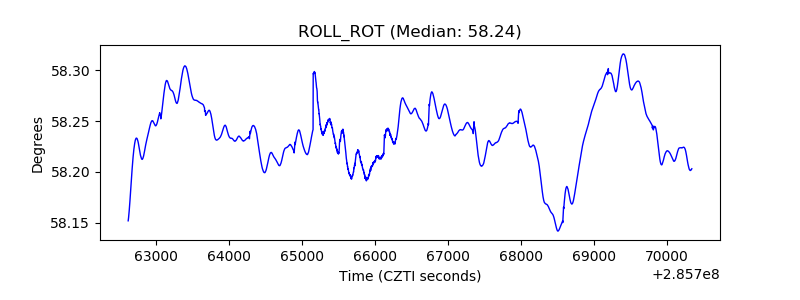 |
| _Roll_DEC | 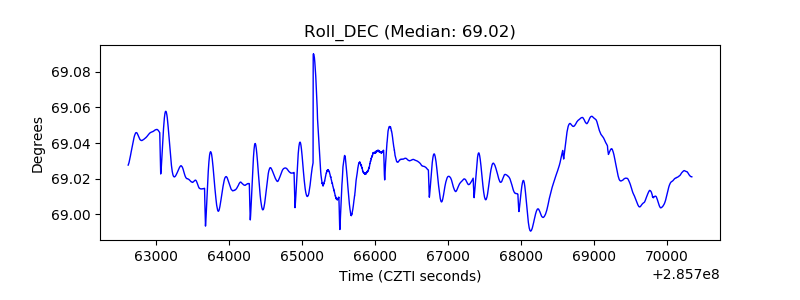 |
| _Roll_RA | 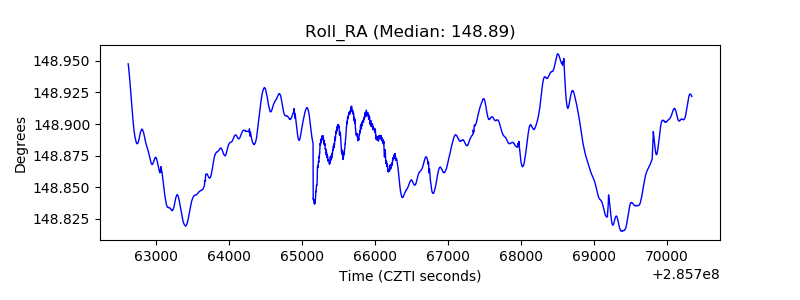 |
| Veto Counter | 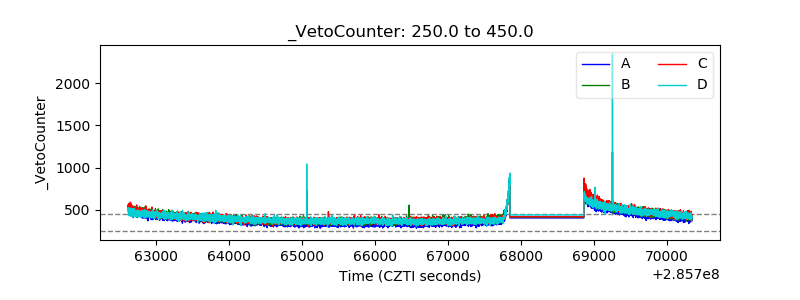 |