| Param | Original file | Final file |
|---|---|---|
| Filename | modeM0/AS1T03_025T01_9000002670_17932cztM0_level2.evt | modeM0/AS1T03_025T01_9000002670_17932cztM0_level2_quad_clean.evt |
| Size (bytes) | 473,532,480 | 107,573,760 |
| Size | 451.6 MB | 102.6 MB |
| Events in quadrant A | 3,194,326 | 717,852 |
| Events in quadrant B | 3,429,146 | 730,366 |
| Events in quadrant C | 3,318,049 | 693,952 |
| Events in quadrant D | 3,973,768 | 678,387 |
| Mode SS | |||
|---|---|---|---|
| Quadrant | BADHDUFLAG | Total packets | Discarded packets |
| A | 0 | 128 | 0 |
| B | 0 | 128 | 0 |
| C | 0 | 128 | 0 |
| D | 0 | 128 | 0 |
| Mode M0 | |||
|---|---|---|---|
| Quadrant | BADHDUFLAG | Total packets | Discarded packets |
| A | 0 | 13775 | 2 |
| B | 0 | 14483 | 3 |
| C | 0 | 14016 | 2 |
| D | 0 | 16138 | 2 |
| Mode M9 | |||
|---|---|---|---|
| Quadrant | BADHDUFLAG | Total packets | Discarded packets |
| A | 0 | 13 | 0 |
| B | 0 | 14 | 0 |
| C | 0 | 14 | 0 |
| D | 0 | 14 | 0 |
| Quadrant | Total seconds | Saturated seconds | Saturation percentage |
|---|---|---|---|
| A | 6267 | 77 | 1.228658% |
| B | 6266 | 113 | 1.803383% |
| C | 6266 | 126 | 2.010852% |
| D | 6266 | 156 | 2.489627% |
Noise dominated data is calculated using 1-second bins in cleaned event files. If a bin has >2000 counts, and if more than 50% of those come from <1% of pixels, then it is considered to be noise-dominated and hence unusable.
| Quadrant | # 1 sec bins | Bins with >0 counts | Bins with >2000 counts | High rate bins dominated by noise | Noise dominated (total time) | Noise dominated (detector-on time) | Marked lightcurve |
|---|---|---|---|---|---|---|---|
| A | 7507 | 6267 | 4 | 4 | 0.05% | 0.06% |  |
| B | 7506 | 6267 | 25 | 25 | 0.33% | 0.40% |  |
| C | 7506 | 6266 | 5 | 5 | 0.07% | 0.08% |  |
| D | 7506 | 6267 | 94 | 94 | 1.25% | 1.50% |  |
Top three noisy pixels from each quadrant. If the there are fewer than three noisy pixels in the level2.evt file, extra rows are filled as -1
| Pixel properties | Quadrant properties | ||||||
|---|---|---|---|---|---|---|---|
| Quadrant | DetID | PixID | Counts | Sigma | Mean | Median | Sigma |
| A | 4 | 2 | 32236 | 192.93 | 821 | 804 | 162.9 |
| A | 0 | 226 | 7333 | 40.08 | 821 | 804 | 162.9 |
| A | 12 | 194 | 6078 | 32.37 | 821 | 804 | 162.9 |
| B | 7 | 220 | 67001 | 437.04 | 819 | 800 | 151.5 |
| B | 4 | 48 | 43486 | 281.8 | 819 | 800 | 151.5 |
| B | 0 | 197 | 32662 | 210.34 | 819 | 800 | 151.5 |
| C | 14 | 238 | 124107 | 674.48 | 795 | 800 | 182.8 |
| C | 3 | 233 | 41301 | 221.54 | 795 | 800 | 182.8 |
| C | 9 | 54 | 21550 | 113.5 | 795 | 800 | 182.8 |
| D | 7 | 238 | 645445 | 3375.88 | 802 | 779 | 191.0 |
| D | 15 | 0 | 85516 | 443.74 | 802 | 779 | 191.0 |
| D | 10 | 70 | 42050 | 216.12 | 802 | 779 | 191.0 |
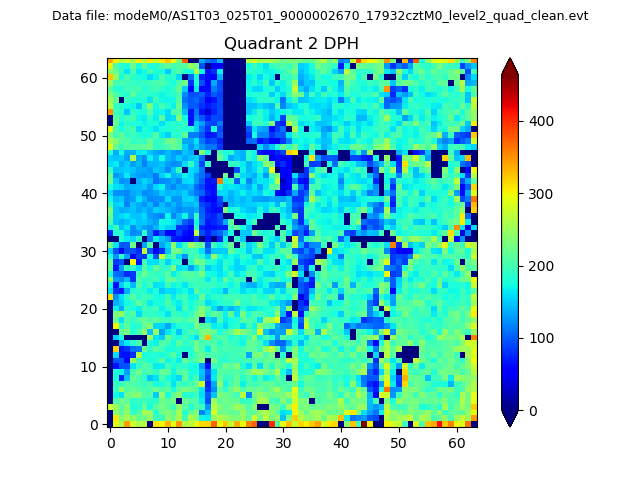
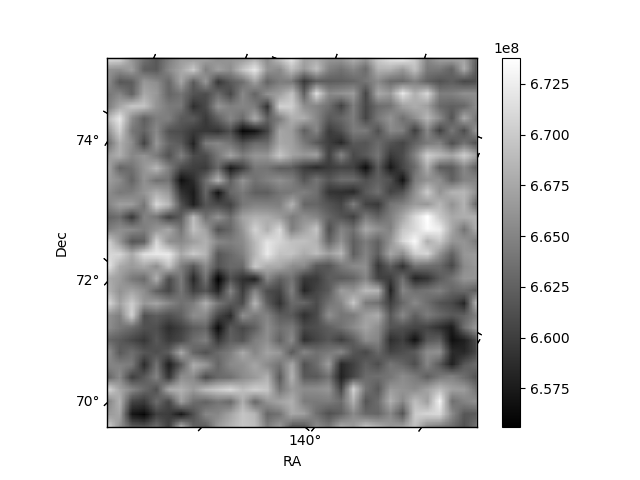
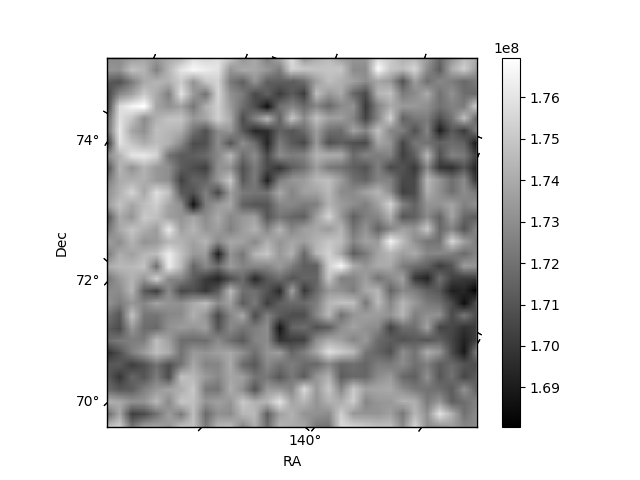
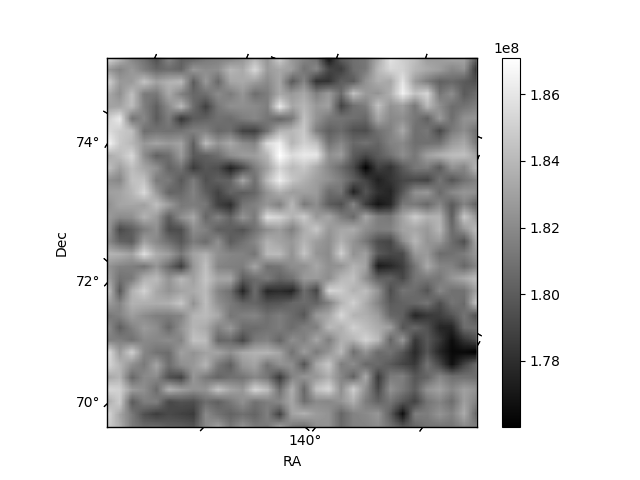
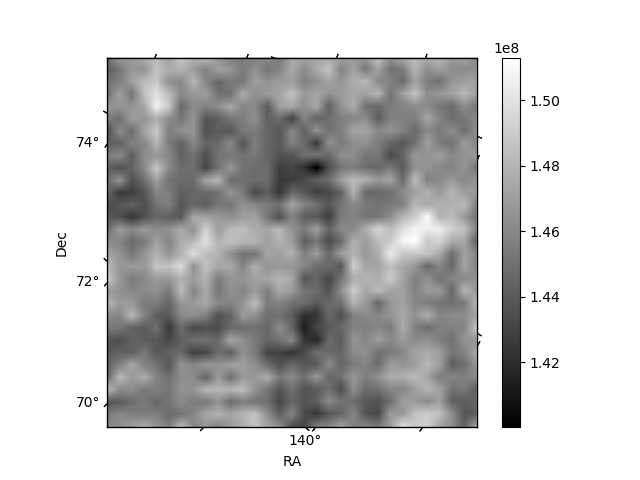
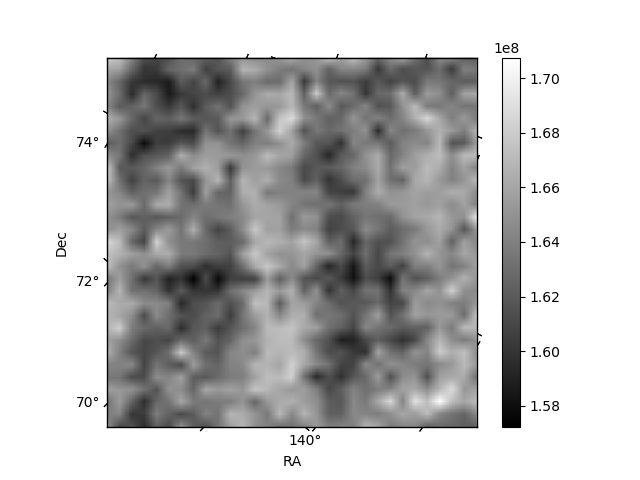
Histogram calculated using DETX and DETY for each event in the final _common_clean file
| Quadrant A | 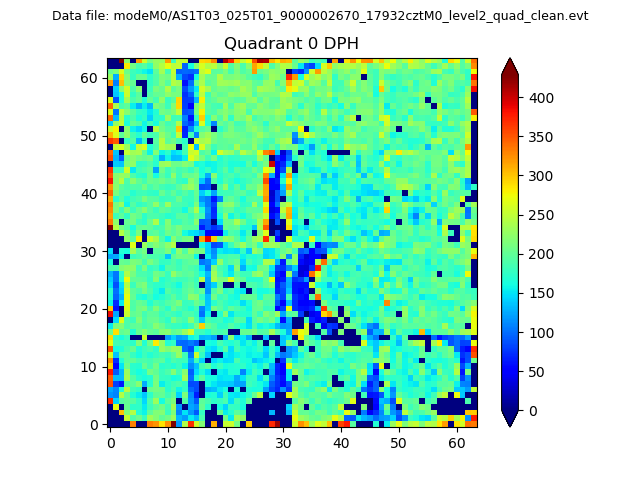 |
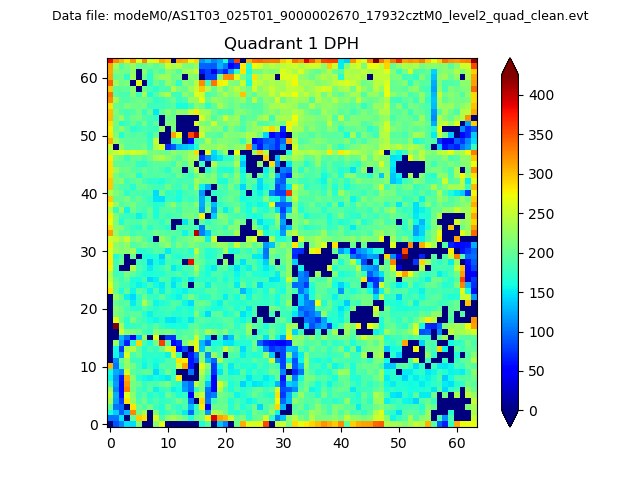 |
Quadrant B |
|---|---|---|---|
| Quadrant D | 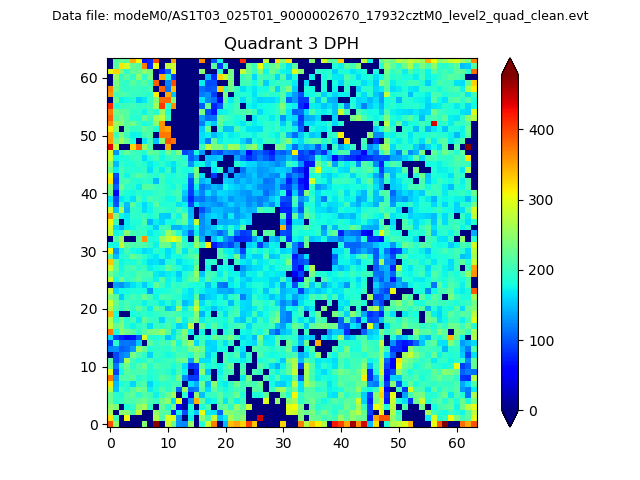 |
 |
Quadrant C |
| Plot type | Count rate plots | Images |
|---|---|---|
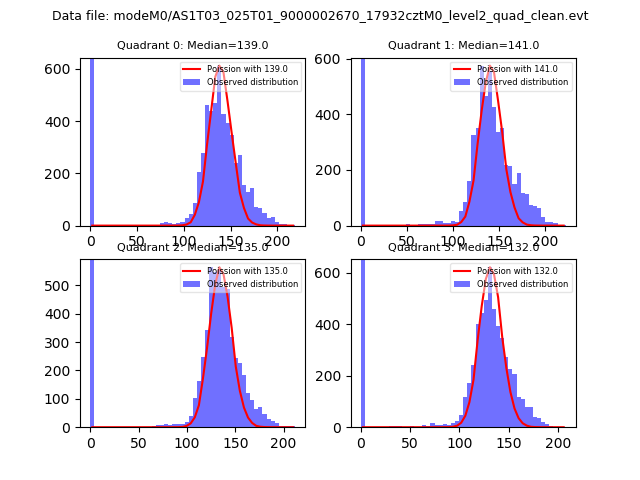
| Comparison with Poisson distribution Blue bars denote a histogram of data divided into 1 sec bins. Red curve is a Poisson curve with rate = median count rate of data. |
 |
 |
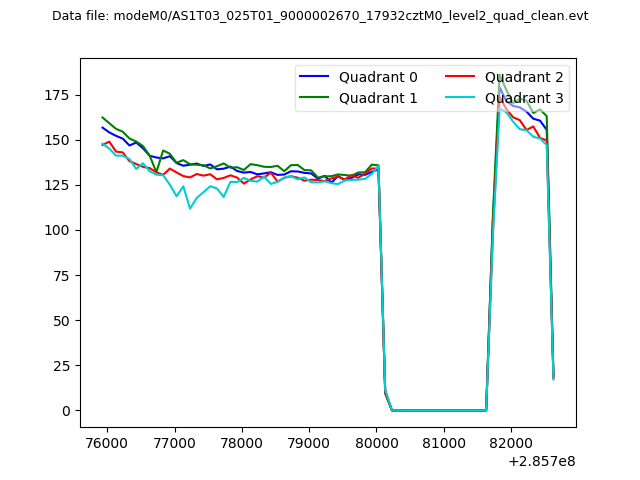
| Quadrant-wise count rates Data is divided into 100 sec bins |
 |
|
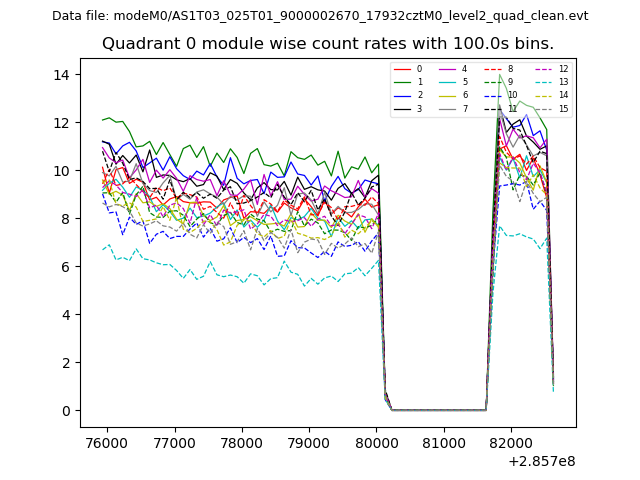
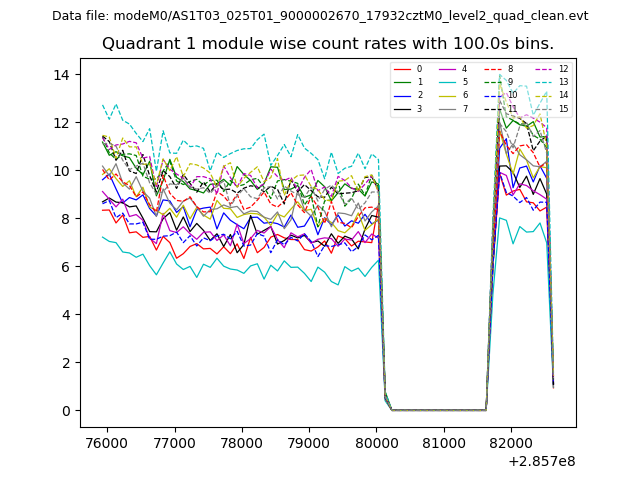
| Module-wise count rates for Quadrant A Data is divided into 100 sec bins |
 |
 |
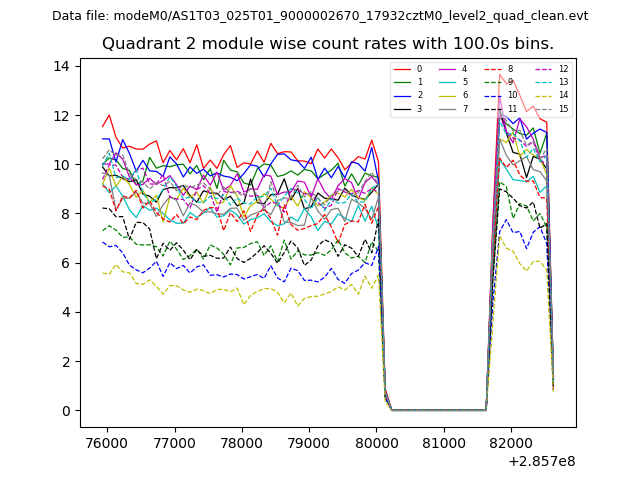
| Module-wise count rates for Quadrant B Data is divided into 100 sec bins |
 |
 |
| Module-wise count rates for Quadrant C Data is divided into 100 sec bins |
 |
 |
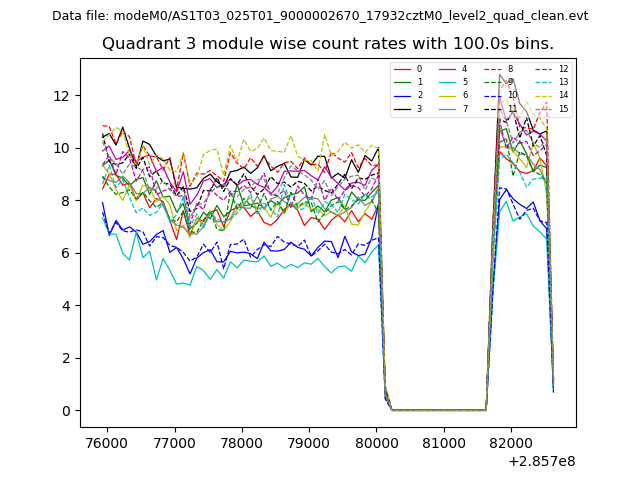
| Module-wise count rates for Quadrant D Data is divided into 100 sec bins |
 |
 |
| Parameter | Plot |
|---|---|
| CZT HV Monitor | 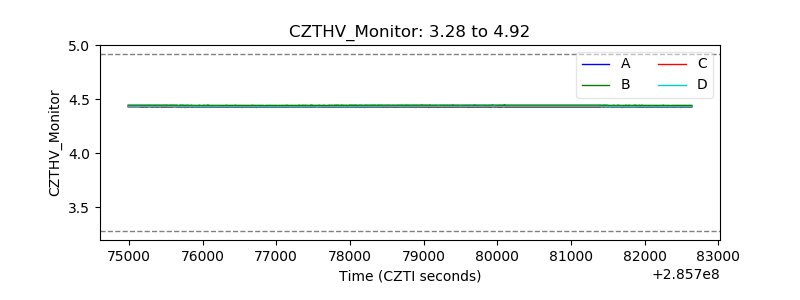 |
| D_VDD | 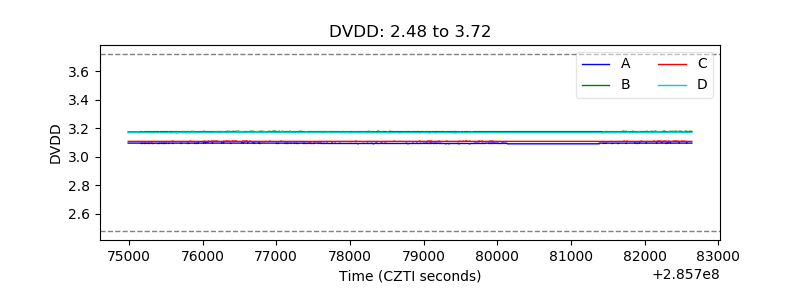 |
| Temperature 1 |  |
| Veto HV Monitor | 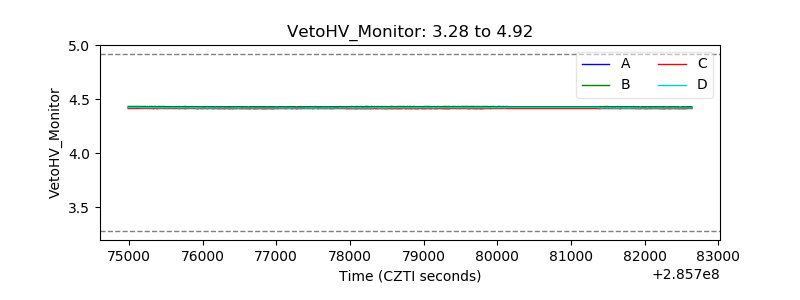 |
| Veto LLD | 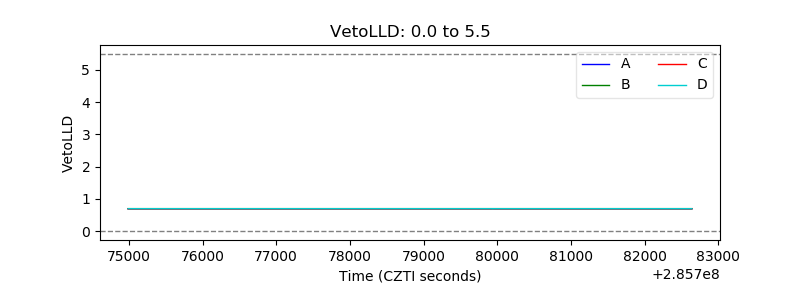 |
| Alpha Counter | 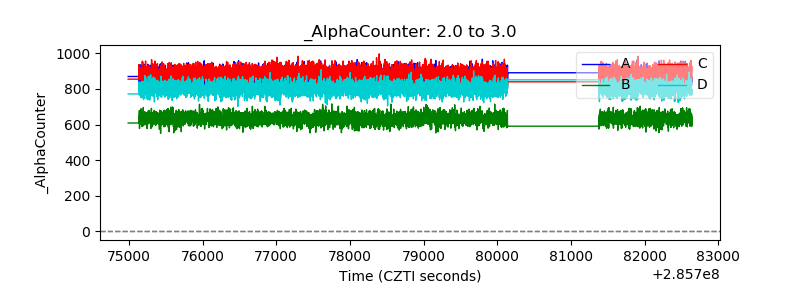 |
| _CPM_Rate | 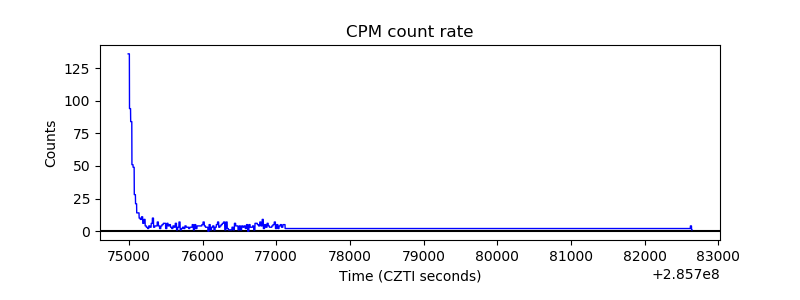 |
| CZT Counter | 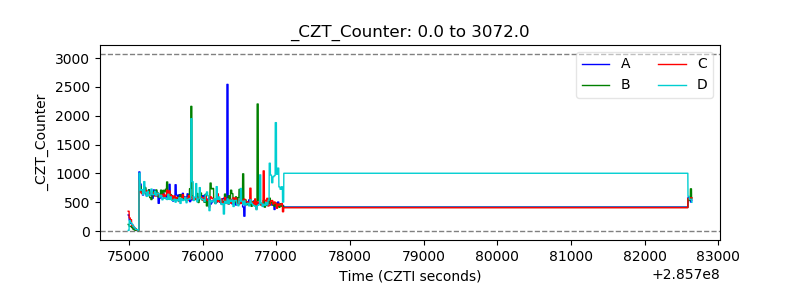 |
| +2.5 Volts monitor |  |
| +5 Volts monitor |  |
| _ROLL_ROT | 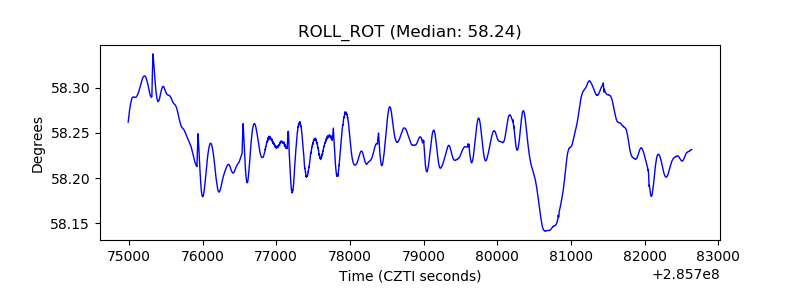 |
| _Roll_DEC | 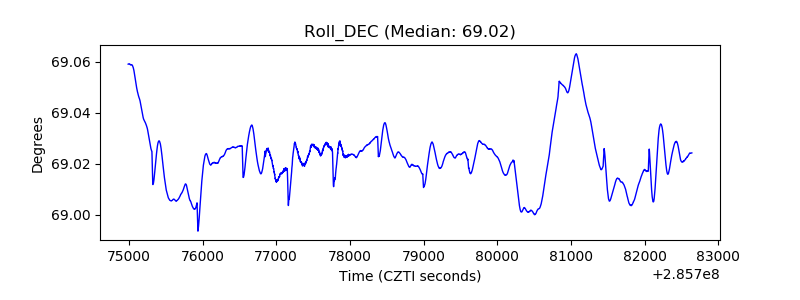 |
| _Roll_RA | 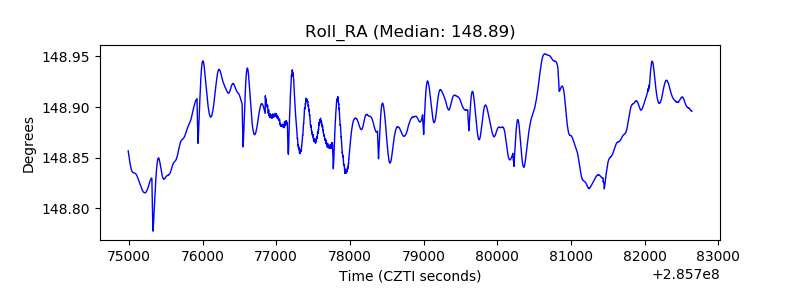 |
| Veto Counter | 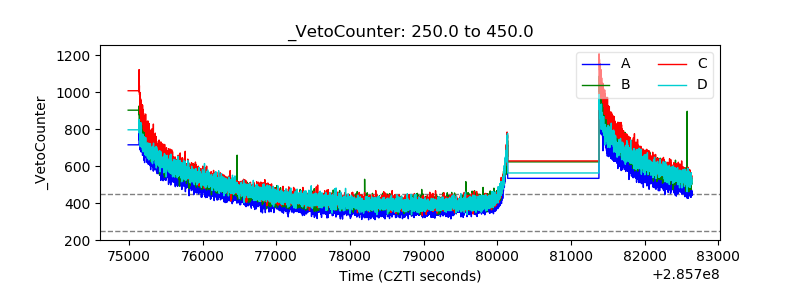 |