| Param | Original file | Final file |
|---|---|---|
| Filename | modeM0/AS1T03_025T01_9000002670_17934cztM0_level2.evt | modeM0/AS1T03_025T01_9000002670_17934cztM0_level2_quad_clean.evt |
| Size (bytes) | 455,630,400 | 124,562,880 |
| Size | 434.5 MB | 118.8 MB |
| Events in quadrant A | 3,339,619 | 837,322 |
| Events in quadrant B | 3,378,681 | 868,986 |
| Events in quadrant C | 3,299,354 | 834,216 |
| Events in quadrant D | 3,368,683 | 808,442 |
| Mode SS | |||
|---|---|---|---|
| Quadrant | BADHDUFLAG | Total packets | Discarded packets |
| A | 0 | 124 | 0 |
| B | 0 | 124 | 0 |
| C | 0 | 124 | 0 |
| D | 0 | 124 | 0 |
| Mode M0 | |||
|---|---|---|---|
| Quadrant | BADHDUFLAG | Total packets | Discarded packets |
| A | 0 | 13974 | 2 |
| B | 0 | 14088 | 2 |
| C | 0 | 13706 | 2 |
| D | 0 | 14175 | 2 |
| Mode M9 | |||
|---|---|---|---|
| Quadrant | BADHDUFLAG | Total packets | Discarded packets |
| A | 0 | 14 | 0 |
| B | 0 | 14 | 0 |
| C | 0 | 14 | 0 |
| D | 0 | 14 | 0 |
| Quadrant | Total seconds | Saturated seconds | Saturation percentage |
|---|---|---|---|
| A | 6068 | 177 | 2.916941% |
| B | 6069 | 86 | 1.417037% |
| C | 6069 | 132 | 2.174988% |
| D | 6069 | 66 | 1.087494% |
Noise dominated data is calculated using 1-second bins in cleaned event files. If a bin has >2000 counts, and if more than 50% of those come from <1% of pixels, then it is considered to be noise-dominated and hence unusable.
| Quadrant | # 1 sec bins | Bins with >0 counts | Bins with >2000 counts | High rate bins dominated by noise | Noise dominated (total time) | Noise dominated (detector-on time) | Marked lightcurve |
|---|---|---|---|---|---|---|---|
| A | 7453 | 6069 | 71 | 71 | 0.95% | 1.17% | 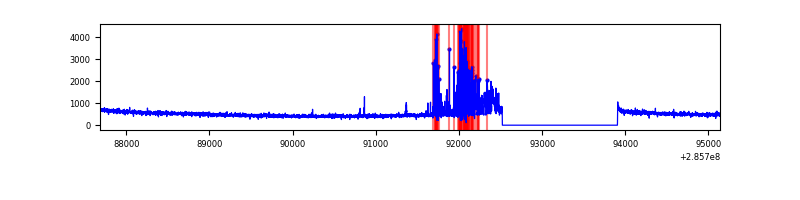 |
| B | 7454 | 6070 | 19 | 19 | 0.25% | 0.31% | 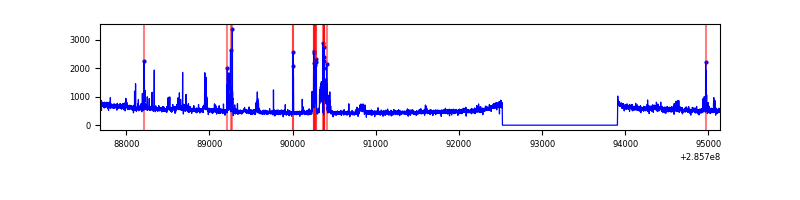 |
| C | 7454 | 6070 | 29 | 29 | 0.39% | 0.48% | 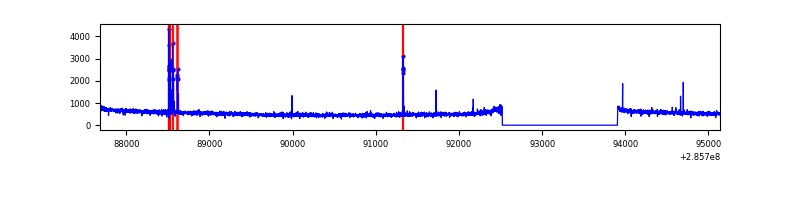 |
| D | 7454 | 6070 | 23 | 23 | 0.31% | 0.38% | 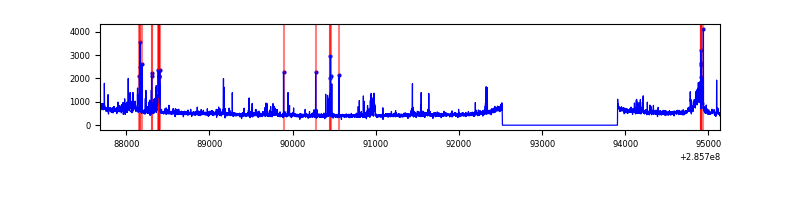 |
Top three noisy pixels from each quadrant. If the there are fewer than three noisy pixels in the level2.evt file, extra rows are filled as -1
| Pixel properties | Quadrant properties | ||||||
|---|---|---|---|---|---|---|---|
| Quadrant | DetID | PixID | Counts | Sigma | Mean | Median | Sigma |
| A | 15 | 174 | 362041 | 2344.0 | 773 | 757 | 154.1 |
| A | 0 | 226 | 6790 | 39.14 | 773 | 757 | 154.1 |
| A | 12 | 194 | 5693 | 32.02 | 773 | 757 | 154.1 |
| B | 15 | 222 | 158365 | 1080.39 | 789 | 770 | 145.9 |
| B | 0 | 197 | 70154 | 475.66 | 789 | 770 | 145.9 |
| B | 7 | 220 | 18736 | 123.16 | 789 | 770 | 145.9 |
| C | 14 | 238 | 121731 | 686.82 | 767 | 774 | 176.1 |
| C | 9 | 160 | 66515 | 373.29 | 767 | 774 | 176.1 |
| C | 9 | 176 | 49020 | 273.95 | 767 | 774 | 176.1 |
| D | 7 | 238 | 136224 | 740.3 | 773 | 754 | 183.0 |
| D | 10 | 70 | 59313 | 320.0 | 773 | 754 | 183.0 |
| D | 15 | 0 | 47961 | 257.97 | 773 | 754 | 183.0 |
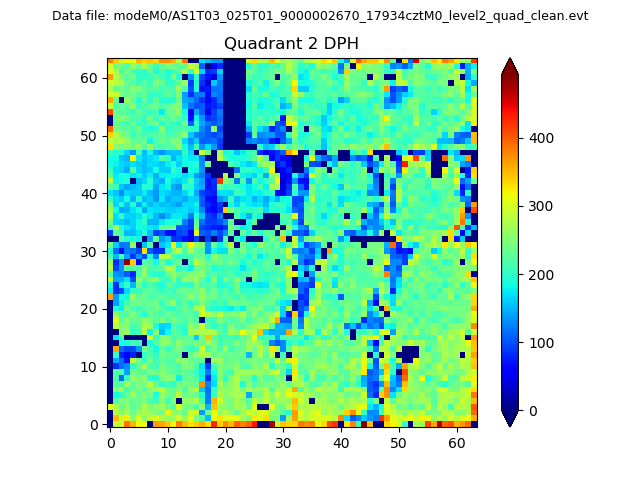
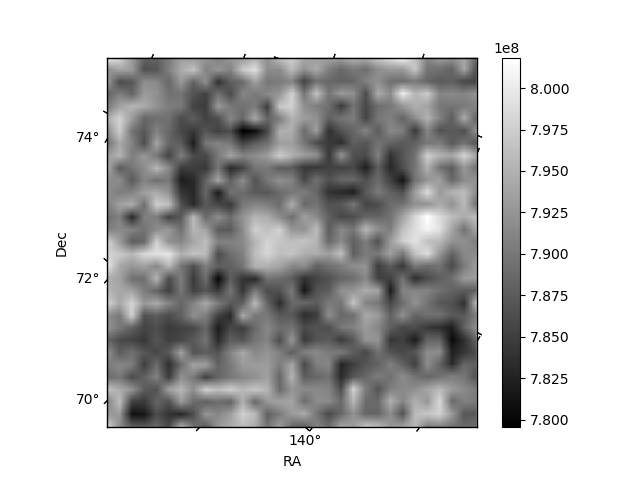
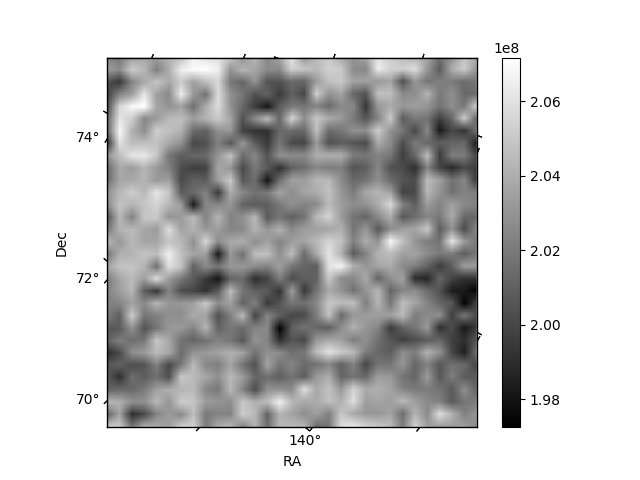
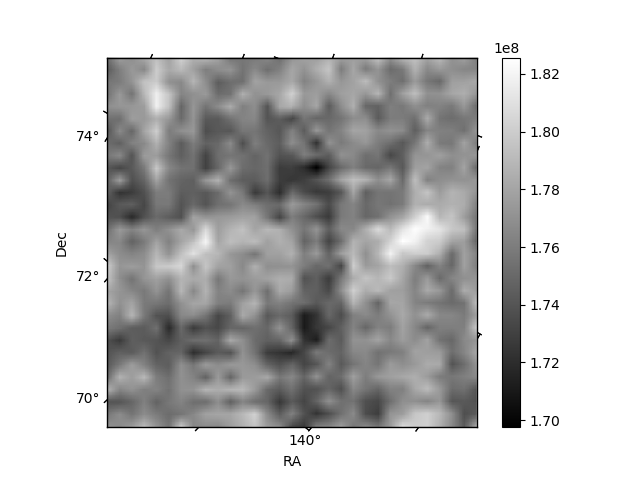
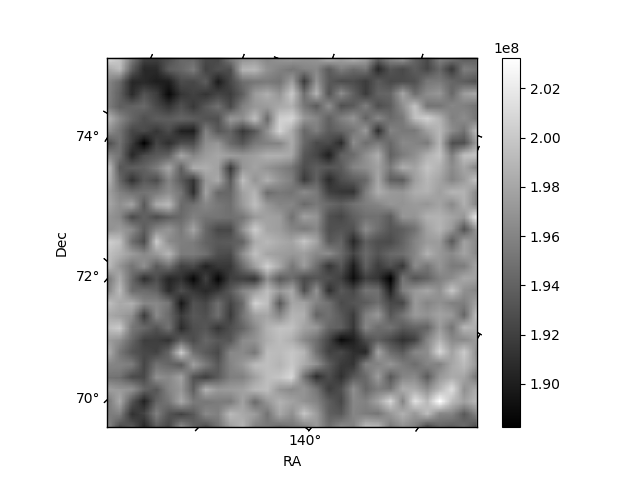
Histogram calculated using DETX and DETY for each event in the final _common_clean file
| Quadrant A | 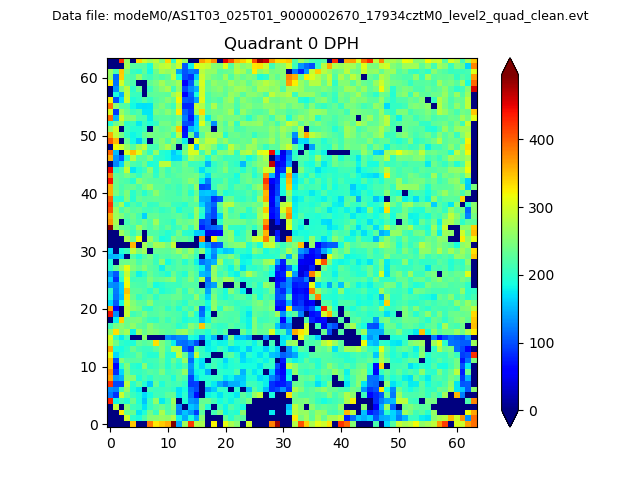 |
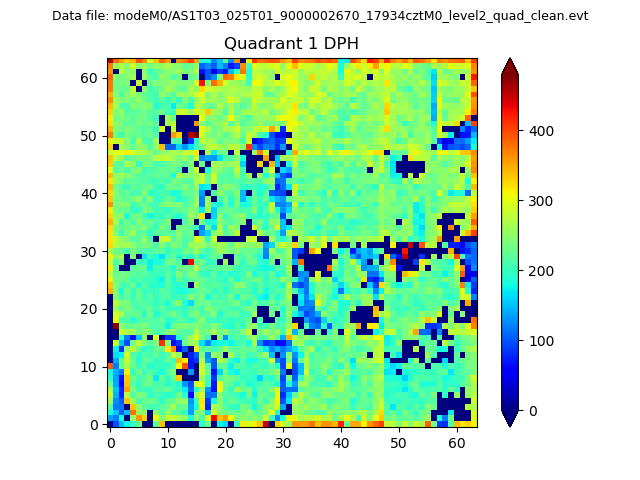 |
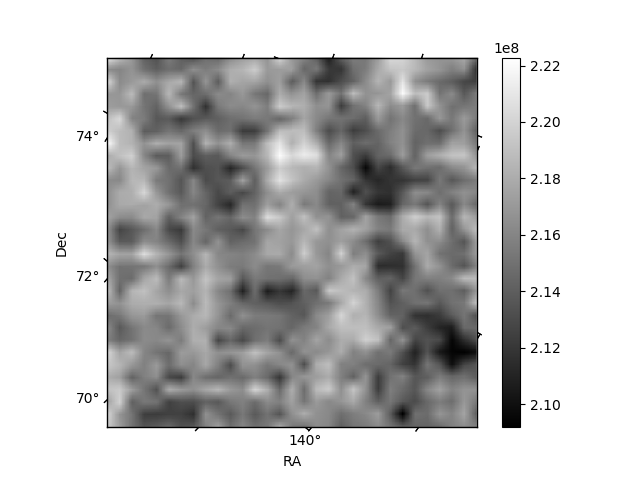
Quadrant B |
|---|---|---|---|
| Quadrant D | 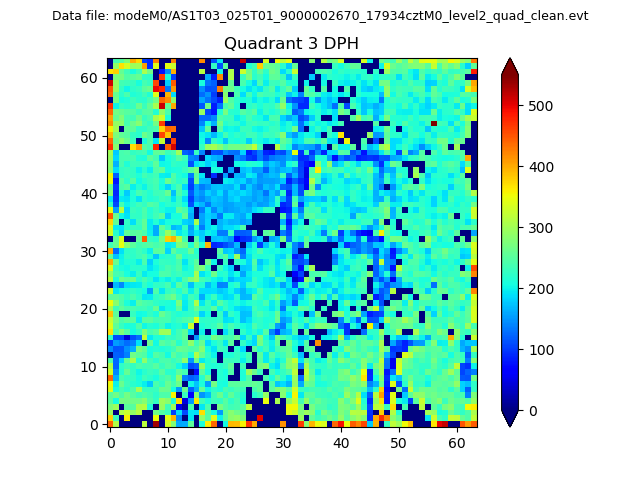 |
 |
Quadrant C |
| Plot type | Count rate plots | Images |
|---|---|---|
| Comparison with Poisson distribution Blue bars denote a histogram of data divided into 1 sec bins. Red curve is a Poisson curve with rate = median count rate of data. |
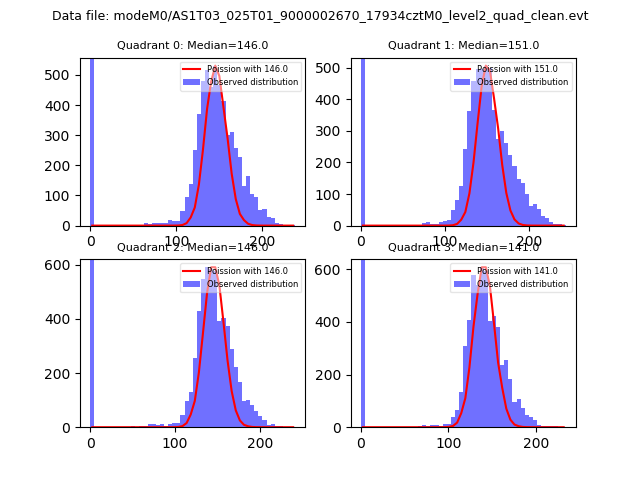 |
 |
| Quadrant-wise count rates Data is divided into 100 sec bins |
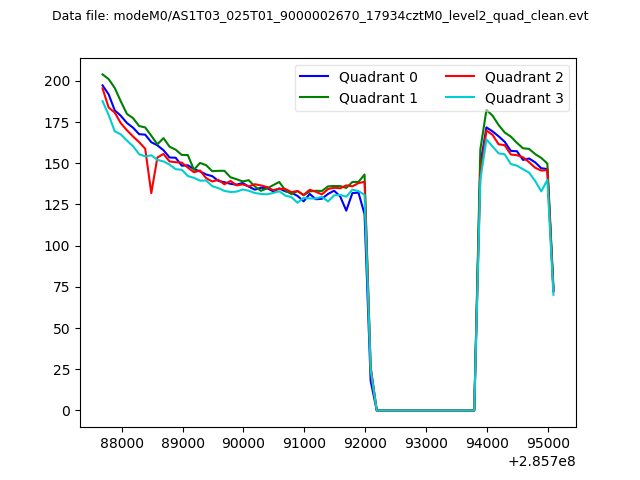 |
|
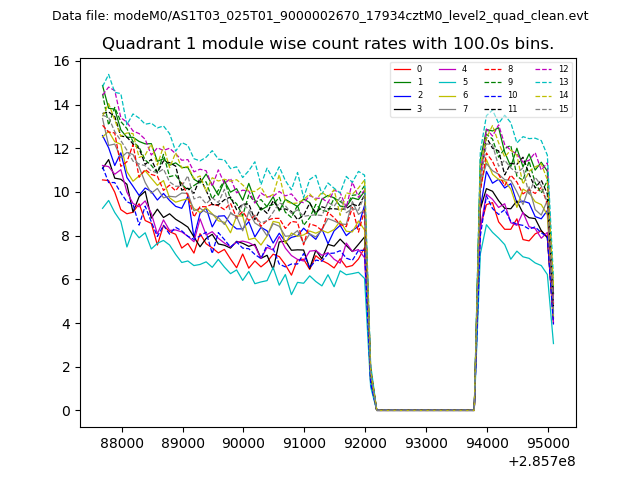
| Module-wise count rates for Quadrant A Data is divided into 100 sec bins |
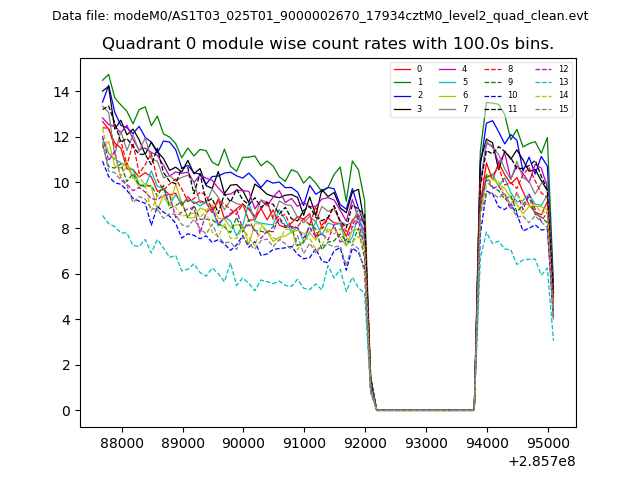 |
 |
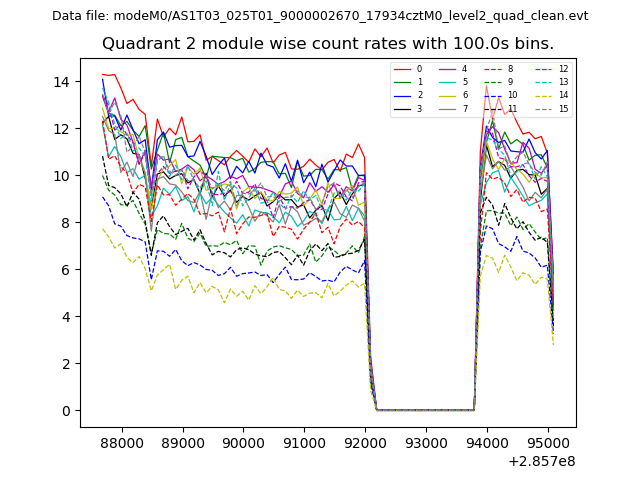
| Module-wise count rates for Quadrant B Data is divided into 100 sec bins |
 |
 |
| Module-wise count rates for Quadrant C Data is divided into 100 sec bins |
 |
 |
| Module-wise count rates for Quadrant D Data is divided into 100 sec bins |
 |
 |
| Parameter | Plot |
|---|---|
| CZT HV Monitor | 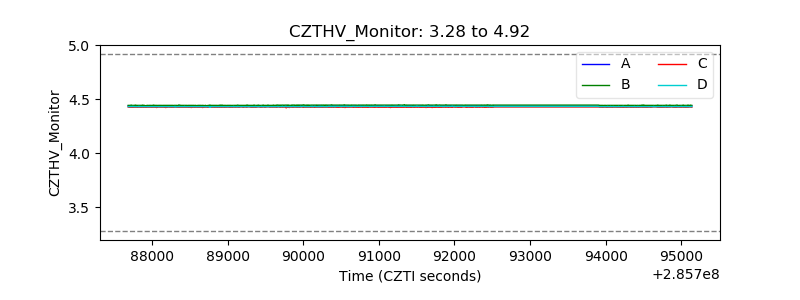 |
| D_VDD | 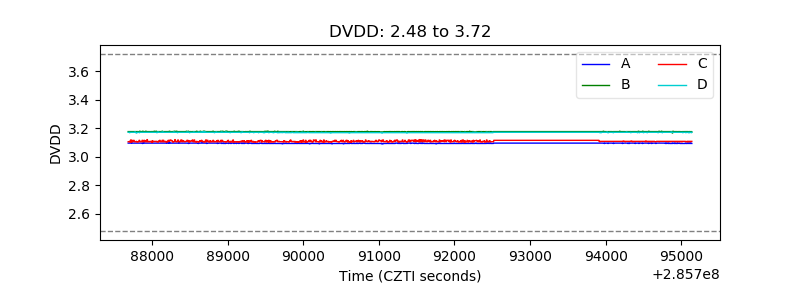 |
| Temperature 1 | 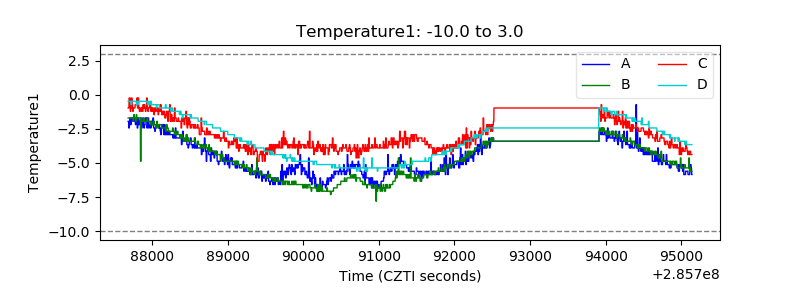 |
| Veto HV Monitor | 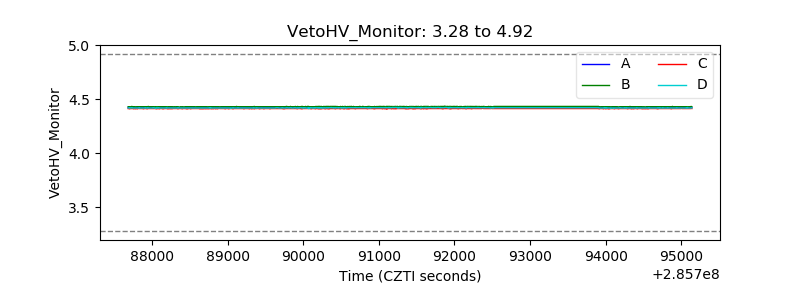 |
| Veto LLD |  |
| Alpha Counter | 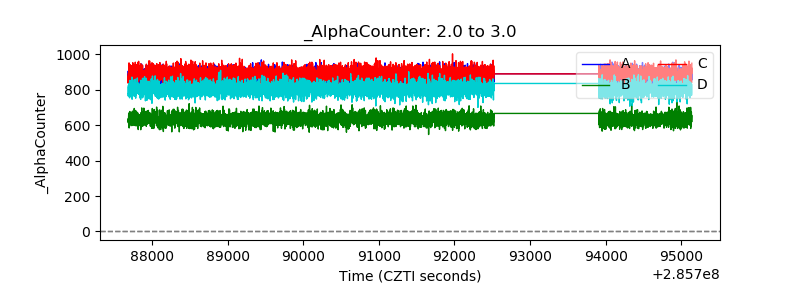 |
| _CPM_Rate | 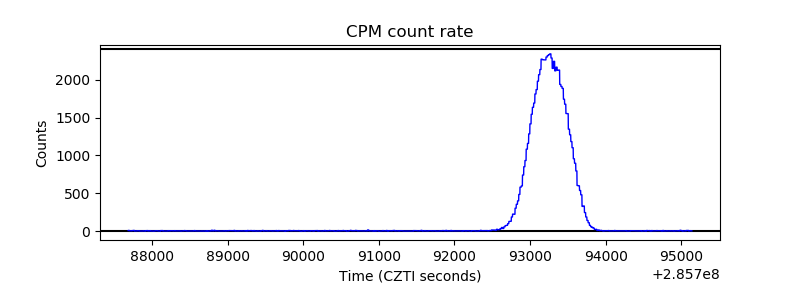 |
| CZT Counter | 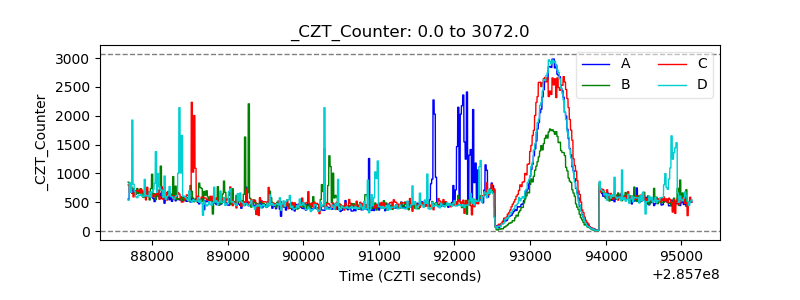 |
| +2.5 Volts monitor |  |
| +5 Volts monitor |  |
| _ROLL_ROT | 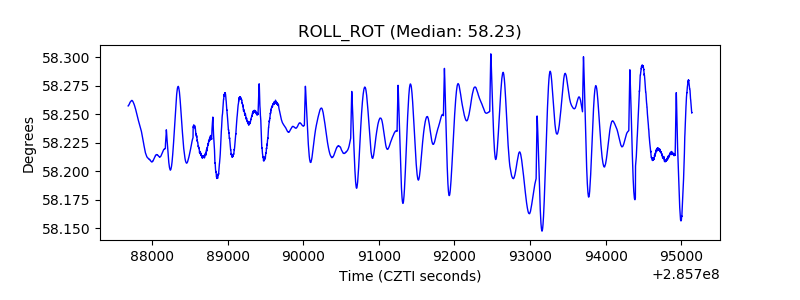 |
| _Roll_DEC | 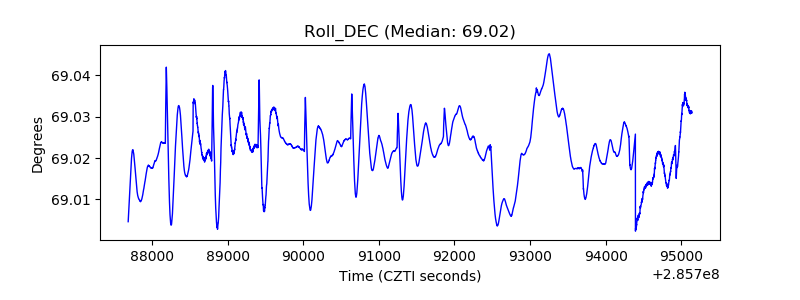 |
| _Roll_RA | 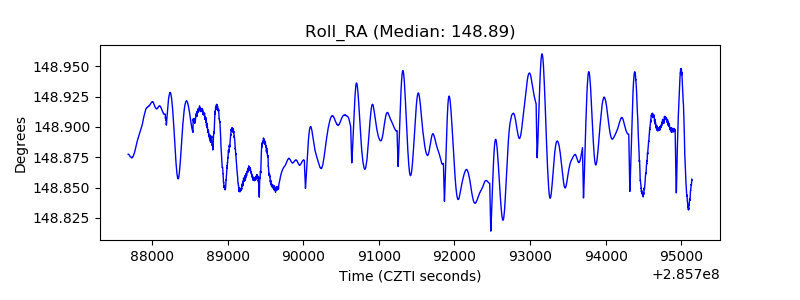 |
| Veto Counter | 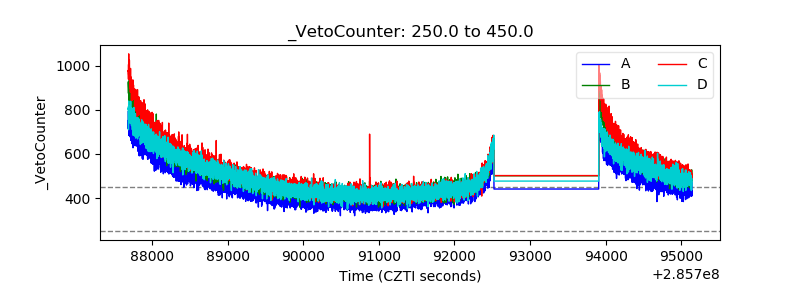 |