| Param | Original file | Final file |
|---|---|---|
| Filename | modeM0/AS1T03_025T01_9000002670_17936cztM0_level2.evt | modeM0/AS1T03_025T01_9000002670_17936cztM0_level2_quad_clean.evt |
| Size (bytes) | 460,808,640 | 105,863,040 |
| Size | 439.5 MB | 101.0 MB |
| Events in quadrant A | 3,143,039 | 685,048 |
| Events in quadrant B | 3,365,948 | 708,723 |
| Events in quadrant C | 3,269,822 | 681,041 |
| Events in quadrant D | 3,715,188 | 657,974 |
| Mode SS | |||
|---|---|---|---|
| Quadrant | BADHDUFLAG | Total packets | Discarded packets |
| A | 0 | 138 | 0 |
| B | 0 | 138 | 0 |
| C | 0 | 138 | 0 |
| D | 0 | 138 | 0 |
| Mode M0 | |||
|---|---|---|---|
| Quadrant | BADHDUFLAG | Total packets | Discarded packets |
| A | 0 | 14129 | 2 |
| B | 0 | 14663 | 2 |
| C | 0 | 14114 | 2 |
| D | 0 | 15919 | 2 |
| Mode M9 | |||
|---|---|---|---|
| Quadrant | BADHDUFLAG | Total packets | Discarded packets |
| A | 0 | 24 | 0 |
| B | 0 | 24 | 0 |
| C | 0 | 24 | 0 |
| D | 0 | 24 | 0 |
| Quadrant | Total seconds | Saturated seconds | Saturation percentage |
|---|---|---|---|
| A | 6798 | 24 | 0.353045% |
| B | 6798 | 72 | 1.059135% |
| C | 6799 | 95 | 1.397264% |
| D | 6799 | 112 | 1.647301% |
Noise dominated data is calculated using 1-second bins in cleaned event files. If a bin has >2000 counts, and if more than 50% of those come from <1% of pixels, then it is considered to be noise-dominated and hence unusable.
| Quadrant | # 1 sec bins | Bins with >0 counts | Bins with >2000 counts | High rate bins dominated by noise | Noise dominated (total time) | Noise dominated (detector-on time) | Marked lightcurve |
|---|---|---|---|---|---|---|---|
| A | 9173 | 6800 | 0 | 0 | 0.00% | 0.00% | 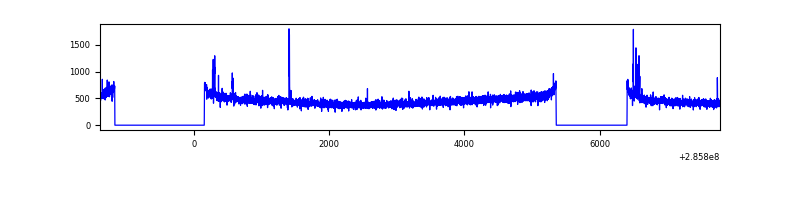 |
| B | 9173 | 6800 | 8 | 8 | 0.09% | 0.12% | 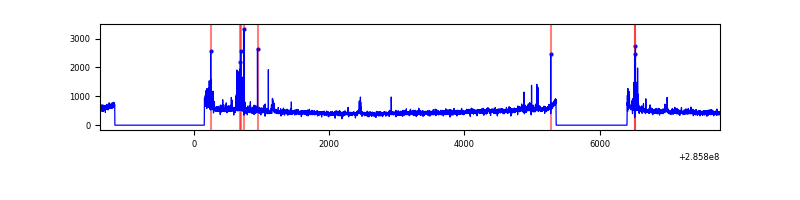 |
| C | 9174 | 6801 | 0 | 0 | 0.00% | 0.00% | 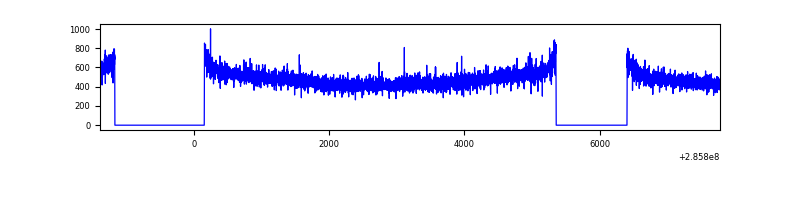 |
| D | 9174 | 6801 | 126 | 126 | 1.37% | 1.85% | 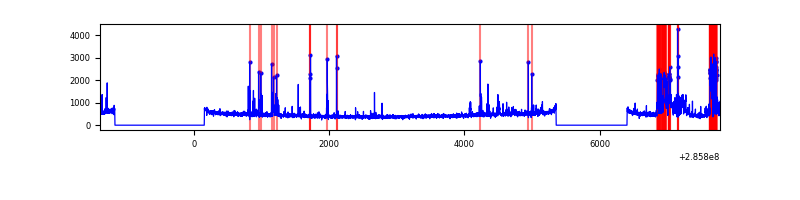 |
Top three noisy pixels from each quadrant. If the there are fewer than three noisy pixels in the level2.evt file, extra rows are filled as -1
| Pixel properties | Quadrant properties | ||||||
|---|---|---|---|---|---|---|---|
| Quadrant | DetID | PixID | Counts | Sigma | Mean | Median | Sigma |
| A | 15 | 174 | 39782 | 242.22 | 805 | 786 | 161.0 |
| A | 4 | 2 | 7928 | 44.36 | 805 | 786 | 161.0 |
| A | 0 | 226 | 6897 | 37.96 | 805 | 786 | 161.0 |
| B | 0 | 197 | 100172 | 650.31 | 818 | 797 | 152.8 |
| B | 12 | 111 | 18109 | 113.29 | 818 | 797 | 152.8 |
| B | 4 | 48 | 17347 | 108.3 | 818 | 797 | 152.8 |
| C | 14 | 238 | 122638 | 665.42 | 789 | 793 | 183.1 |
| C | 5 | 218 | 34572 | 184.47 | 789 | 793 | 183.1 |
| C | 3 | 233 | 33165 | 176.79 | 789 | 793 | 183.1 |
| D | 7 | 223 | 495555 | 2613.37 | 790 | 768 | 189.3 |
| D | 10 | 70 | 63675 | 332.26 | 790 | 768 | 189.3 |
| D | 9 | 64 | 46652 | 242.35 | 790 | 768 | 189.3 |
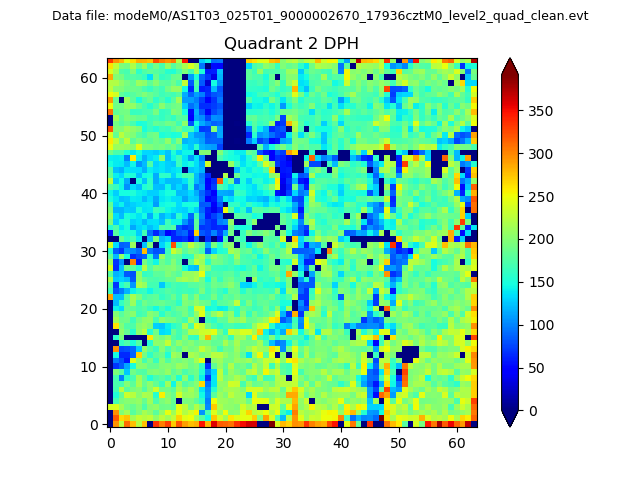
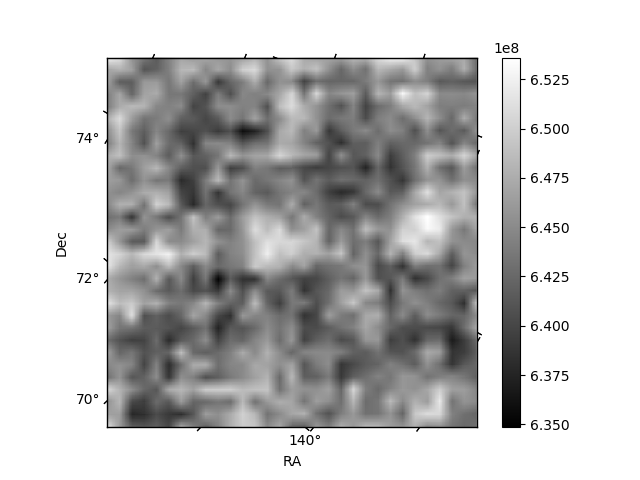
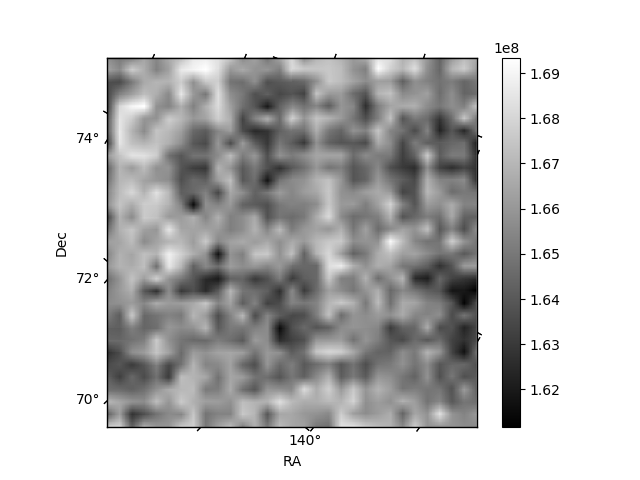
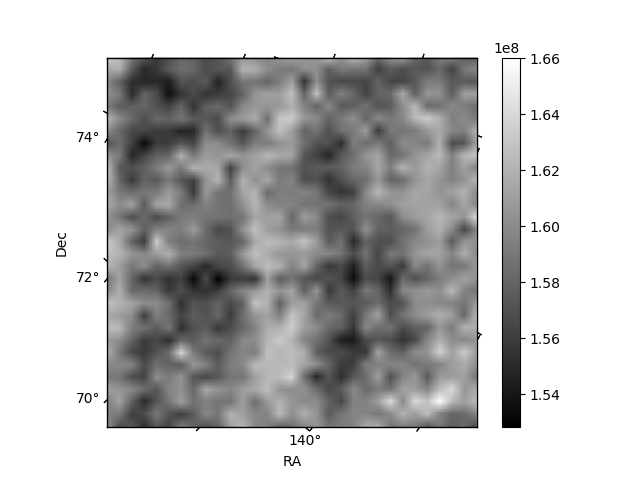
Histogram calculated using DETX and DETY for each event in the final _common_clean file
| Quadrant A | 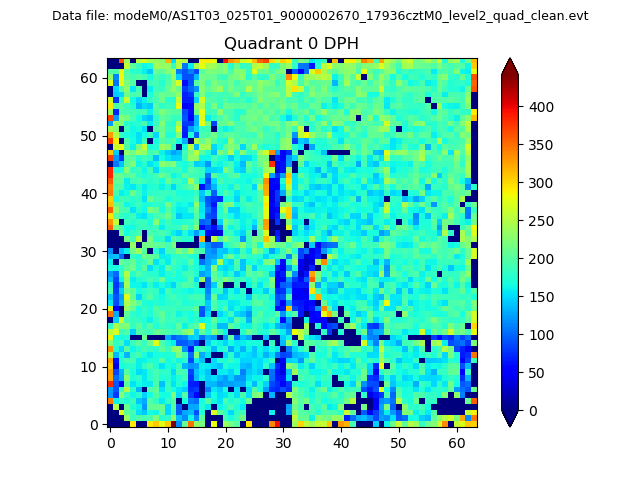 |
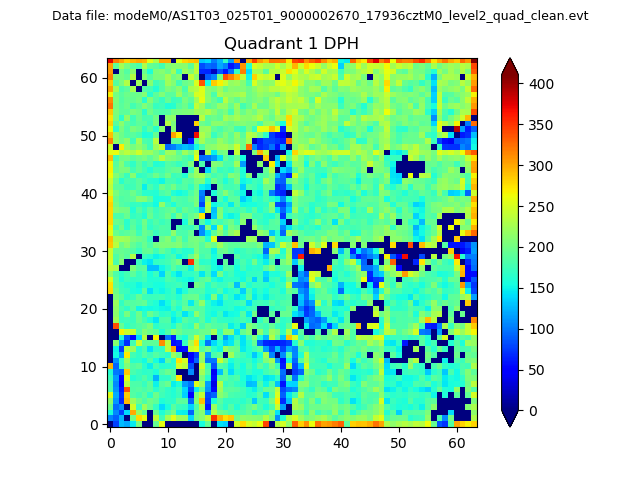 |
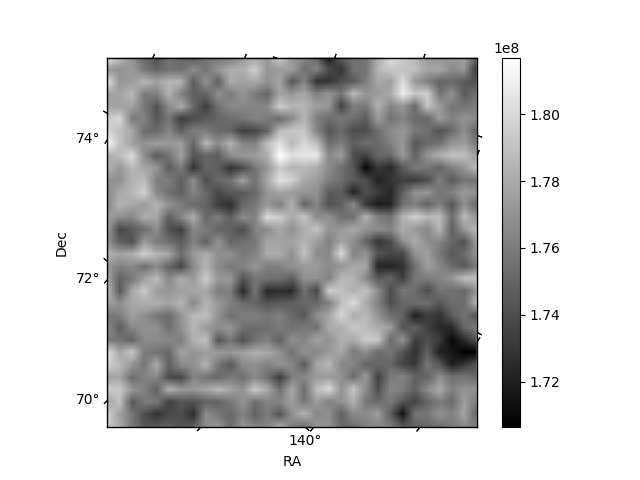
Quadrant B |
|---|---|---|---|
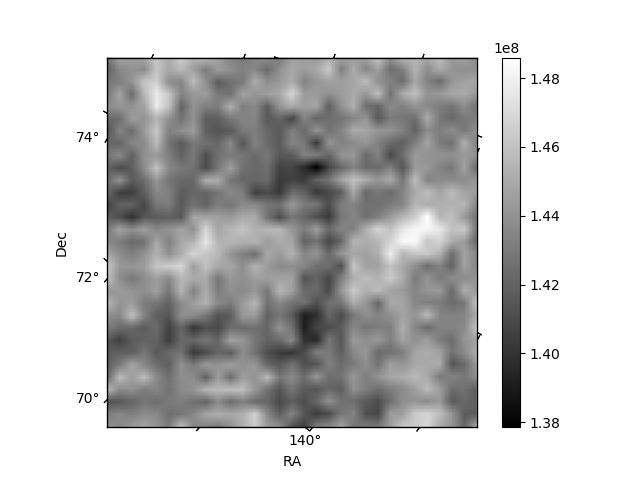
| Quadrant D | 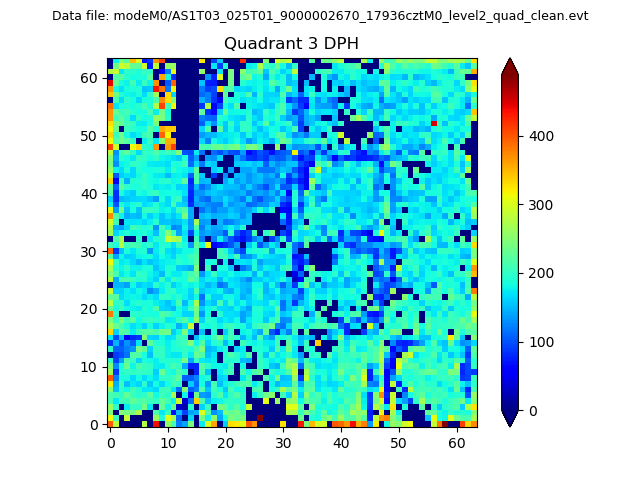 |
 |
Quadrant C |
| Plot type | Count rate plots | Images |
|---|---|---|
| Comparison with Poisson distribution Blue bars denote a histogram of data divided into 1 sec bins. Red curve is a Poisson curve with rate = median count rate of data. |
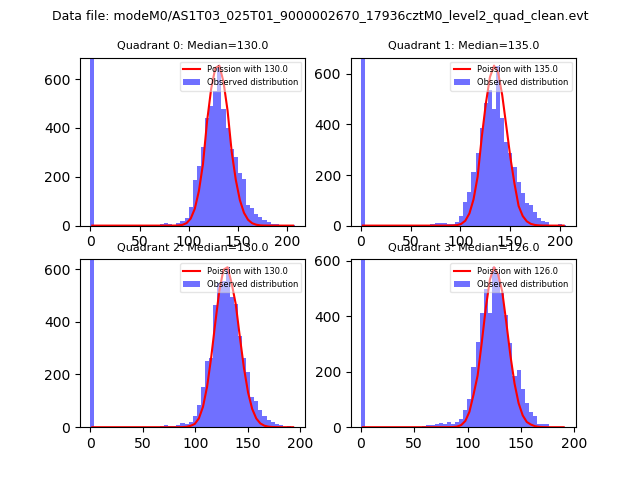 |
 |
| Quadrant-wise count rates Data is divided into 100 sec bins |
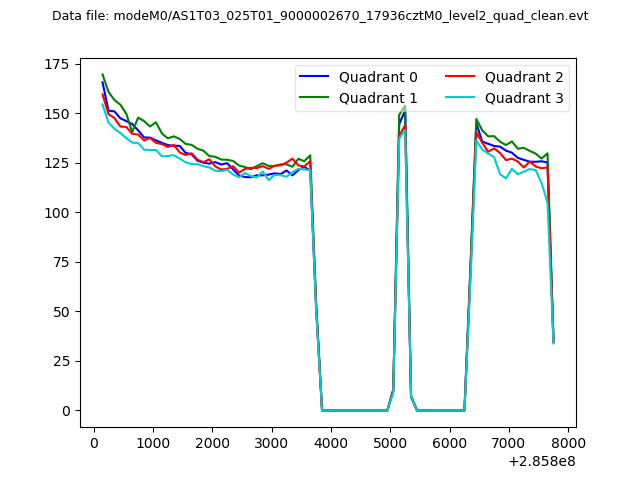 |
|
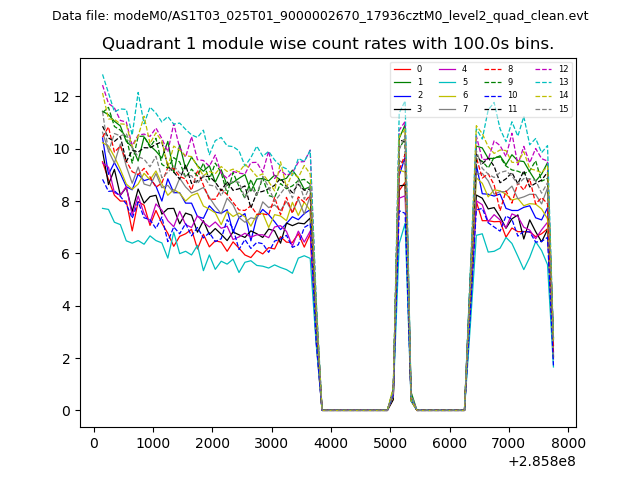
| Module-wise count rates for Quadrant A Data is divided into 100 sec bins |
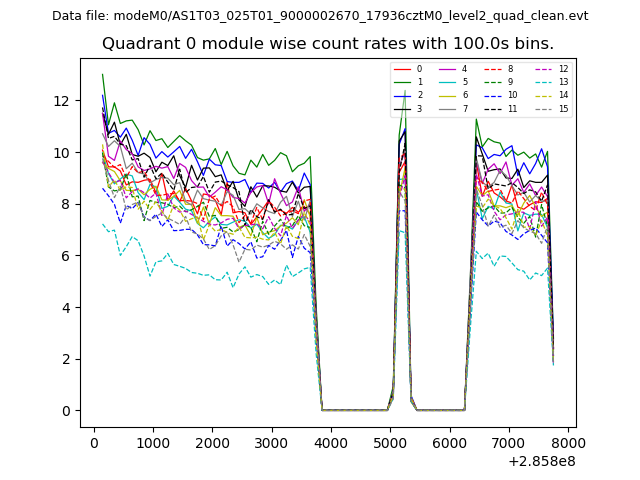 |
 |
| Module-wise count rates for Quadrant B Data is divided into 100 sec bins |
 |
 |
| Module-wise count rates for Quadrant C Data is divided into 100 sec bins |
 |
 |
| Module-wise count rates for Quadrant D Data is divided into 100 sec bins |
 |
 |
| Parameter | Plot |
|---|---|
| CZT HV Monitor | 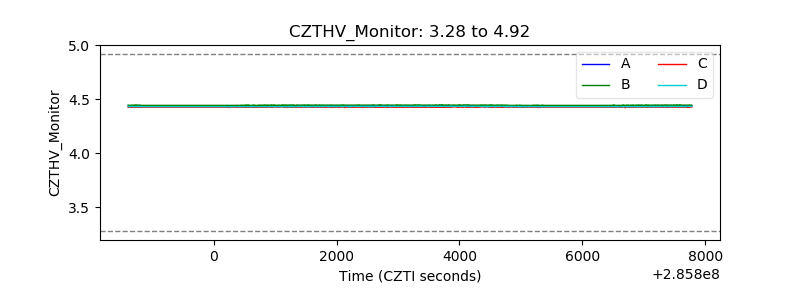 |
| D_VDD | 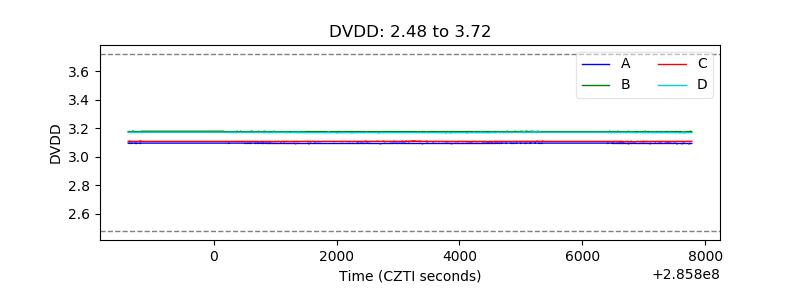 |
| Temperature 1 | 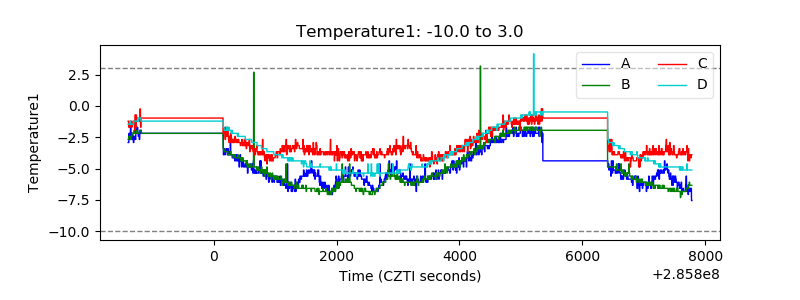 |
| Veto HV Monitor | 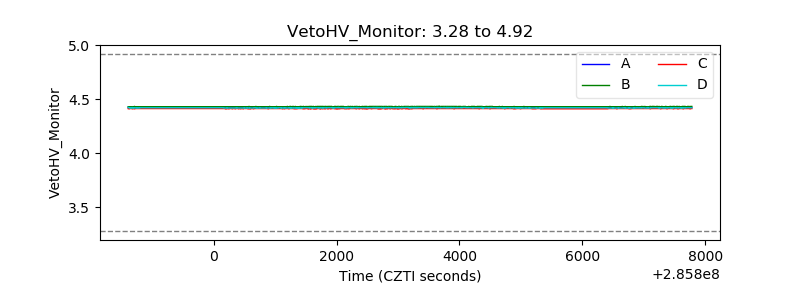 |
| Veto LLD | 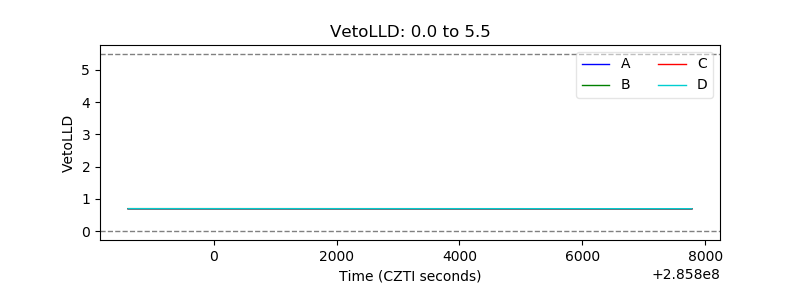 |
| Alpha Counter | 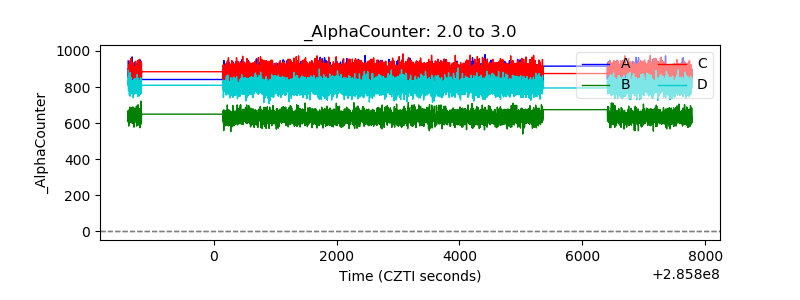 |
| _CPM_Rate | 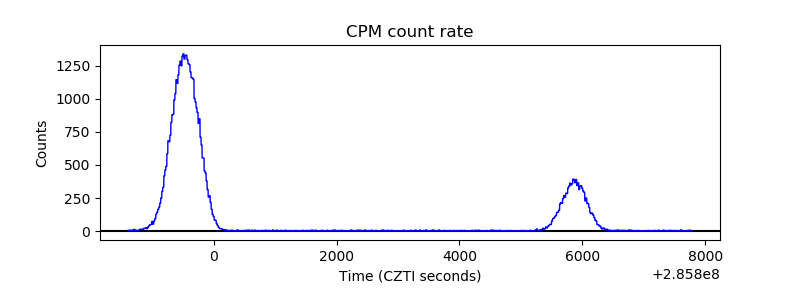 |
| CZT Counter | 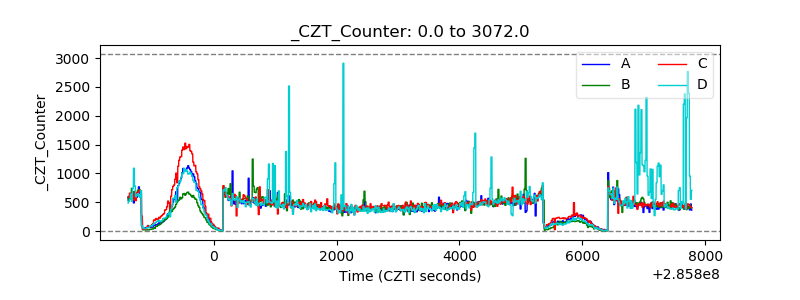 |
| +2.5 Volts monitor |  |
| +5 Volts monitor |  |
| _ROLL_ROT | 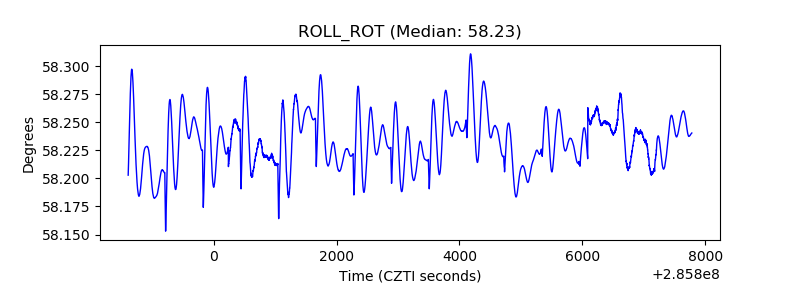 |
| _Roll_DEC | 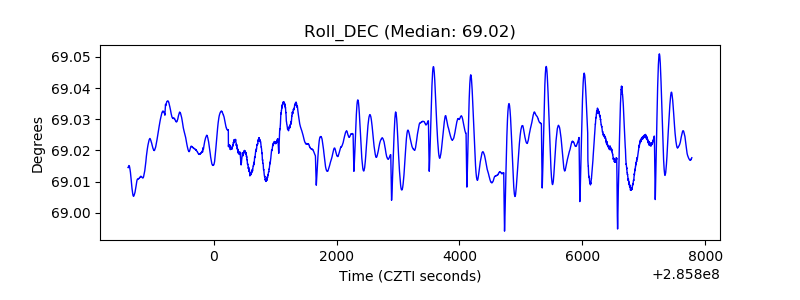 |
| _Roll_RA | 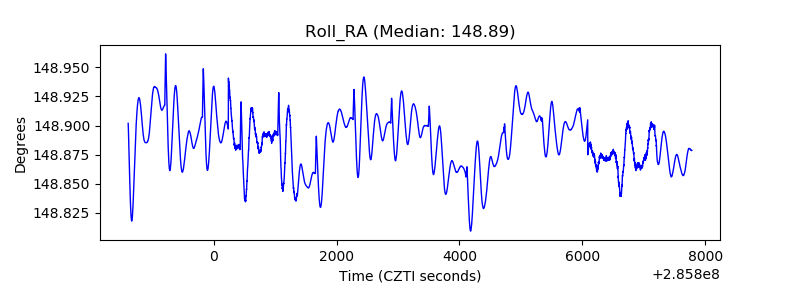 |
| Veto Counter | 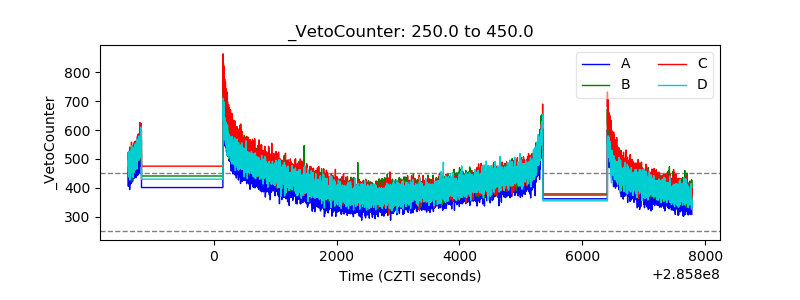 |