| Param | Original file | Final file |
|---|---|---|
| Filename | modeM0/AS1T03_025T01_9000002670_17937cztM0_level2.evt | modeM0/AS1T03_025T01_9000002670_17937cztM0_level2_quad_clean.evt |
| Size (bytes) | 542,957,760 | 113,552,640 |
| Size | 517.8 MB | 108.3 MB |
| Events in quadrant A | 3,358,921 | 746,059 |
| Events in quadrant B | 3,581,790 | 766,050 |
| Events in quadrant C | 3,421,928 | 732,715 |
| Events in quadrant D | 5,585,807 | 686,635 |
| Mode SS | |||
|---|---|---|---|
| Quadrant | BADHDUFLAG | Total packets | Discarded packets |
| A | 0 | 150 | 0 |
| B | 0 | 150 | 0 |
| C | 0 | 150 | 0 |
| D | 0 | 150 | 0 |
| Mode M0 | |||
|---|---|---|---|
| Quadrant | BADHDUFLAG | Total packets | Discarded packets |
| A | 0 | 15134 | 2 |
| B | 0 | 15718 | 2 |
| C | 0 | 15134 | 2 |
| D | 0 | 21784 | 2 |
| Mode M9 | |||
|---|---|---|---|
| Quadrant | BADHDUFLAG | Total packets | Discarded packets |
| A | 0 | 17 | 0 |
| B | 0 | 17 | 0 |
| C | 0 | 17 | 0 |
| D | 0 | 17 | 0 |
| Quadrant | Total seconds | Saturated seconds | Saturation percentage |
|---|---|---|---|
| A | 7289 | 38 | 0.521334% |
| B | 7289 | 129 | 1.769790% |
| C | 7289 | 126 | 1.728632% |
| D | 7289 | 640 | 8.780354% |
Noise dominated data is calculated using 1-second bins in cleaned event files. If a bin has >2000 counts, and if more than 50% of those come from <1% of pixels, then it is considered to be noise-dominated and hence unusable.
| Quadrant | # 1 sec bins | Bins with >0 counts | Bins with >2000 counts | High rate bins dominated by noise | Noise dominated (total time) | Noise dominated (detector-on time) | Marked lightcurve |
|---|---|---|---|---|---|---|---|
| A | 8944 | 7291 | 0 | 0 | 0.00% | 0.00% | 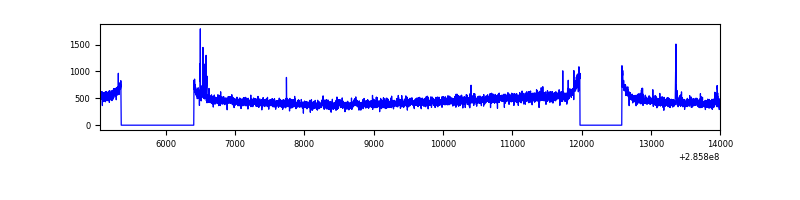 |
| B | 8944 | 7291 | 10 | 10 | 0.11% | 0.14% | 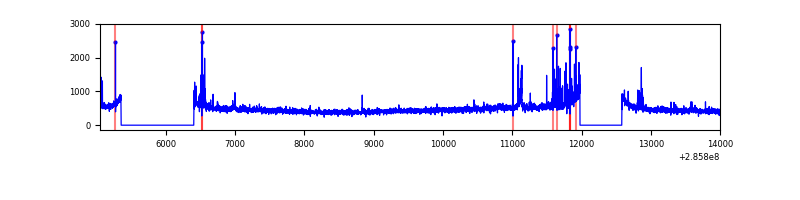 |
| C | 8944 | 7291 | 0 | 0 | 0.00% | 0.00% | 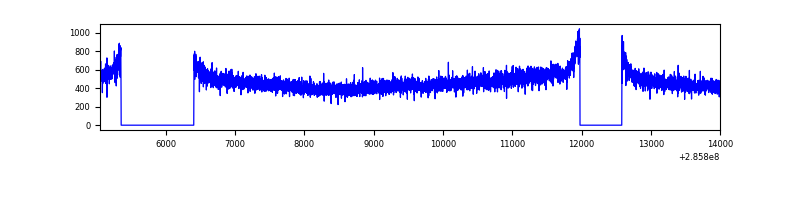 |
| D | 8944 | 7291 | 604 | 604 | 6.75% | 8.28% | 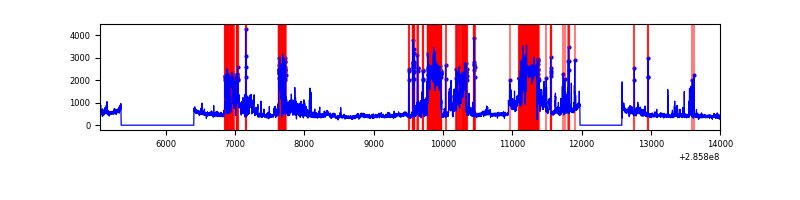 |
Top three noisy pixels from each quadrant. If the there are fewer than three noisy pixels in the level2.evt file, extra rows are filled as -1
| Pixel properties | Quadrant properties | ||||||
|---|---|---|---|---|---|---|---|
| Quadrant | DetID | PixID | Counts | Sigma | Mean | Median | Sigma |
| A | 15 | 174 | 42988 | 241.57 | 858 | 840 | 174.5 |
| A | 13 | 210 | 10105 | 53.1 | 858 | 840 | 174.5 |
| A | 0 | 226 | 7291 | 36.97 | 858 | 840 | 174.5 |
| B | 0 | 197 | 91463 | 554.61 | 867 | 844 | 163.4 |
| B | 0 | 190 | 36409 | 217.67 | 867 | 844 | 163.4 |
| B | 12 | 111 | 19847 | 116.3 | 867 | 844 | 163.4 |
| C | 14 | 238 | 129027 | 656.95 | 835 | 837 | 195.1 |
| C | 3 | 233 | 25906 | 128.47 | 835 | 837 | 195.1 |
| C | 5 | 218 | 9025 | 41.96 | 835 | 837 | 195.1 |
| D | 7 | 238 | 1678814 | 8571.36 | 809 | 785 | 195.8 |
| D | 7 | 223 | 590617 | 3012.86 | 809 | 785 | 195.8 |
| D | 9 | 64 | 131910 | 669.79 | 809 | 785 | 195.8 |
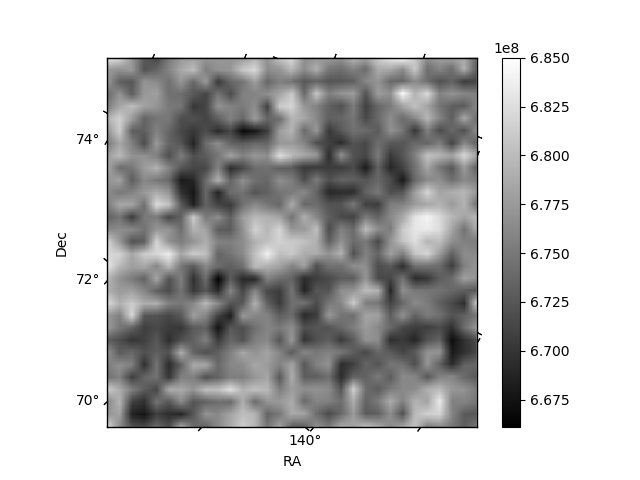
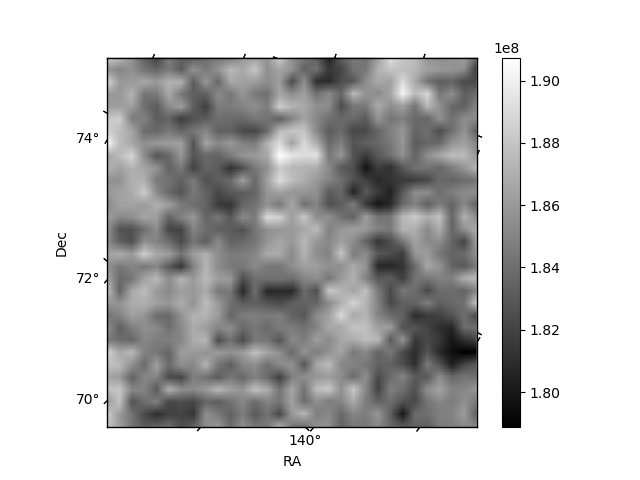
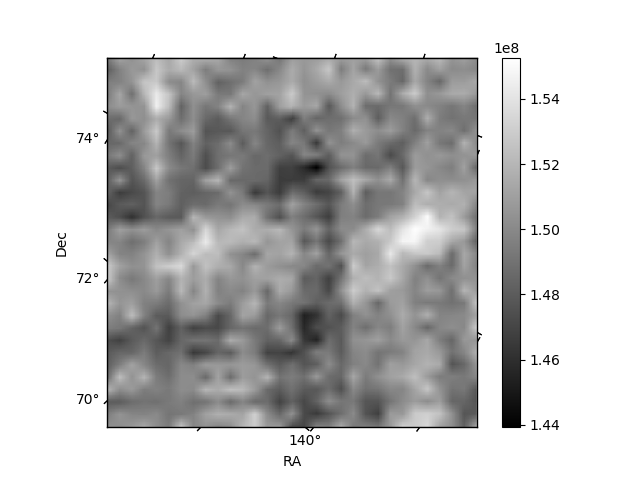
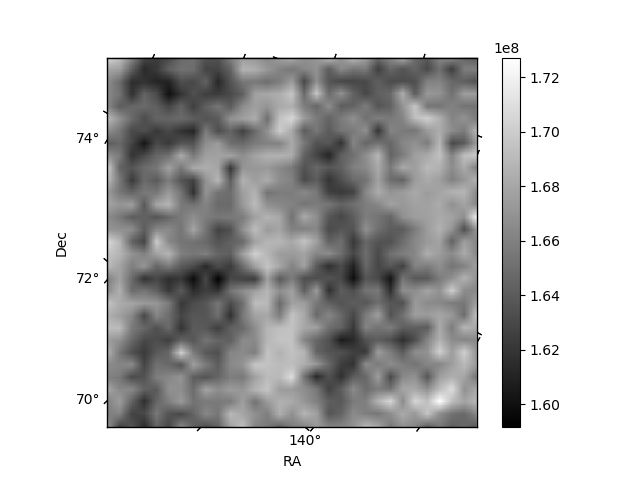
Histogram calculated using DETX and DETY for each event in the final _common_clean file
| Quadrant A | 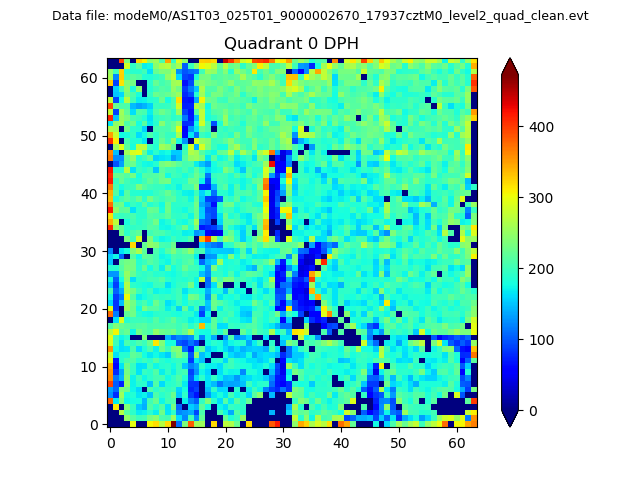 |
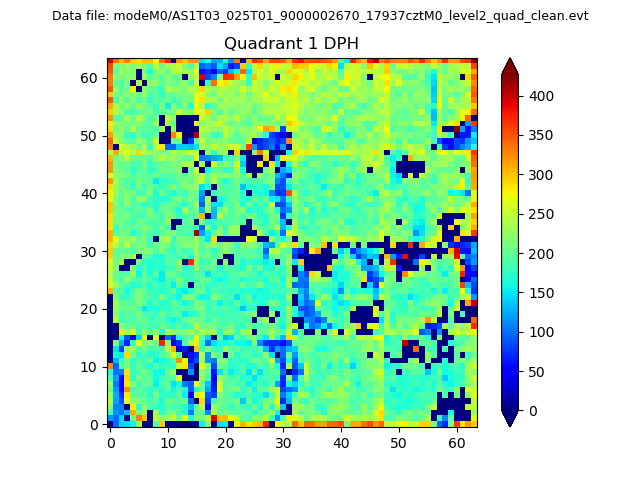 |
Quadrant B |
|---|---|---|---|
| Quadrant D |  |
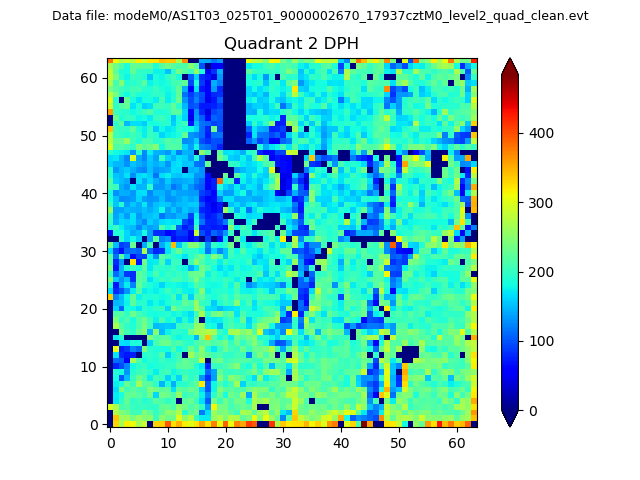 |
Quadrant C |
| Plot type | Count rate plots | Images |
|---|---|---|
| Comparison with Poisson distribution Blue bars denote a histogram of data divided into 1 sec bins. Red curve is a Poisson curve with rate = median count rate of data. |
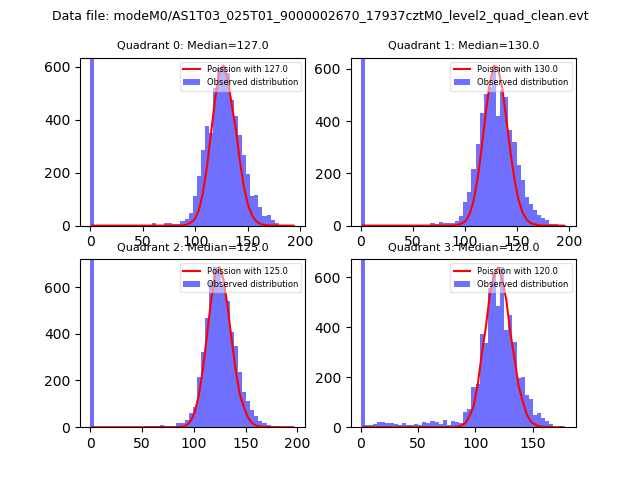 |
 |
| Quadrant-wise count rates Data is divided into 100 sec bins |
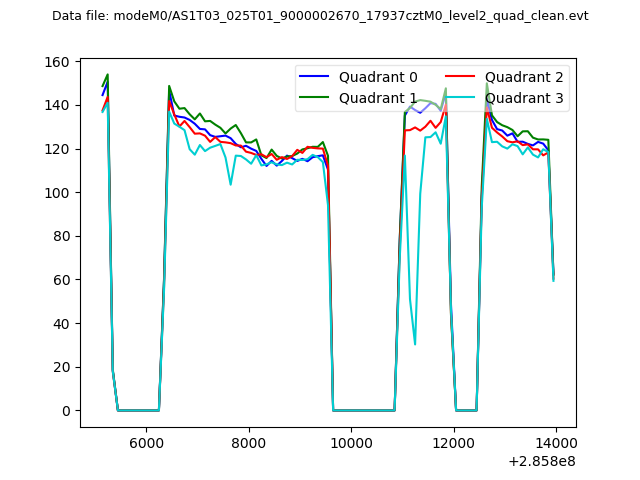 |
|
| Module-wise count rates for Quadrant A Data is divided into 100 sec bins |
 |
 |
| Module-wise count rates for Quadrant B Data is divided into 100 sec bins |
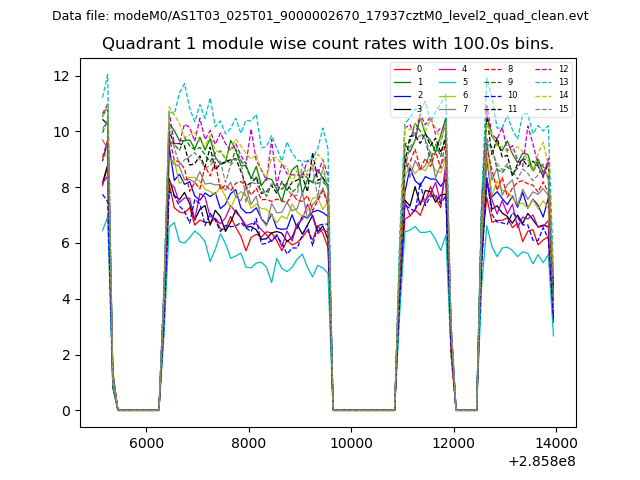 |
 |
| Module-wise count rates for Quadrant C Data is divided into 100 sec bins |
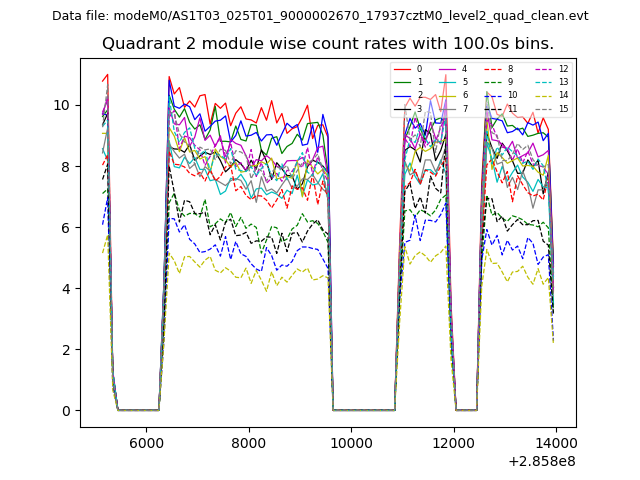 |
 |
| Module-wise count rates for Quadrant D Data is divided into 100 sec bins |
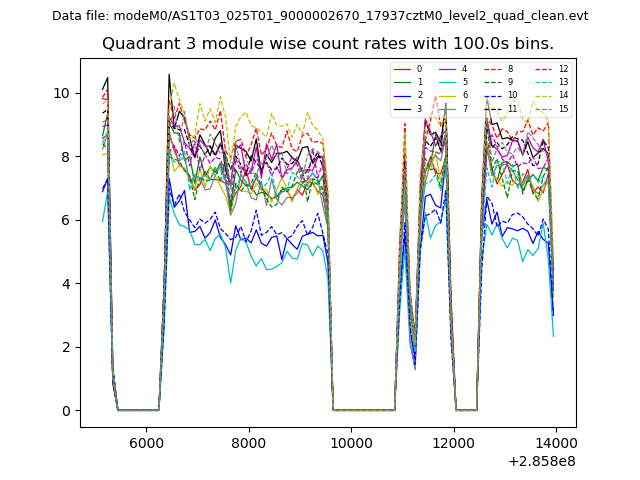 |
 |
| Parameter | Plot |
|---|---|
| CZT HV Monitor | 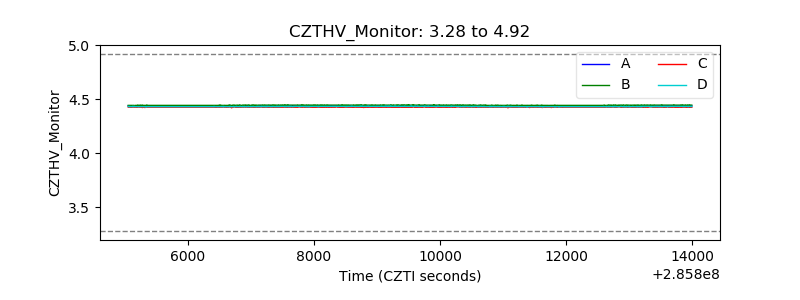 |
| D_VDD | 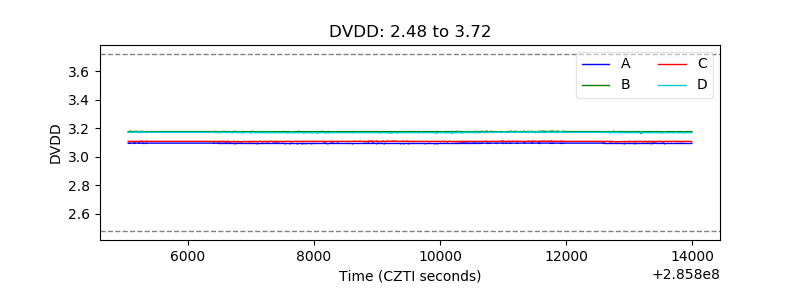 |
| Temperature 1 | 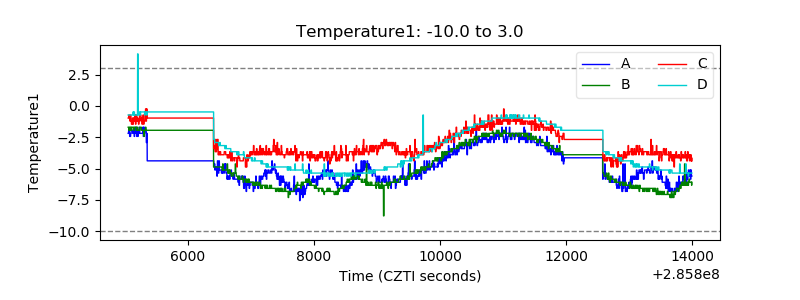 |
| Veto HV Monitor | 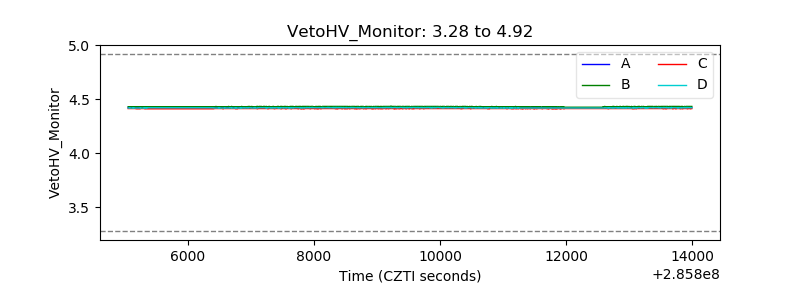 |
| Veto LLD | 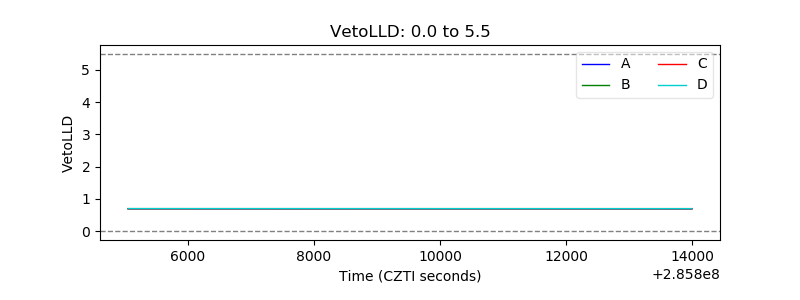 |
| Alpha Counter | 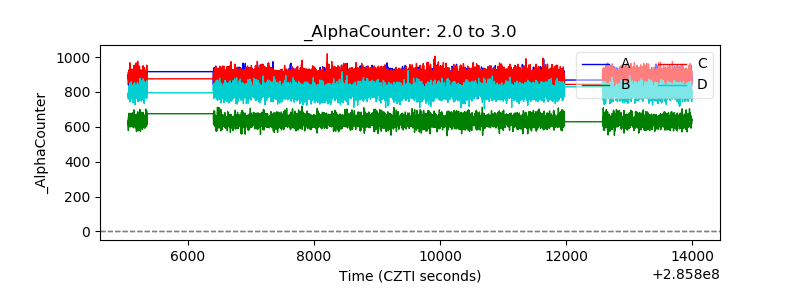 |
| _CPM_Rate | 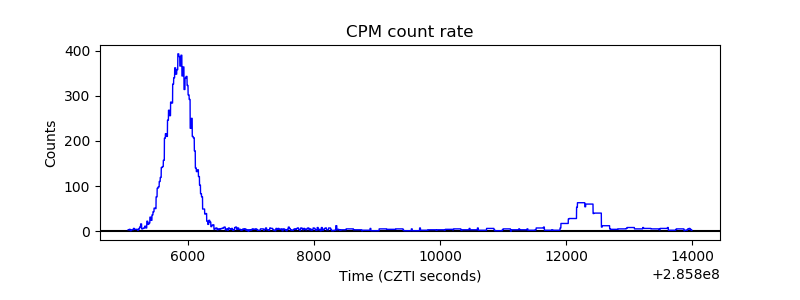 |
| CZT Counter | 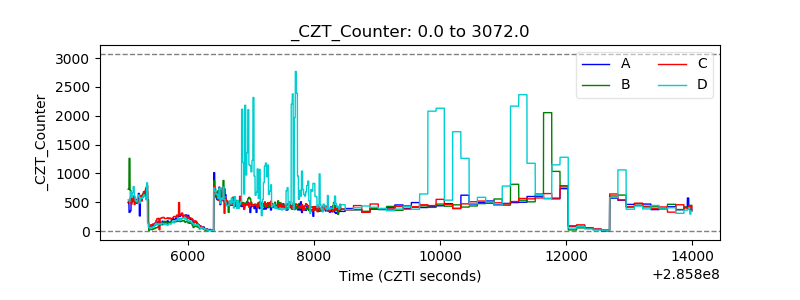 |
| +2.5 Volts monitor |  |
| +5 Volts monitor |  |
| _ROLL_ROT | 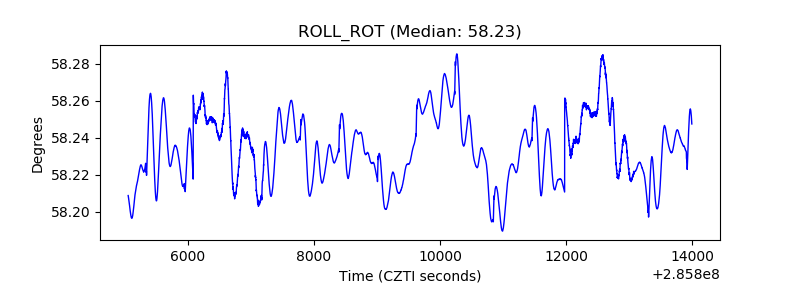 |
| _Roll_DEC | 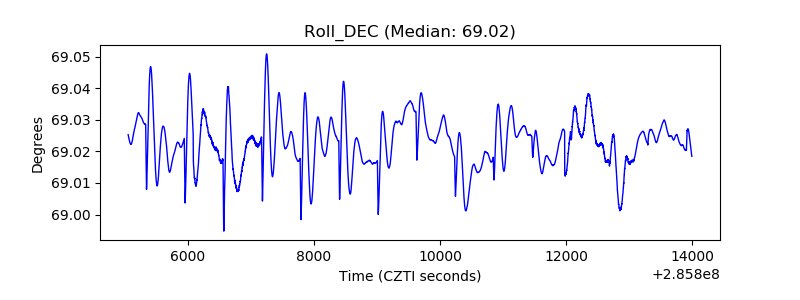 |
| _Roll_RA | 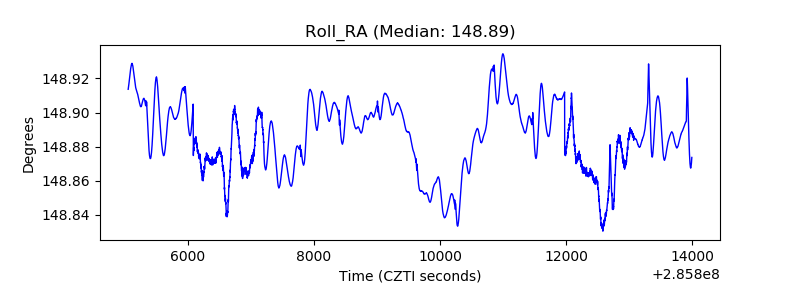 |
| Veto Counter | 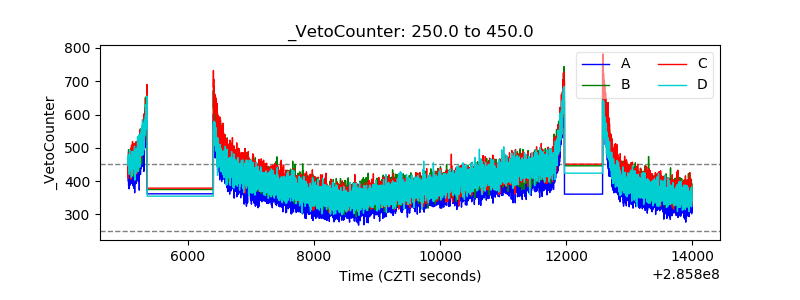 |