| Param | Original file | Final file |
|---|---|---|
| Filename | modeM0/AS1T03_025T01_9000002670_17938cztM0_level2.evt | modeM0/AS1T03_025T01_9000002670_17938cztM0_level2_quad_clean.evt |
| Size (bytes) | 488,162,880 | 116,213,760 |
| Size | 465.5 MB | 110.8 MB |
| Events in quadrant A | 3,463,945 | 757,171 |
| Events in quadrant B | 3,525,643 | 777,098 |
| Events in quadrant C | 3,414,422 | 743,147 |
| Events in quadrant D | 3,874,409 | 724,571 |
| Mode SS | |||
|---|---|---|---|
| Quadrant | BADHDUFLAG | Total packets | Discarded packets |
| A | 0 | 152 | 0 |
| B | 0 | 152 | 0 |
| C | 0 | 152 | 0 |
| D | 0 | 152 | 0 |
| Mode M0 | |||
|---|---|---|---|
| Quadrant | BADHDUFLAG | Total packets | Discarded packets |
| A | 0 | 15537 | 2 |
| B | 0 | 15754 | 2 |
| C | 0 | 15269 | 2 |
| D | 0 | 16880 | 2 |
| Mode M9 | |||
|---|---|---|---|
| Quadrant | BADHDUFLAG | Total packets | Discarded packets |
| A | 0 | 7 | 0 |
| B | 0 | 8 | 0 |
| C | 0 | 8 | 0 |
| D | 0 | 8 | 0 |
| Quadrant | Total seconds | Saturated seconds | Saturation percentage |
|---|---|---|---|
| A | 7436 | 20 | 0.268962% |
| B | 7436 | 53 | 0.712749% |
| C | 7436 | 53 | 0.712749% |
| D | 7436 | 123 | 1.654115% |
Noise dominated data is calculated using 1-second bins in cleaned event files. If a bin has >2000 counts, and if more than 50% of those come from <1% of pixels, then it is considered to be noise-dominated and hence unusable.
| Quadrant | # 1 sec bins | Bins with >0 counts | Bins with >2000 counts | High rate bins dominated by noise | Noise dominated (total time) | Noise dominated (detector-on time) | Marked lightcurve |
|---|---|---|---|---|---|---|---|
| A | 7811 | 7437 | 0 | 0 | 0.00% | 0.00% | 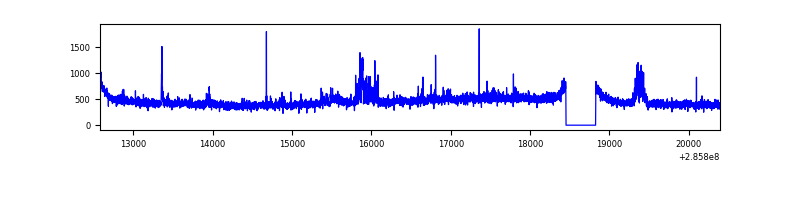 |
| B | 7811 | 7437 | 3 | 3 | 0.04% | 0.04% | 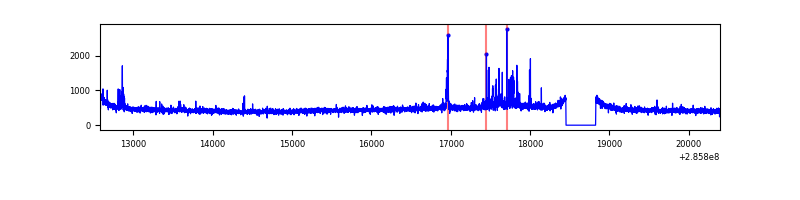 |
| C | 7811 | 7437 | 0 | 0 | 0.00% | 0.00% | 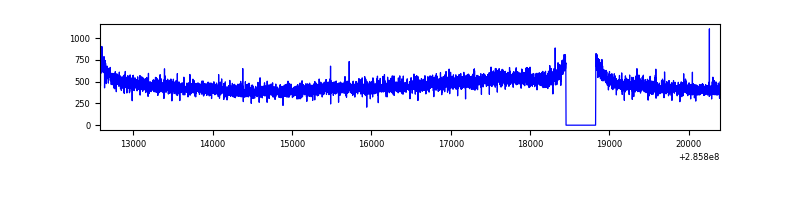 |
| D | 7811 | 7437 | 69 | 69 | 0.88% | 0.93% | 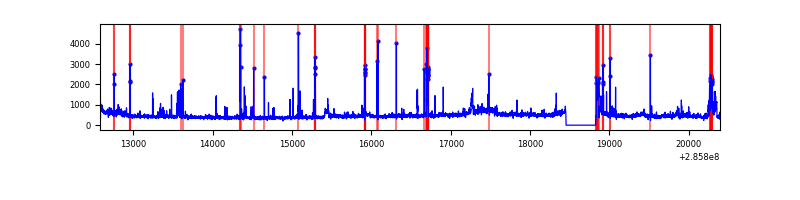 |
Top three noisy pixels from each quadrant. If the there are fewer than three noisy pixels in the level2.evt file, extra rows are filled as -1
| Pixel properties | Quadrant properties | ||||||
|---|---|---|---|---|---|---|---|
| Quadrant | DetID | PixID | Counts | Sigma | Mean | Median | Sigma |
| A | 15 | 174 | 147591 | 846.27 | 856 | 837 | 173.4 |
| A | 4 | 2 | 19884 | 109.84 | 856 | 837 | 173.4 |
| A | 0 | 226 | 7378 | 37.72 | 856 | 837 | 173.4 |
| B | 0 | 197 | 70348 | 424.7 | 864 | 839 | 163.7 |
| B | 0 | 190 | 35192 | 209.9 | 864 | 839 | 163.7 |
| B | 12 | 111 | 19802 | 115.86 | 864 | 839 | 163.7 |
| C | 14 | 238 | 128999 | 654.48 | 832 | 835 | 195.8 |
| C | 5 | 218 | 12670 | 60.44 | 832 | 835 | 195.8 |
| C | 3 | 233 | 10144 | 47.54 | 832 | 835 | 195.8 |
| D | 7 | 238 | 387640 | 1928.37 | 824 | 798 | 200.6 |
| D | 5 | 222 | 96441 | 476.77 | 824 | 798 | 200.6 |
| D | 10 | 70 | 73971 | 364.76 | 824 | 798 | 200.6 |
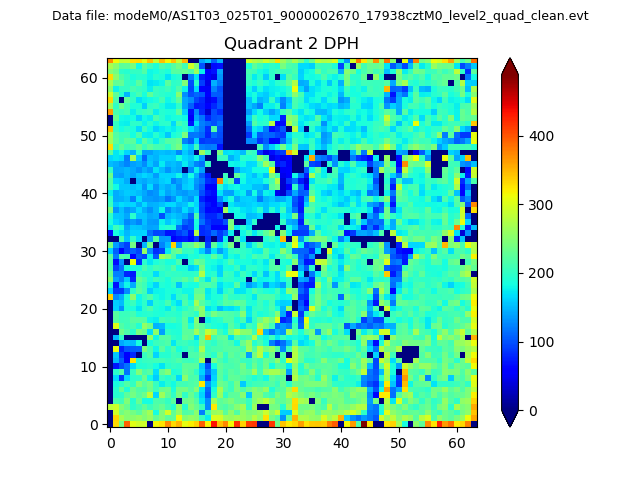
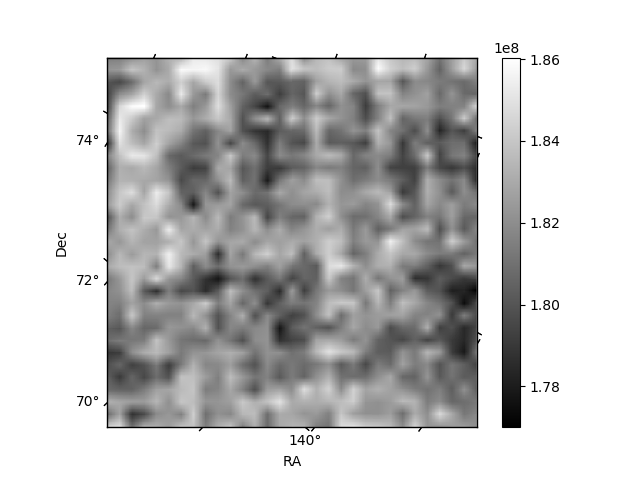
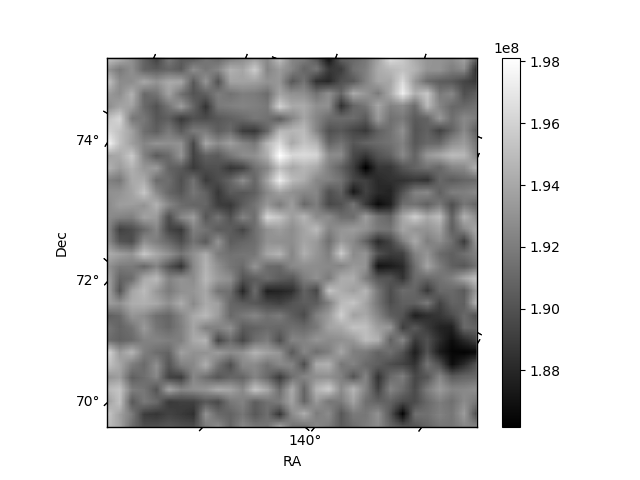
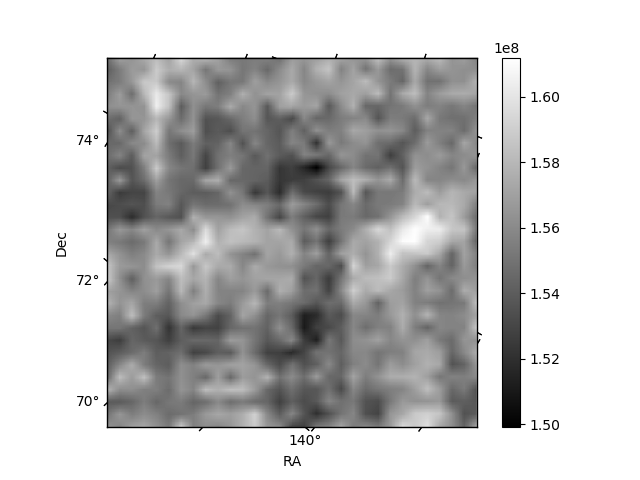
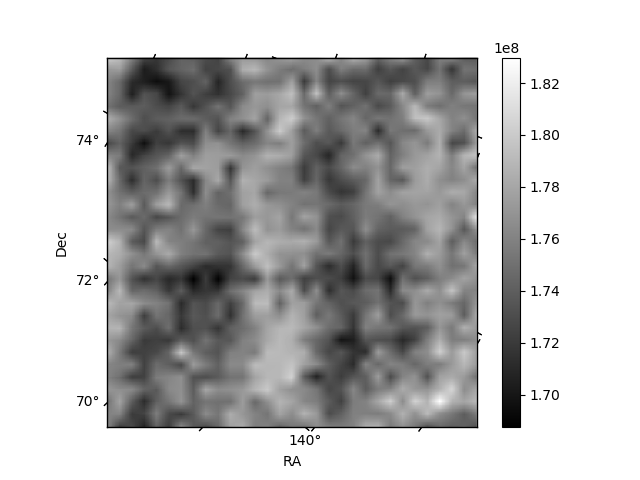
Histogram calculated using DETX and DETY for each event in the final _common_clean file
| Quadrant A | 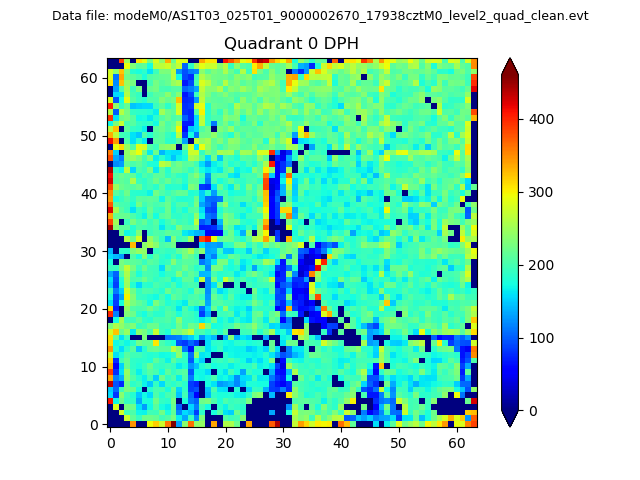 |
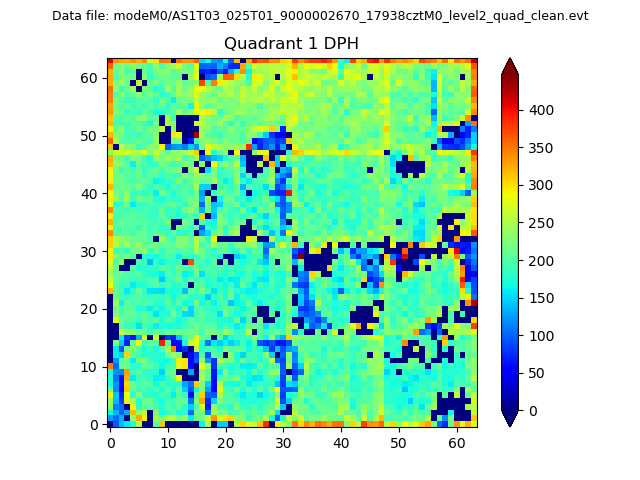 |
Quadrant B |
|---|---|---|---|
| Quadrant D | 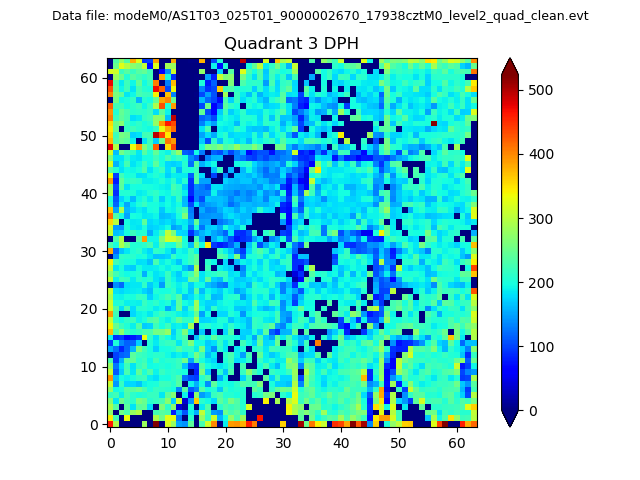 |
 |
Quadrant C |
| Plot type | Count rate plots | Images |
|---|---|---|
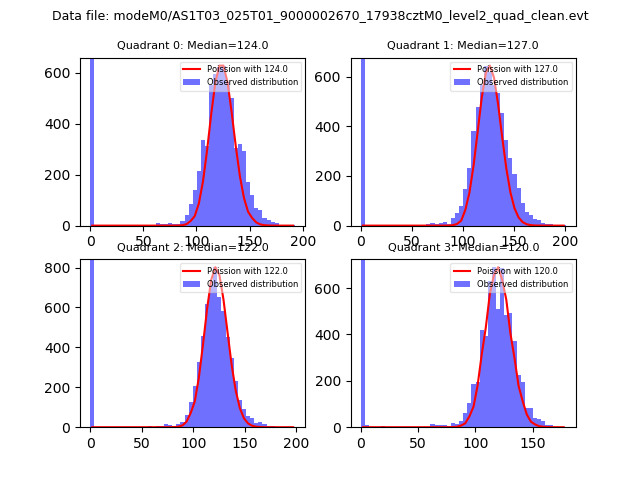
| Comparison with Poisson distribution Blue bars denote a histogram of data divided into 1 sec bins. Red curve is a Poisson curve with rate = median count rate of data. |
 |
 |
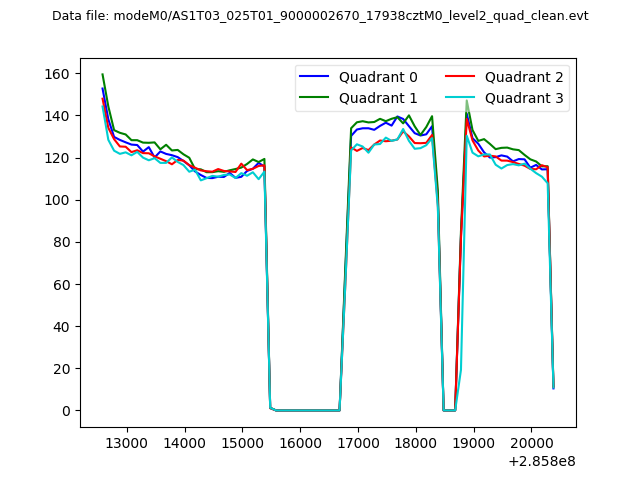
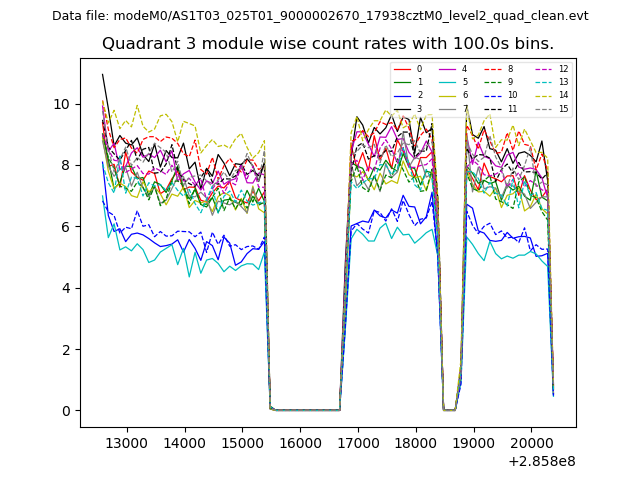
| Quadrant-wise count rates Data is divided into 100 sec bins |
 |
|
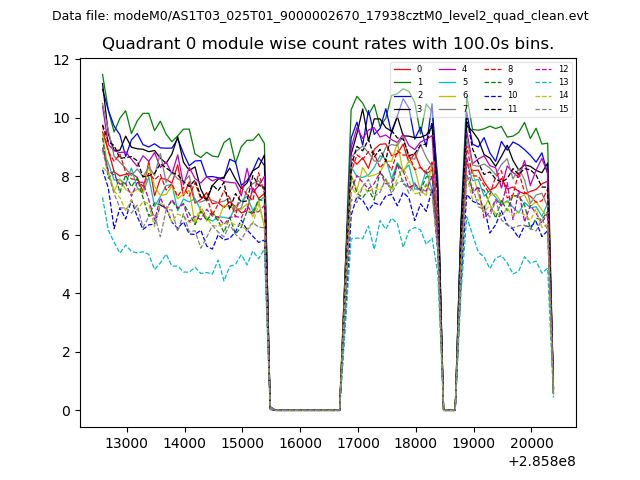
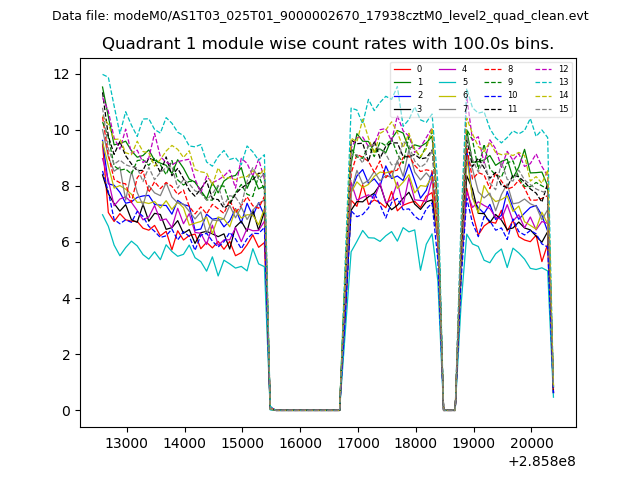
| Module-wise count rates for Quadrant A Data is divided into 100 sec bins |
 |
 |
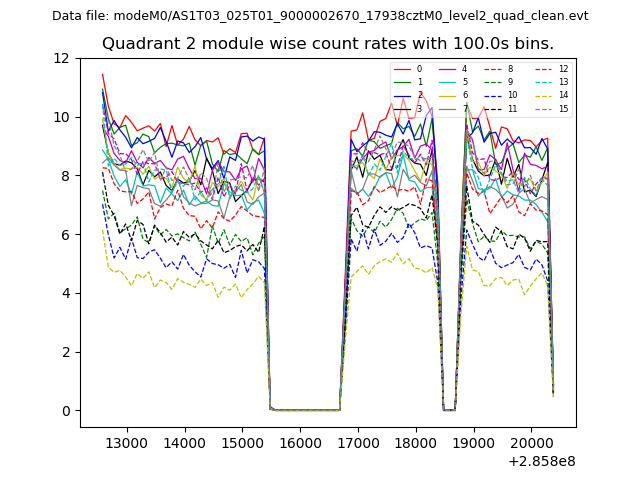
| Module-wise count rates for Quadrant B Data is divided into 100 sec bins |
 |
 |
| Module-wise count rates for Quadrant C Data is divided into 100 sec bins |
 |
 |
| Module-wise count rates for Quadrant D Data is divided into 100 sec bins |
 |
 |
| Parameter | Plot |
|---|---|
| CZT HV Monitor | 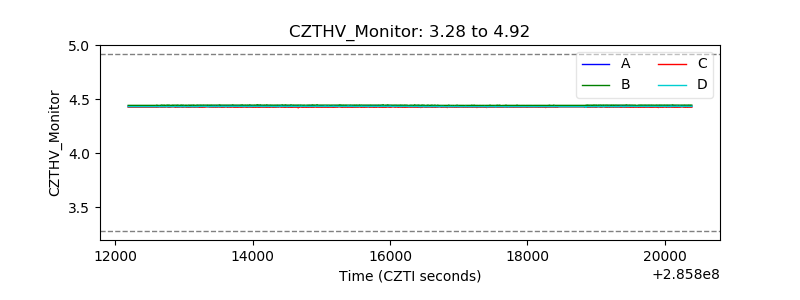 |
| D_VDD | 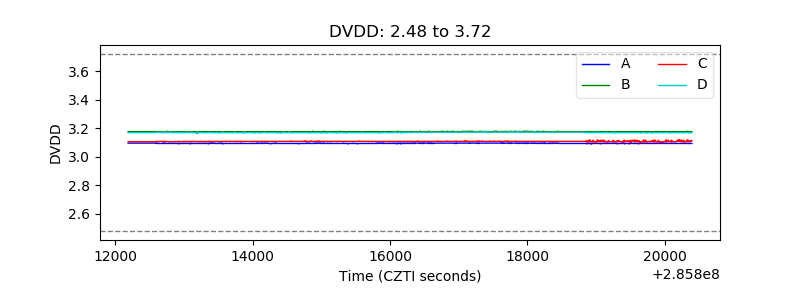 |
| Temperature 1 | 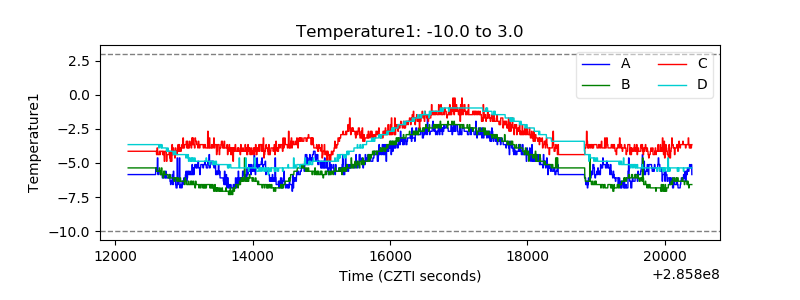 |
| Veto HV Monitor | 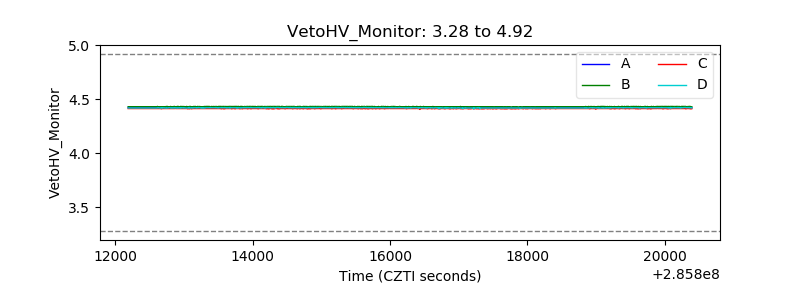 |
| Veto LLD | 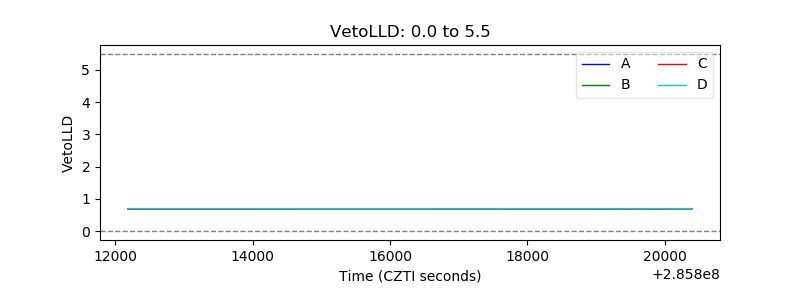 |
| Alpha Counter | 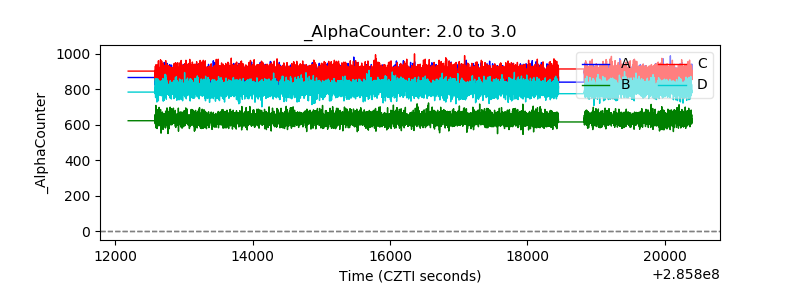 |
| _CPM_Rate | 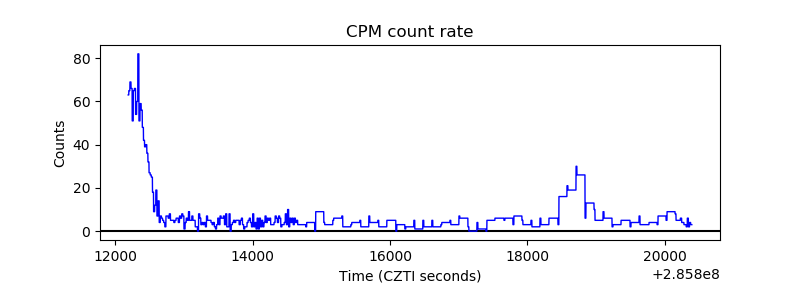 |
| CZT Counter | 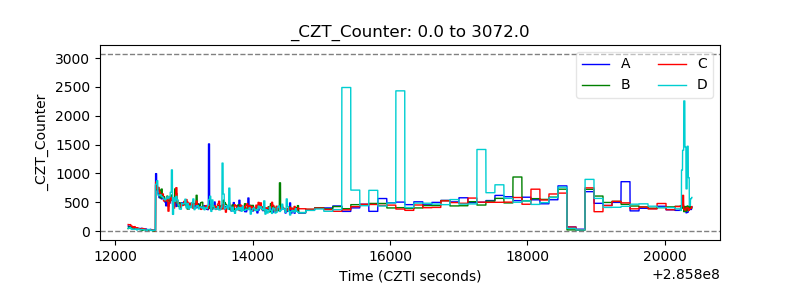 |
| +2.5 Volts monitor |  |
| +5 Volts monitor | 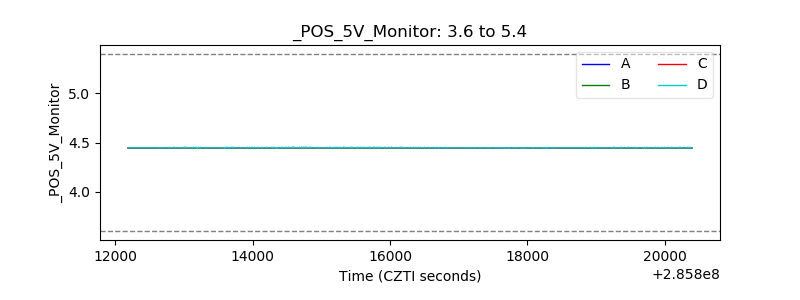 |
| _ROLL_ROT |  |
| _Roll_DEC | 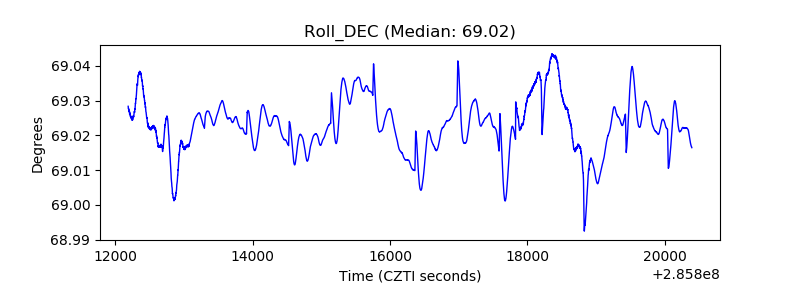 |
| _Roll_RA | 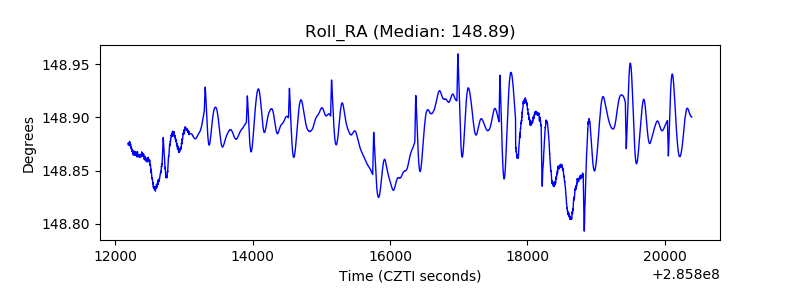 |
| Veto Counter |  |