| Param | Original file | Final file |
|---|---|---|
| Filename | modeM0/AS1T03_025T01_9000002670_17939cztM0_level2.evt | modeM0/AS1T03_025T01_9000002670_17939cztM0_level2_quad_clean.evt |
| Size (bytes) | 534,263,040 | 120,611,520 |
| Size | 509.5 MB | 115.0 MB |
| Events in quadrant A | 3,484,956 | 787,575 |
| Events in quadrant B | 3,558,947 | 810,584 |
| Events in quadrant C | 3,580,742 | 775,356 |
| Events in quadrant D | 5,030,231 | 741,260 |
| Mode SS | |||
|---|---|---|---|
| Quadrant | BADHDUFLAG | Total packets | Discarded packets |
| A | 0 | 158 | 0 |
| B | 0 | 158 | 0 |
| C | 0 | 158 | 0 |
| D | 0 | 158 | 0 |
| Mode M0 | |||
|---|---|---|---|
| Quadrant | BADHDUFLAG | Total packets | Discarded packets |
| A | 0 | 15912 | 2 |
| B | 0 | 15938 | 2 |
| C | 0 | 15952 | 2 |
| D | 0 | 20290 | 2 |
| Mode M9 | |||
|---|---|---|---|
| Quadrant | BADHDUFLAG | Total packets | Discarded packets |
| A | 0 | 7 | 0 |
| B | 0 | 7 | 0 |
| C | 0 | 7 | 0 |
| D | 0 | 7 | 0 |
| Quadrant | Total seconds | Saturated seconds | Saturation percentage |
|---|---|---|---|
| A | 7739 | 42 | 0.542706% |
| B | 7739 | 69 | 0.891588% |
| C | 7739 | 68 | 0.878666% |
| D | 7739 | 319 | 4.121980% |
Noise dominated data is calculated using 1-second bins in cleaned event files. If a bin has >2000 counts, and if more than 50% of those come from <1% of pixels, then it is considered to be noise-dominated and hence unusable.
| Quadrant | # 1 sec bins | Bins with >0 counts | Bins with >2000 counts | High rate bins dominated by noise | Noise dominated (total time) | Noise dominated (detector-on time) | Marked lightcurve |
|---|---|---|---|---|---|---|---|
| A | 8429 | 7741 | 0 | 0 | 0.00% | 0.00% | 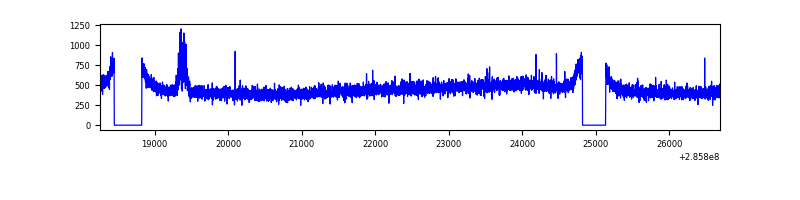 |
| B | 8429 | 7741 | 0 | 0 | 0.00% | 0.00% | 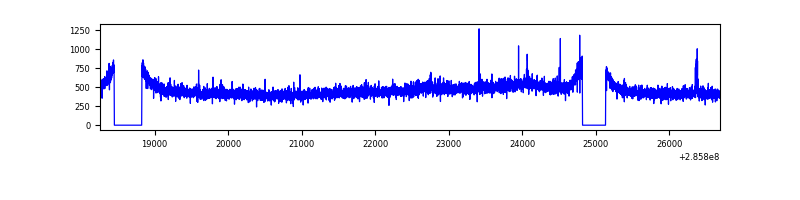 |
| C | 8429 | 7741 | 0 | 0 | 0.00% | 0.00% | 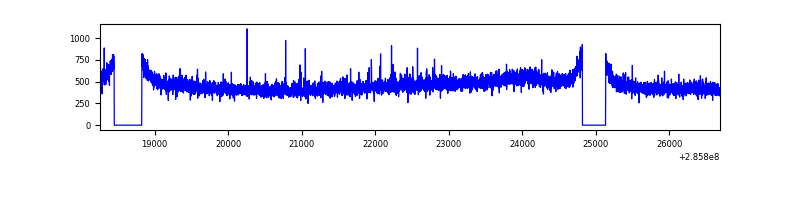 |
| D | 8429 | 7741 | 283 | 283 | 3.36% | 3.66% | 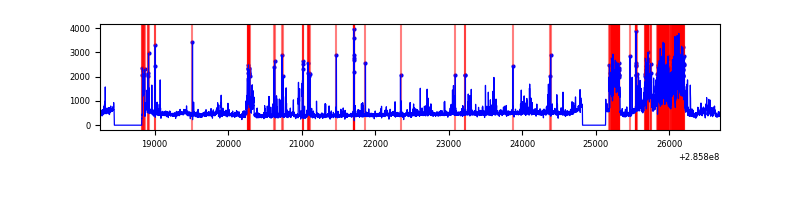 |
Top three noisy pixels from each quadrant. If the there are fewer than three noisy pixels in the level2.evt file, extra rows are filled as -1
| Pixel properties | Quadrant properties | ||||||
|---|---|---|---|---|---|---|---|
| Quadrant | DetID | PixID | Counts | Sigma | Mean | Median | Sigma |
| A | 15 | 174 | 45357 | 245.43 | 895 | 874 | 181.2 |
| A | 0 | 226 | 7583 | 37.02 | 895 | 874 | 181.2 |
| A | 3 | 137 | 7020 | 33.91 | 895 | 874 | 181.2 |
| B | 12 | 111 | 21193 | 117.03 | 905 | 880 | 173.6 |
| B | 11 | 111 | 18393 | 100.9 | 905 | 880 | 173.6 |
| B | 14 | 111 | 15152 | 82.23 | 905 | 880 | 173.6 |
| C | 14 | 238 | 133577 | 650.94 | 866 | 870 | 203.9 |
| C | 9 | 160 | 21709 | 102.22 | 866 | 870 | 203.9 |
| C | 9 | 176 | 17130 | 79.76 | 866 | 870 | 203.9 |
| D | 7 | 238 | 1342693 | 6420.03 | 858 | 831 | 209.0 |
| D | 5 | 222 | 294858 | 1406.75 | 858 | 831 | 209.0 |
| D | 10 | 70 | 55352 | 260.85 | 858 | 831 | 209.0 |
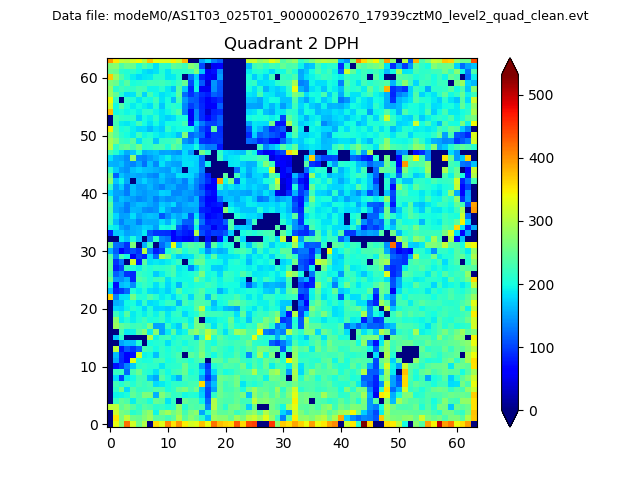
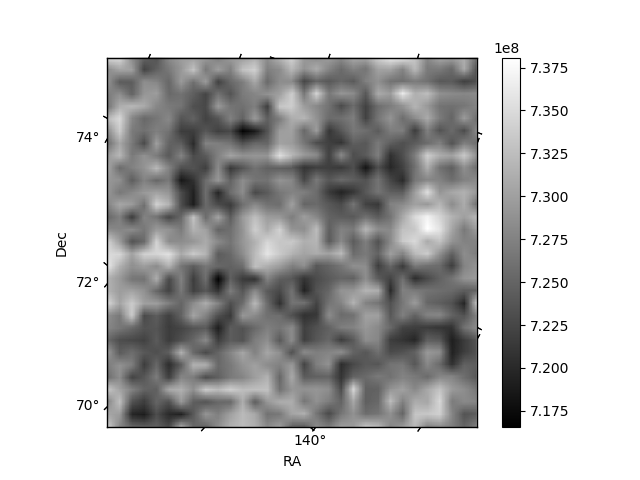
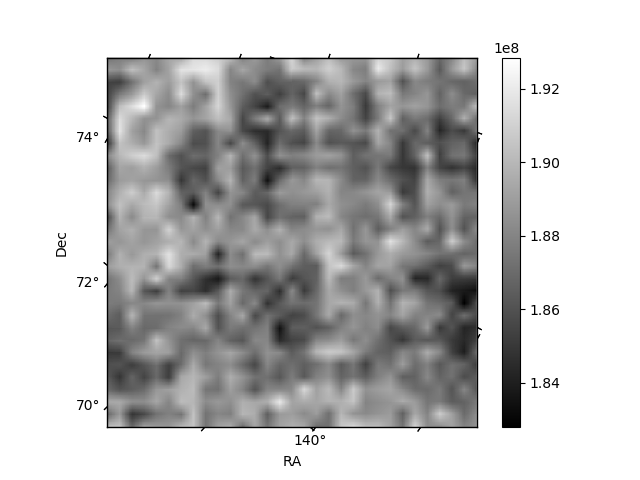
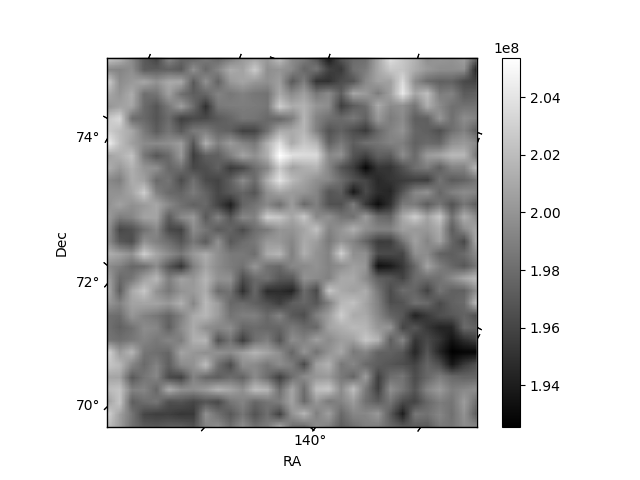
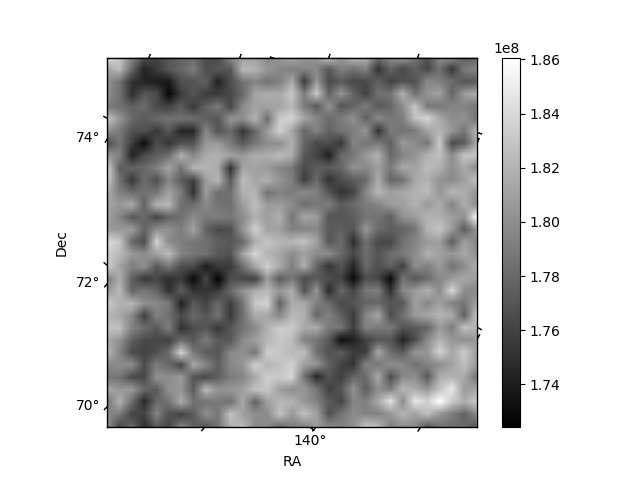
Histogram calculated using DETX and DETY for each event in the final _common_clean file
| Quadrant A | 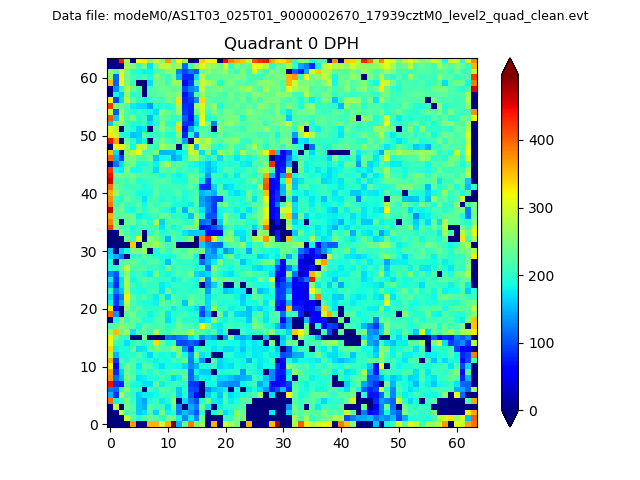 |
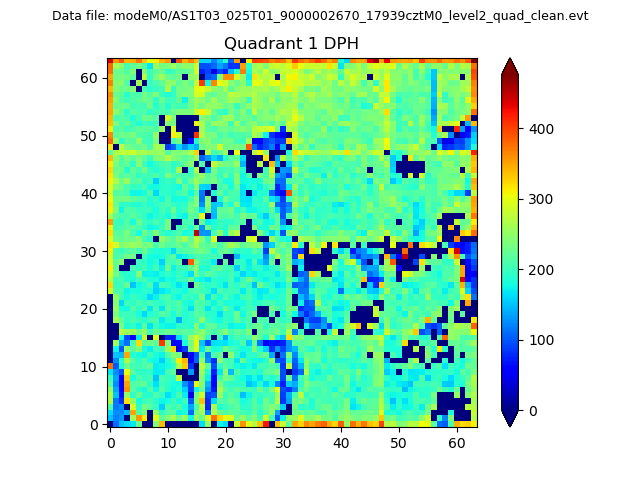 |
Quadrant B |
|---|---|---|---|
| Quadrant D | 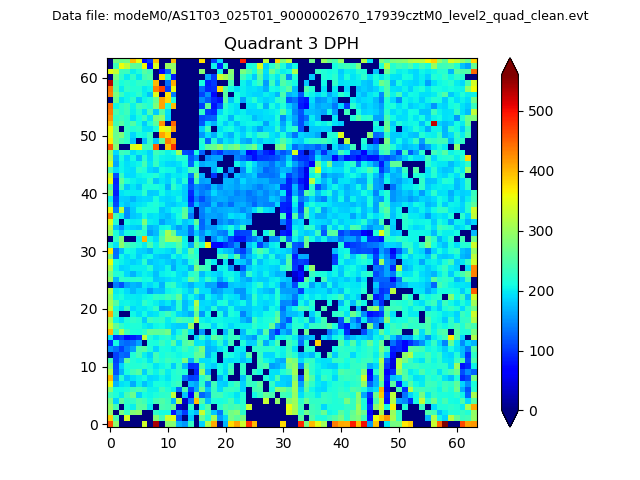 |
 |
Quadrant C |
| Plot type | Count rate plots | Images |
|---|---|---|
| Comparison with Poisson distribution Blue bars denote a histogram of data divided into 1 sec bins. Red curve is a Poisson curve with rate = median count rate of data. |
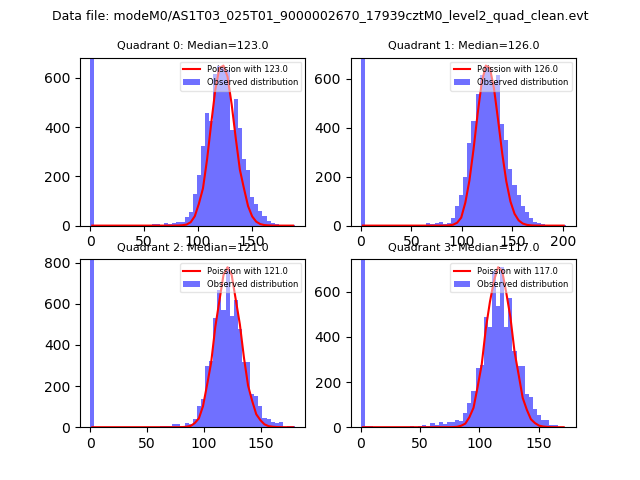 |
 |
| Quadrant-wise count rates Data is divided into 100 sec bins |
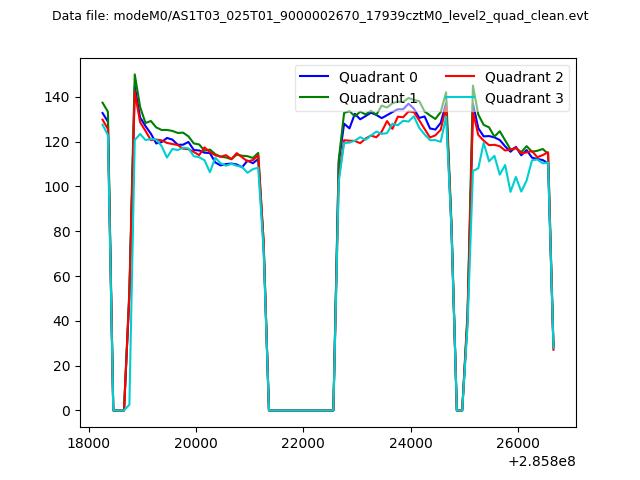 |
|
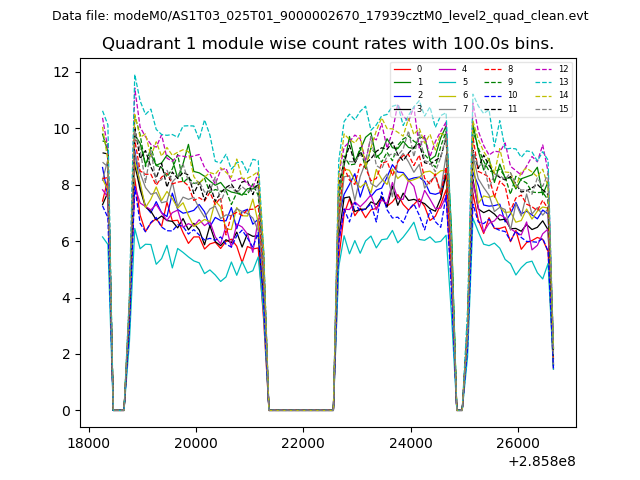
| Module-wise count rates for Quadrant A Data is divided into 100 sec bins |
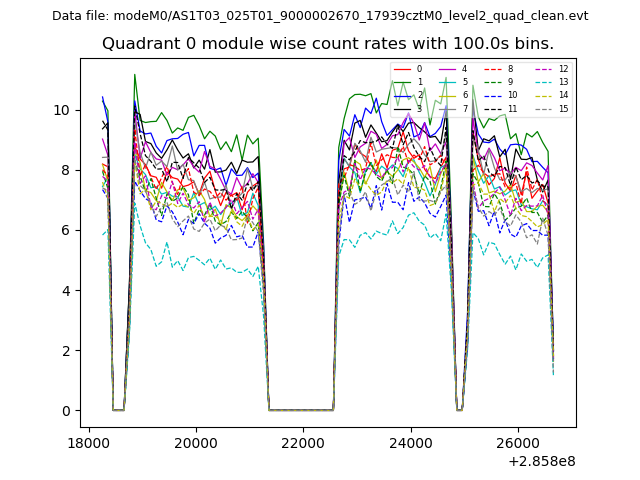 |
 |
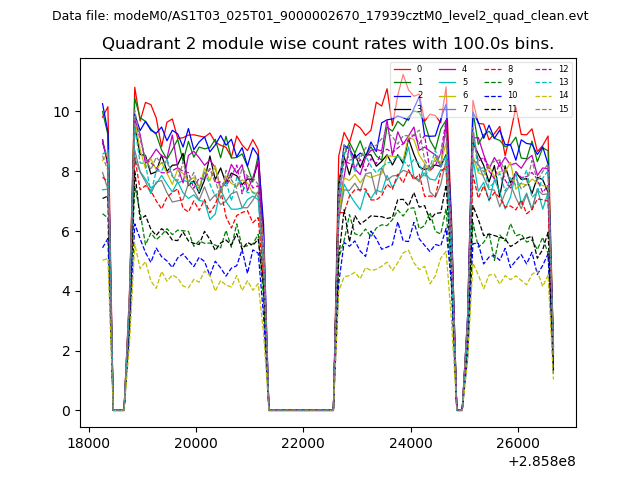
| Module-wise count rates for Quadrant B Data is divided into 100 sec bins |
 |
 |
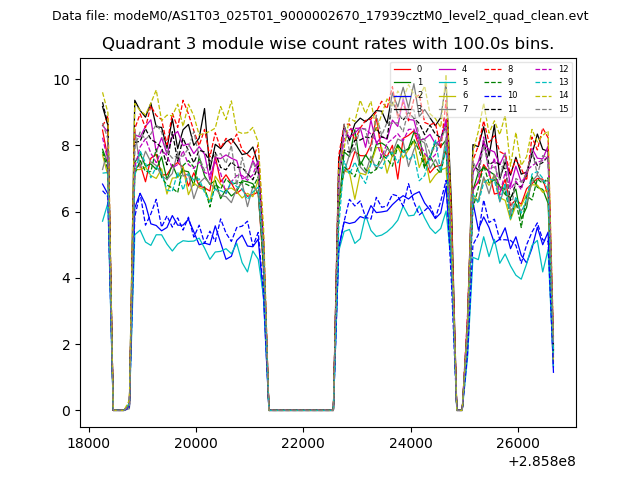
| Module-wise count rates for Quadrant C Data is divided into 100 sec bins |
 |
 |
| Module-wise count rates for Quadrant D Data is divided into 100 sec bins |
 |
 |
| Parameter | Plot |
|---|---|
| CZT HV Monitor | 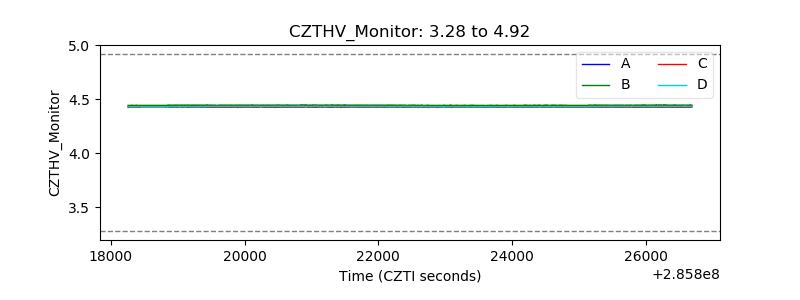 |
| D_VDD | 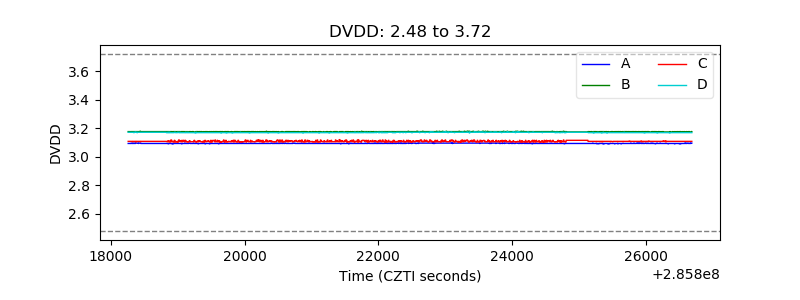 |
| Temperature 1 | 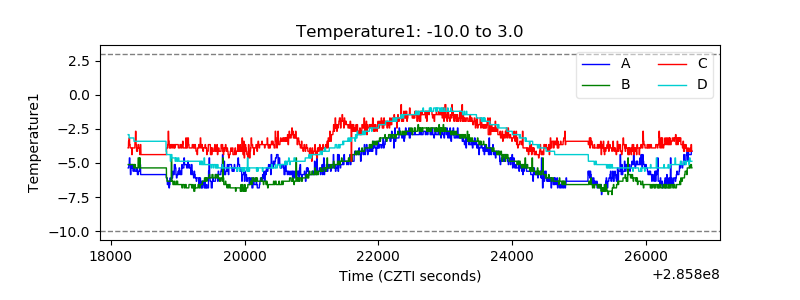 |
| Veto HV Monitor |  |
| Veto LLD | 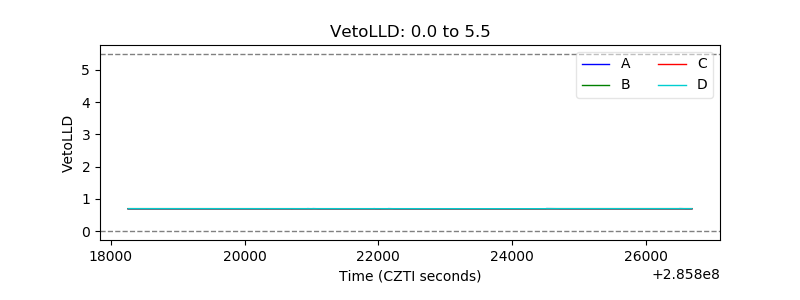 |
| Alpha Counter | 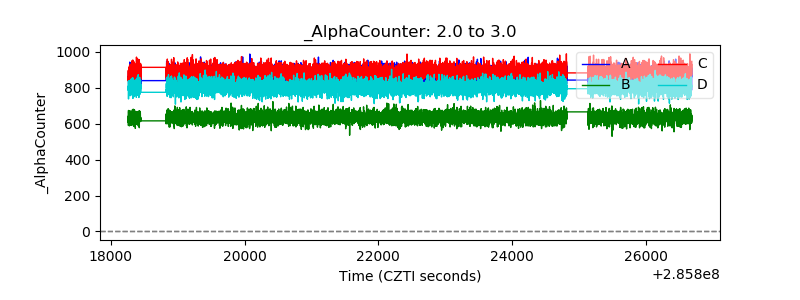 |
| _CPM_Rate | 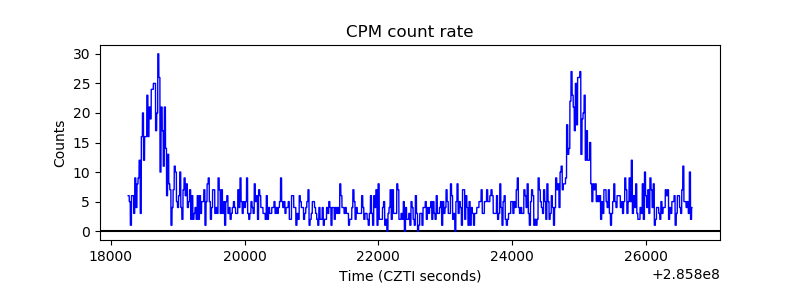 |
| CZT Counter | 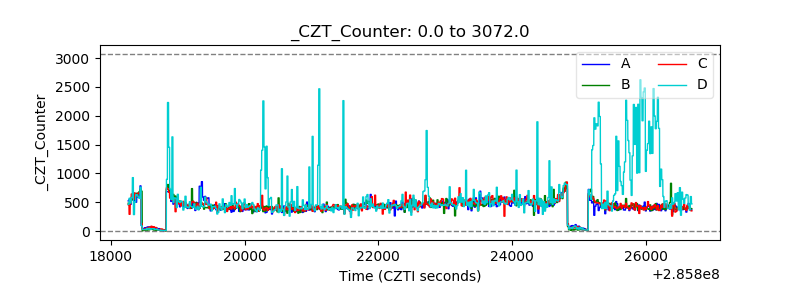 |
| +2.5 Volts monitor |  |
| +5 Volts monitor |  |
| _ROLL_ROT | 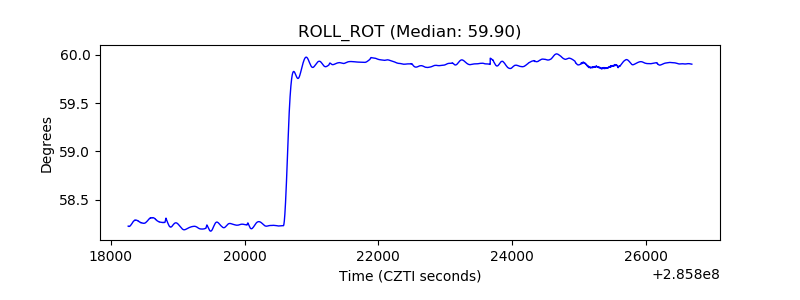 |
| _Roll_DEC | 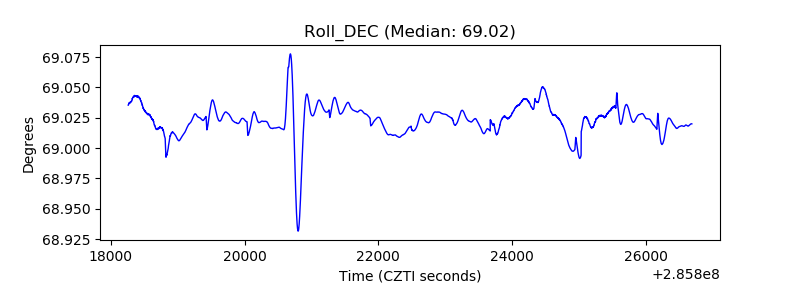 |
| _Roll_RA | 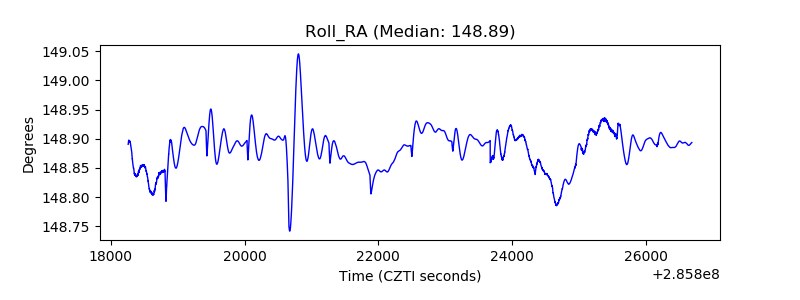 |
| Veto Counter | 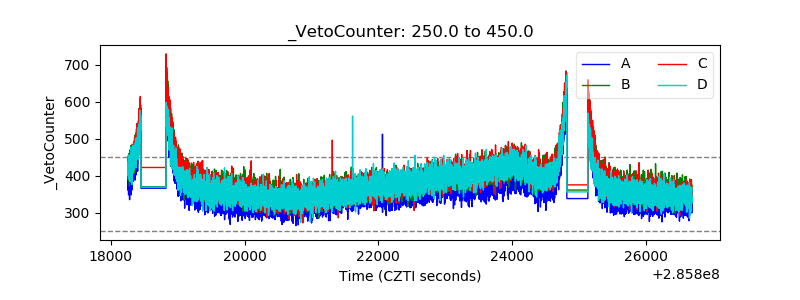 |