| Param | Original file | Final file |
|---|---|---|
| Filename | modeM0/AS1T03_025T01_9000002670_17942cztM0_level2.evt | modeM0/AS1T03_025T01_9000002670_17942cztM0_level2_quad_clean.evt |
| Size (bytes) | 1,417,538,880 | 268,827,840 |
| Size | 1.3 GB | 256.4 MB |
| Events in quadrant A | 9,426,157 | 1,743,253 |
| Events in quadrant B | 8,755,780 | 1,792,928 |
| Events in quadrant C | 8,808,511 | 1,702,117 |
| Events in quadrant D | 14,658,654 | 1,597,459 |
| Mode SS | |||
|---|---|---|---|
| Quadrant | BADHDUFLAG | Total packets | Discarded packets |
| A | 0 | 388 | 0 |
| B | 0 | 388 | 0 |
| C | 0 | 388 | 0 |
| D | 0 | 388 | 0 |
| Mode M0 | |||
|---|---|---|---|
| Quadrant | BADHDUFLAG | Total packets | Discarded packets |
| A | 0 | 40871 | 4 |
| B | 0 | 38561 | 4 |
| C | 0 | 38808 | 4 |
| D | 0 | 56558 | 4 |
| Mode M9 | |||
|---|---|---|---|
| Quadrant | BADHDUFLAG | Total packets | Discarded packets |
| A | 0 | 22 | 0 |
| B | 0 | 22 | 0 |
| C | 0 | 22 | 0 |
| D | 0 | 22 | 0 |
| Quadrant | Total seconds | Saturated seconds | Saturation percentage |
|---|---|---|---|
| A | 18953 | 340 | 1.793911% |
| B | 18953 | 201 | 1.060518% |
| C | 18952 | 224 | 1.181933% |
| D | 18953 | 1891 | 9.977312% |
Noise dominated data is calculated using 1-second bins in cleaned event files. If a bin has >2000 counts, and if more than 50% of those come from <1% of pixels, then it is considered to be noise-dominated and hence unusable.
| Quadrant | # 1 sec bins | Bins with >0 counts | Bins with >2000 counts | High rate bins dominated by noise | Noise dominated (total time) | Noise dominated (detector-on time) | Marked lightcurve |
|---|---|---|---|---|---|---|---|
| A | 21143 | 18956 | 113 | 113 | 0.53% | 0.60% | 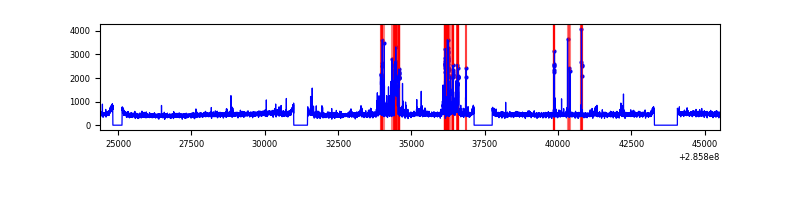 |
| B | 21143 | 18956 | 2 | 2 | 0.01% | 0.01% | 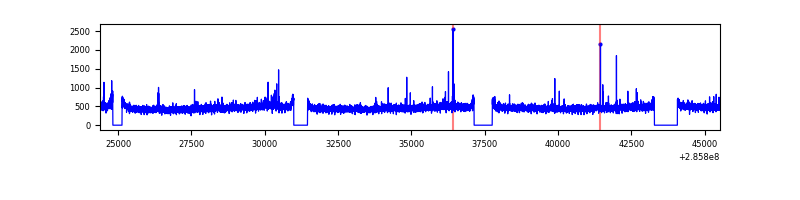 |
| C | 21142 | 18955 | 17 | 17 | 0.08% | 0.09% | 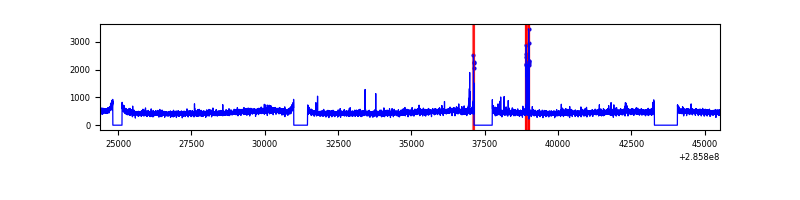 |
| D | 21143 | 18956 | 1336 | 1336 | 6.32% | 7.05% | 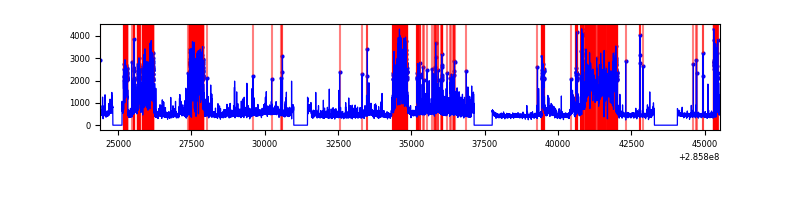 |
Top three noisy pixels from each quadrant. If the there are fewer than three noisy pixels in the level2.evt file, extra rows are filled as -1
| Pixel properties | Quadrant properties | ||||||
|---|---|---|---|---|---|---|---|
| Quadrant | DetID | PixID | Counts | Sigma | Mean | Median | Sigma |
| A | 15 | 174 | 938549 | 2101.78 | 2206 | 2156 | 445.5 |
| A | 0 | 226 | 19101 | 38.03 | 2206 | 2156 | 445.5 |
| A | 3 | 137 | 17189 | 33.74 | 2206 | 2156 | 445.5 |
| B | 12 | 111 | 52087 | 118.83 | 2222 | 2163 | 420.1 |
| B | 11 | 111 | 45169 | 102.36 | 2222 | 2163 | 420.1 |
| B | 14 | 111 | 38222 | 85.83 | 2222 | 2163 | 420.1 |
| C | 14 | 238 | 326156 | 652.51 | 2126 | 2134 | 496.6 |
| C | 9 | 54 | 116224 | 229.75 | 2126 | 2134 | 496.6 |
| C | 5 | 218 | 35636 | 67.47 | 2126 | 2134 | 496.6 |
| D | 7 | 238 | 5131135 | 10214.68 | 2078 | 2016 | 502.1 |
| D | 5 | 222 | 1011250 | 2009.9 | 2078 | 2016 | 502.1 |
| D | 10 | 70 | 232254 | 458.52 | 2078 | 2016 | 502.1 |
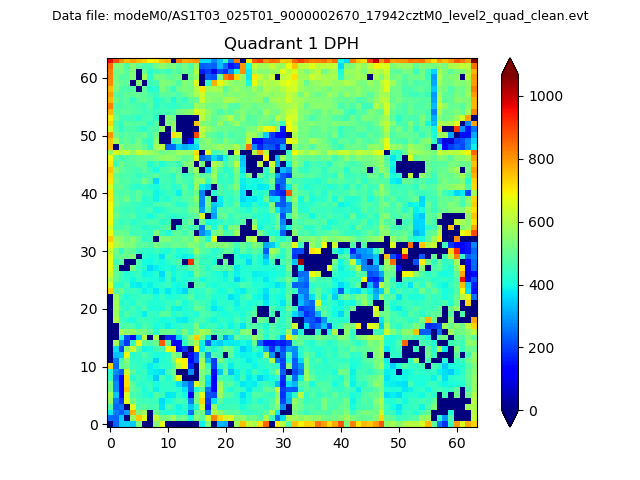
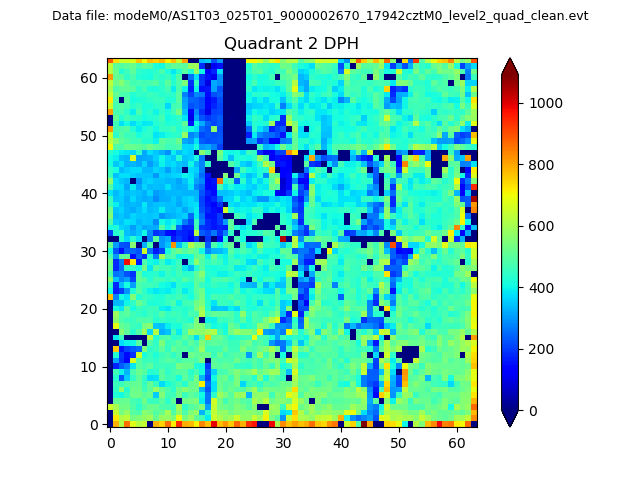
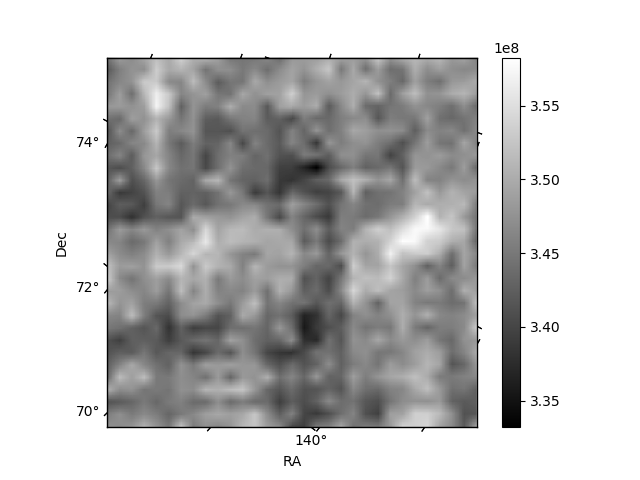
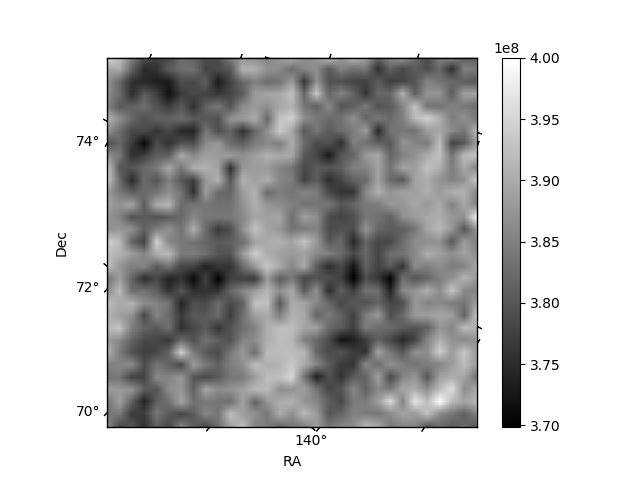
Histogram calculated using DETX and DETY for each event in the final _common_clean file
| Quadrant A |  |
 |
Quadrant B |
|---|---|---|---|
| Quadrant D |  |
 |
Quadrant C |
| Plot type | Count rate plots | Images |
|---|---|---|
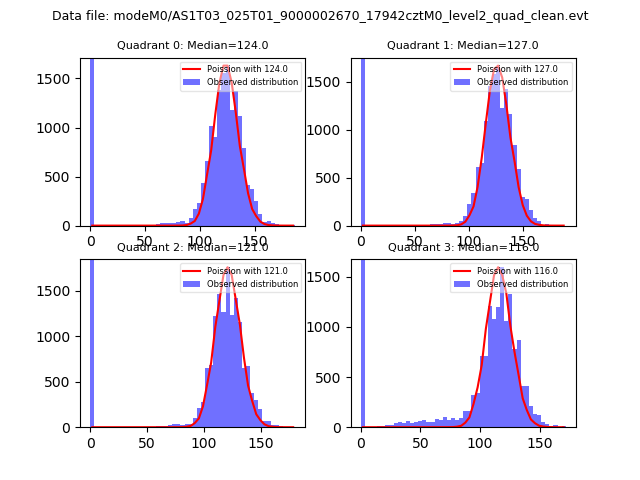
| Comparison with Poisson distribution Blue bars denote a histogram of data divided into 1 sec bins. Red curve is a Poisson curve with rate = median count rate of data. |
 |
 |
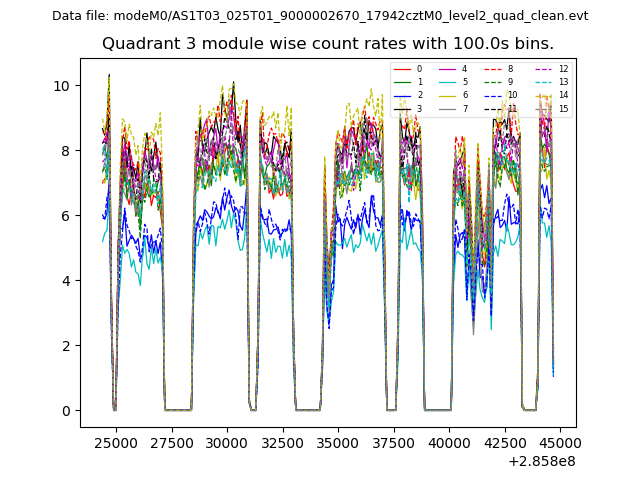
| Quadrant-wise count rates Data is divided into 100 sec bins |
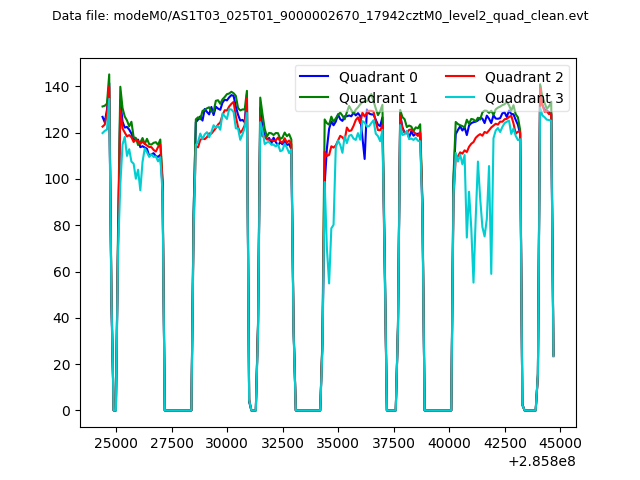 |
|
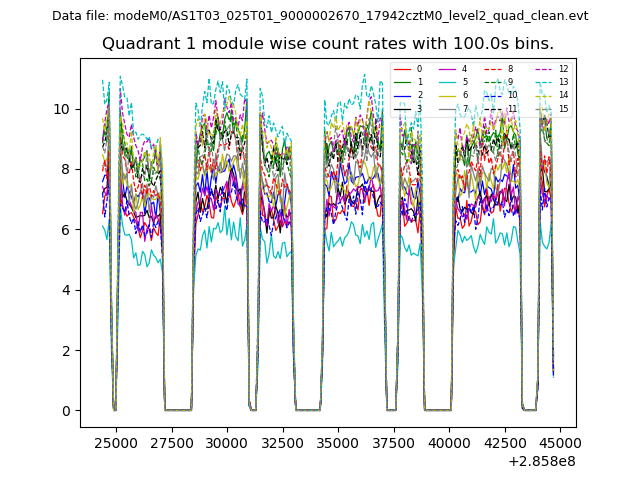
| Module-wise count rates for Quadrant A Data is divided into 100 sec bins |
 |
 |
| Module-wise count rates for Quadrant B Data is divided into 100 sec bins |
 |
 |
| Module-wise count rates for Quadrant C Data is divided into 100 sec bins |
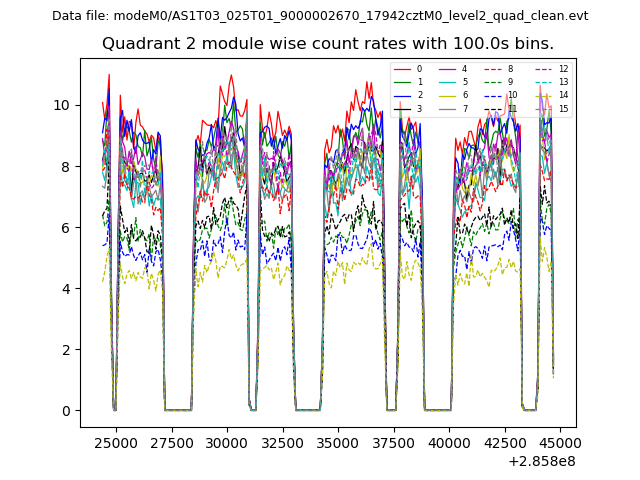 |
 |
| Module-wise count rates for Quadrant D Data is divided into 100 sec bins |
 |
 |
| Parameter | Plot |
|---|---|
| CZT HV Monitor |  |
| D_VDD | 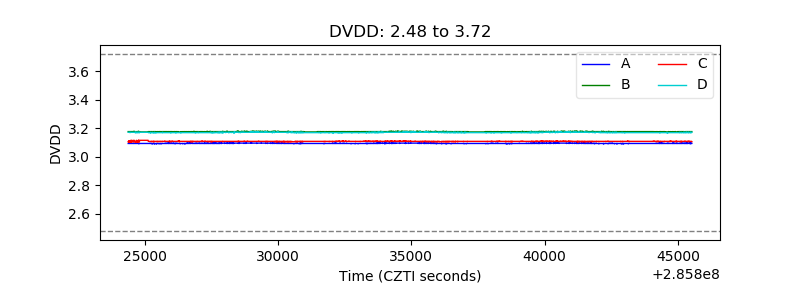 |
| Temperature 1 | 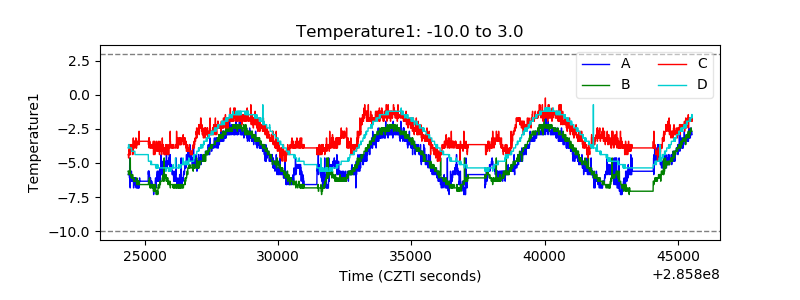 |
| Veto HV Monitor | 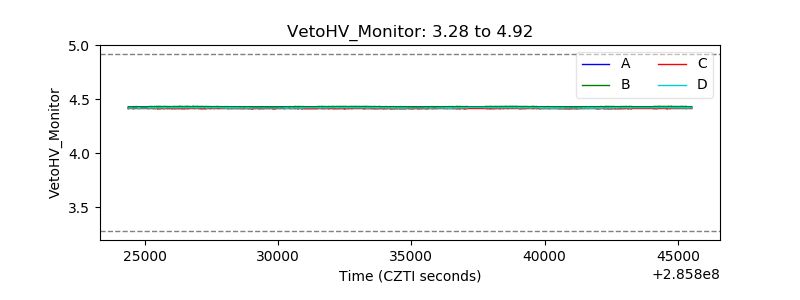 |
| Veto LLD | 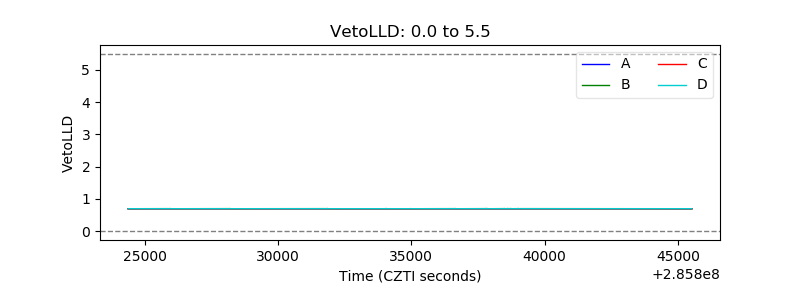 |
| Alpha Counter | 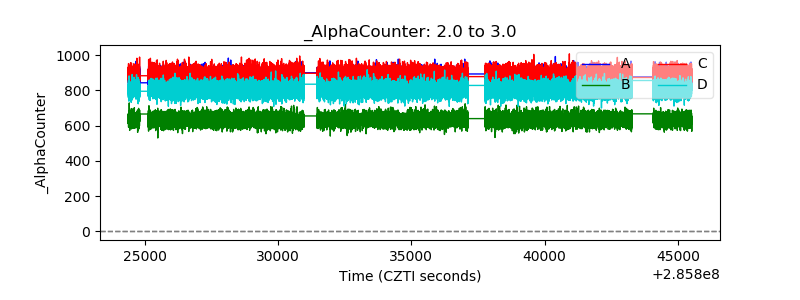 |
| _CPM_Rate | 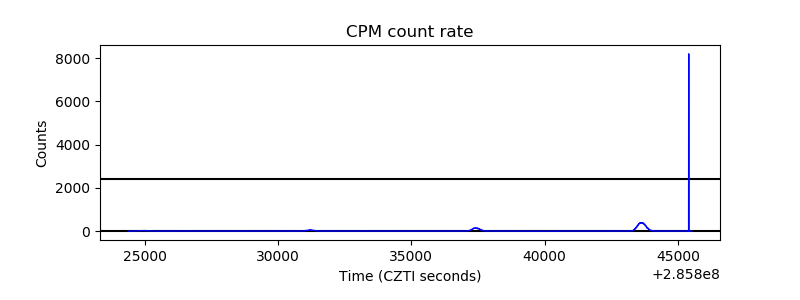 |
| CZT Counter | 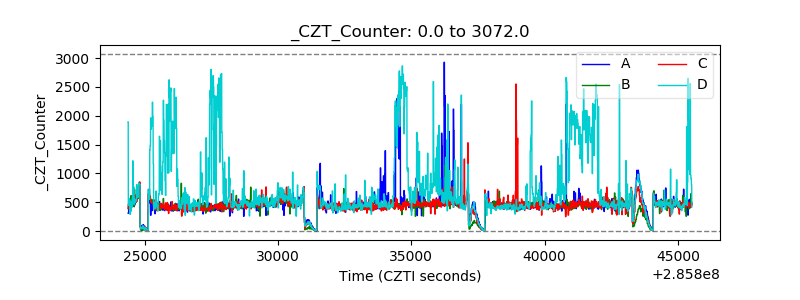 |
| +2.5 Volts monitor |  |
| +5 Volts monitor |  |
| _ROLL_ROT | 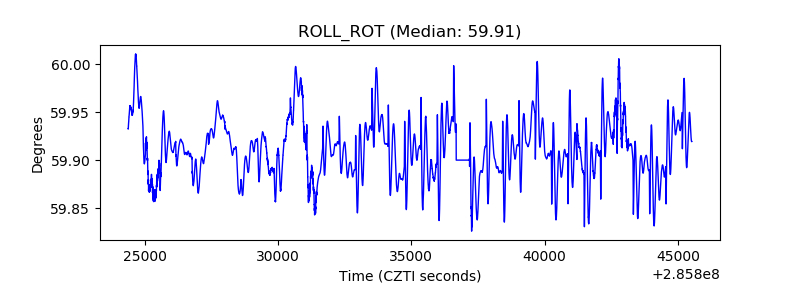 |
| _Roll_DEC | 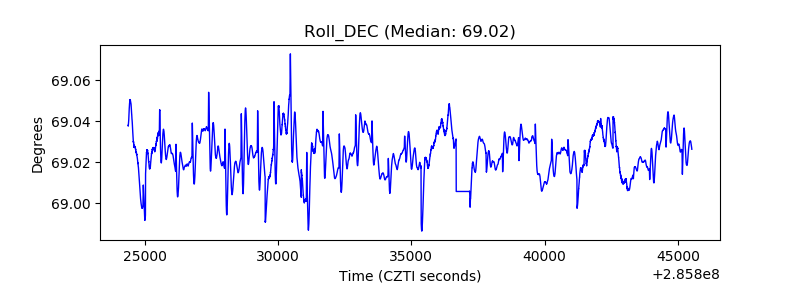 |
| _Roll_RA | 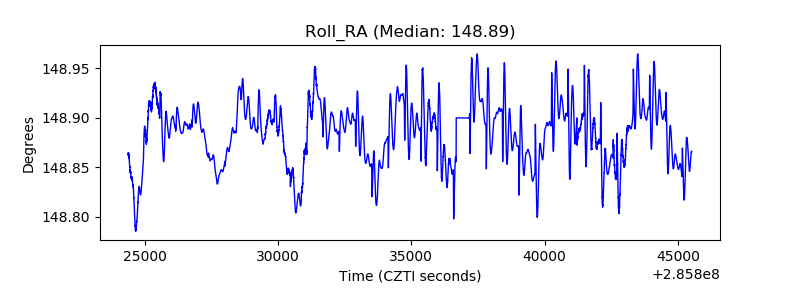 |
| Veto Counter | 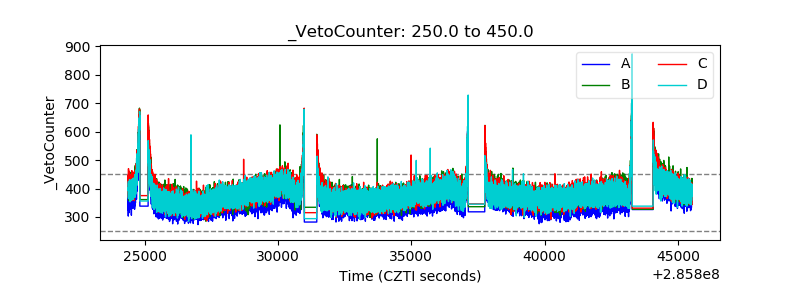 |