| Param | Original file | Final file |
|---|---|---|
| Filename | modeM0/AS1T03_025T01_9000002670_17943cztM0_level2.evt | modeM0/AS1T03_025T01_9000002670_17943cztM0_level2_quad_clean.evt |
| Size (bytes) | 462,715,200 | 84,168,000 |
| Size | 441.3 MB | 80.3 MB |
| Events in quadrant A | 3,487,943 | 526,399 |
| Events in quadrant B | 3,330,864 | 535,998 |
| Events in quadrant C | 3,258,507 | 505,450 |
| Events in quadrant D | 3,469,298 | 502,515 |
| Mode SS | |||
|---|---|---|---|
| Quadrant | BADHDUFLAG | Total packets | Discarded packets |
| A | 0 | 142 | 0 |
| B | 0 | 142 | 0 |
| C | 0 | 142 | 0 |
| D | 0 | 142 | 0 |
| Mode M0 | |||
|---|---|---|---|
| Quadrant | BADHDUFLAG | Total packets | Discarded packets |
| A | 0 | 14921 | 2 |
| B | 0 | 14159 | 2 |
| C | 0 | 13898 | 2 |
| D | 0 | 14899 | 2 |
| Mode M9 | |||
|---|---|---|---|
| Quadrant | BADHDUFLAG | Total packets | Discarded packets |
| A | 0 | 13 | 0 |
| B | 0 | 14 | 0 |
| C | 0 | 14 | 0 |
| D | 0 | 14 | 0 |
| Quadrant | Total seconds | Saturated seconds | Saturation percentage |
|---|---|---|---|
| A | 6858 | 76 | 1.108195% |
| B | 6858 | 61 | 0.889472% |
| C | 6858 | 74 | 1.079032% |
| D | 6858 | 86 | 1.254010% |
Noise dominated data is calculated using 1-second bins in cleaned event files. If a bin has >2000 counts, and if more than 50% of those come from <1% of pixels, then it is considered to be noise-dominated and hence unusable.
| Quadrant | # 1 sec bins | Bins with >0 counts | Bins with >2000 counts | High rate bins dominated by noise | Noise dominated (total time) | Noise dominated (detector-on time) | Marked lightcurve |
|---|---|---|---|---|---|---|---|
| A | 7818 | 6858 | 12 | 12 | 0.15% | 0.17% | 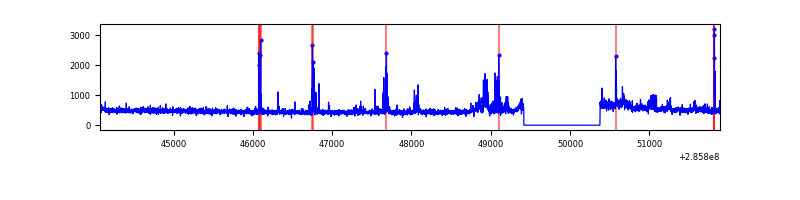 |
| B | 7818 | 6858 | 3 | 3 | 0.04% | 0.04% | 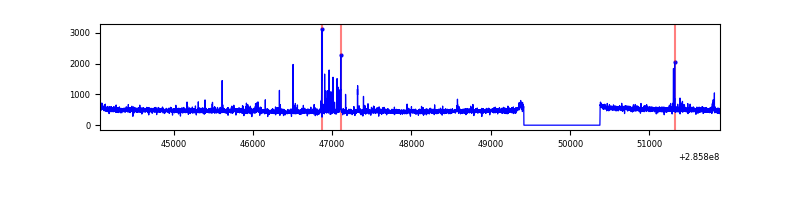 |
| C | 7818 | 6858 | 0 | 0 | 0.00% | 0.00% | 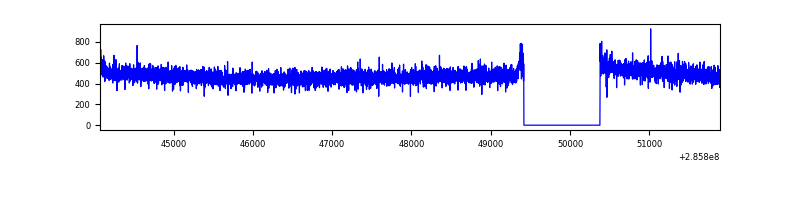 |
| D | 7818 | 6858 | 36 | 36 | 0.46% | 0.52% | 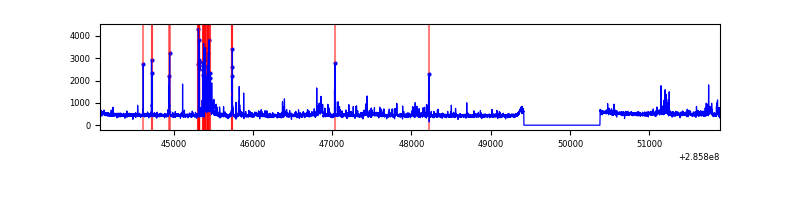 |
Top three noisy pixels from each quadrant. If the there are fewer than three noisy pixels in the level2.evt file, extra rows are filled as -1
| Pixel properties | Quadrant properties | ||||||
|---|---|---|---|---|---|---|---|
| Quadrant | DetID | PixID | Counts | Sigma | Mean | Median | Sigma |
| A | 15 | 174 | 314458 | 1879.86 | 826 | 807 | 166.8 |
| A | 0 | 226 | 7150 | 38.02 | 826 | 807 | 166.8 |
| A | 3 | 137 | 6427 | 33.68 | 826 | 807 | 166.8 |
| B | 0 | 197 | 37517 | 232.56 | 824 | 804 | 157.9 |
| B | 0 | 190 | 23865 | 146.08 | 824 | 804 | 157.9 |
| B | 4 | 216 | 19184 | 116.43 | 824 | 804 | 157.9 |
| C | 14 | 238 | 121416 | 659.86 | 784 | 789 | 182.8 |
| C | 5 | 218 | 55097 | 297.08 | 784 | 789 | 182.8 |
| C | 3 | 233 | 19255 | 101.01 | 784 | 789 | 182.8 |
| D | 5 | 222 | 200276 | 1017.36 | 798 | 773 | 196.1 |
| D | 7 | 238 | 98236 | 497.01 | 798 | 773 | 196.1 |
| D | 14 | 34 | 55124 | 277.16 | 798 | 773 | 196.1 |
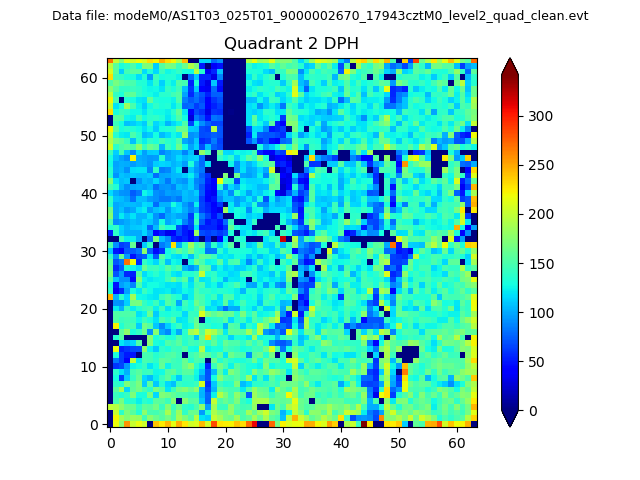
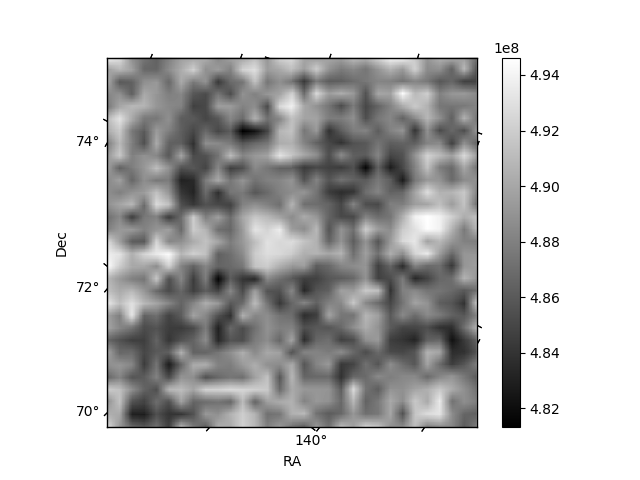
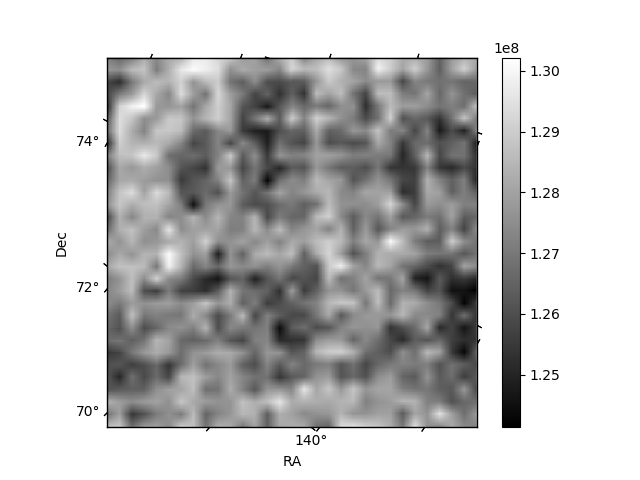
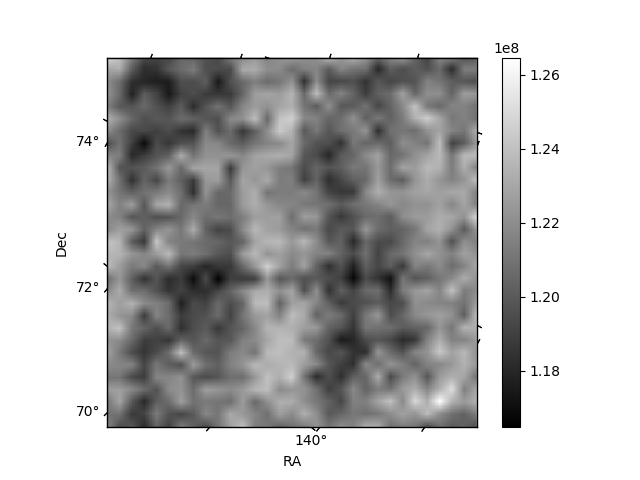
Histogram calculated using DETX and DETY for each event in the final _common_clean file
| Quadrant A | 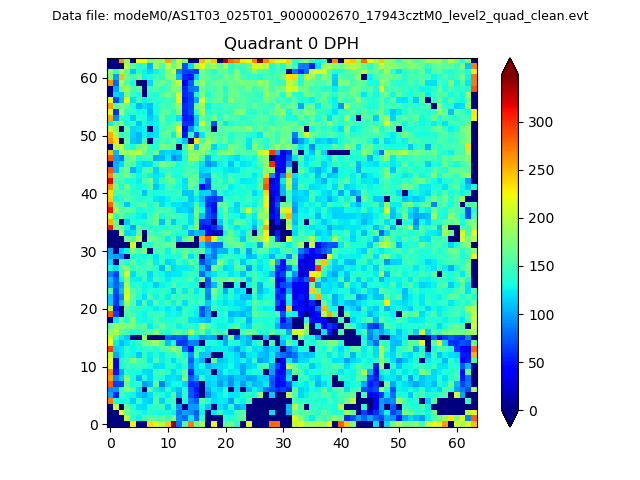 |
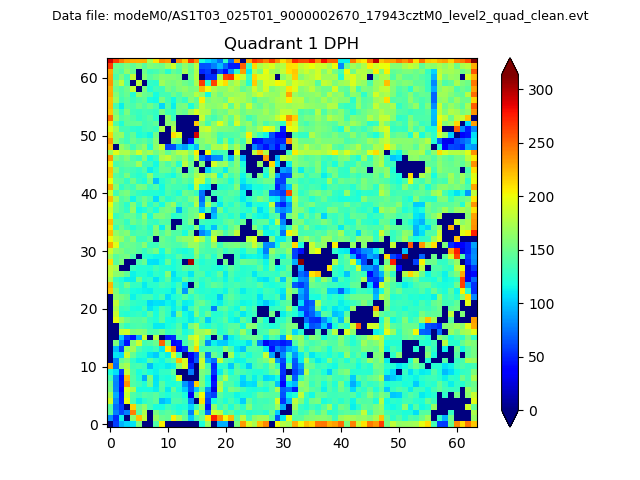 |
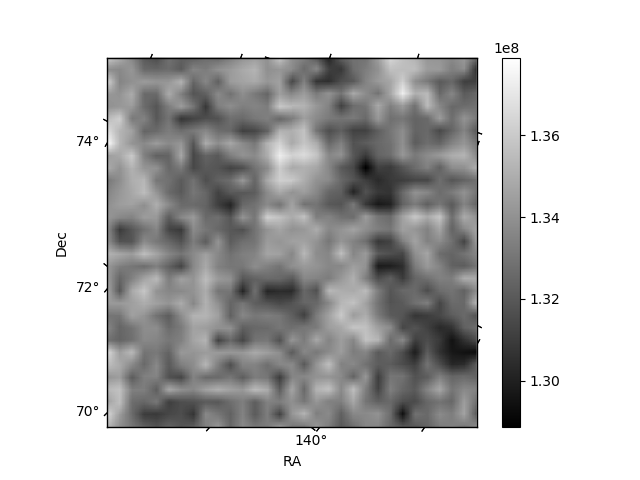
Quadrant B |
|---|---|---|---|
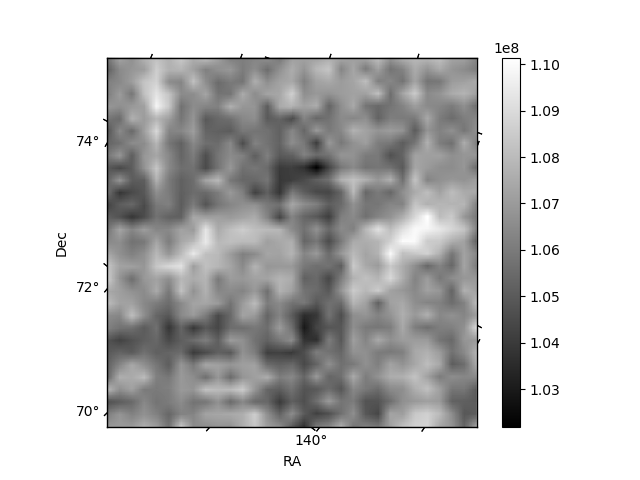
| Quadrant D | 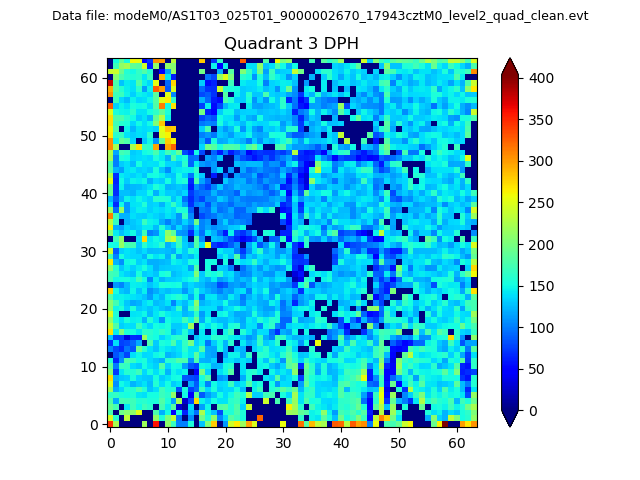 |
 |
Quadrant C |
| Plot type | Count rate plots | Images |
|---|---|---|
| Comparison with Poisson distribution Blue bars denote a histogram of data divided into 1 sec bins. Red curve is a Poisson curve with rate = median count rate of data. |
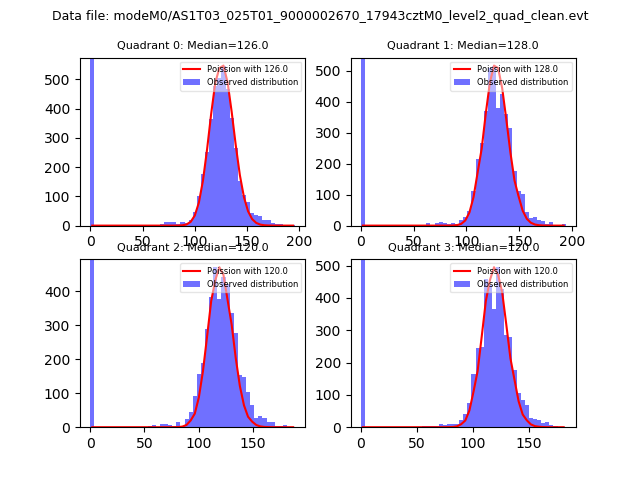 |
 |
| Quadrant-wise count rates Data is divided into 100 sec bins |
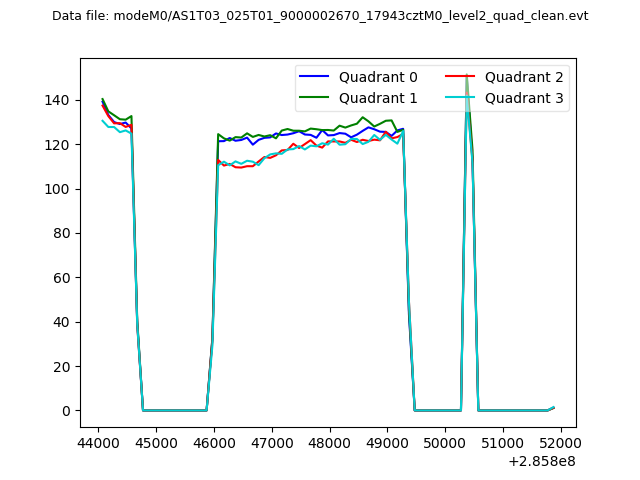 |
|
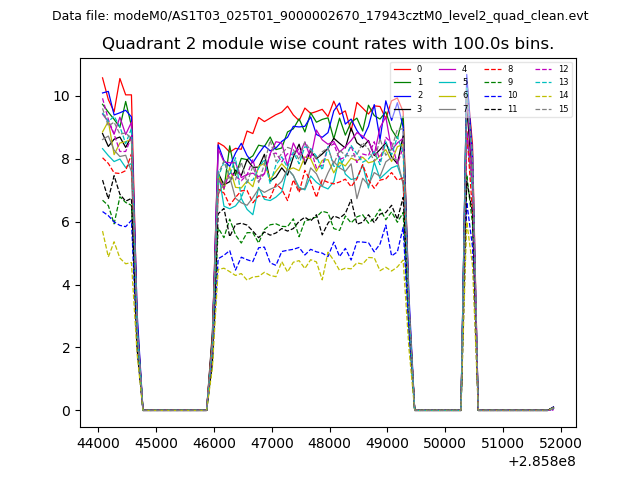
| Module-wise count rates for Quadrant A Data is divided into 100 sec bins |
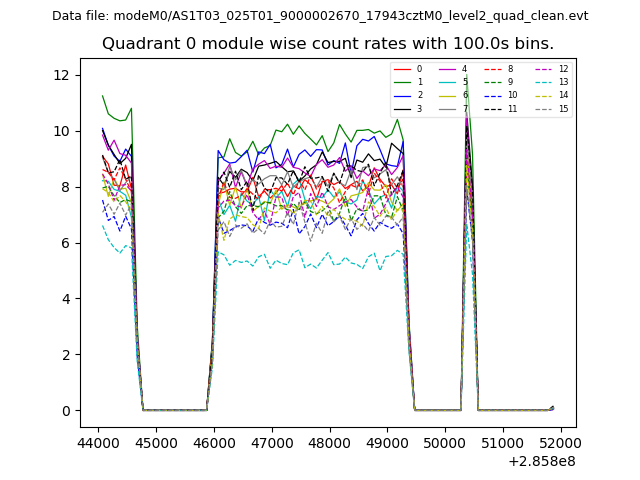 |
 |
| Module-wise count rates for Quadrant B Data is divided into 100 sec bins |
 |
 |
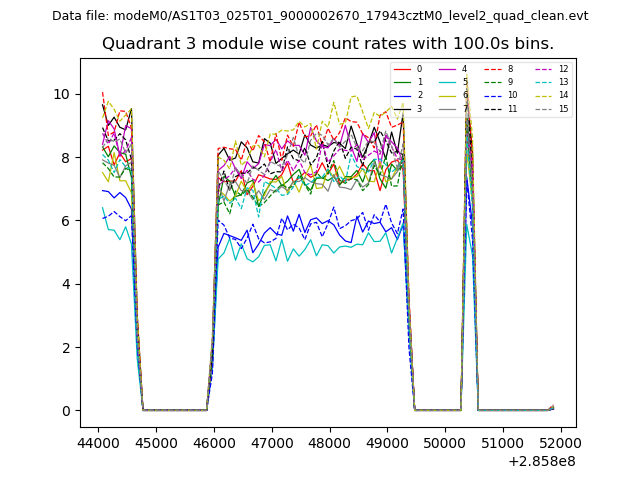
| Module-wise count rates for Quadrant C Data is divided into 100 sec bins |
 |
 |
| Module-wise count rates for Quadrant D Data is divided into 100 sec bins |
 |
 |
| Parameter | Plot |
|---|---|
| CZT HV Monitor | 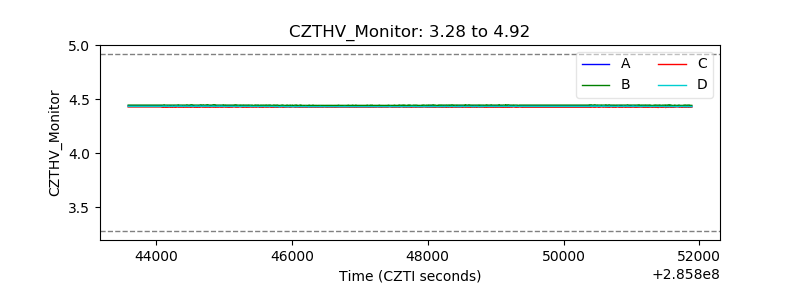 |
| D_VDD | 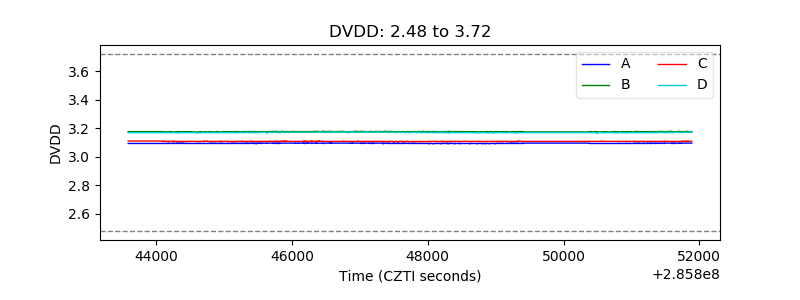 |
| Temperature 1 | 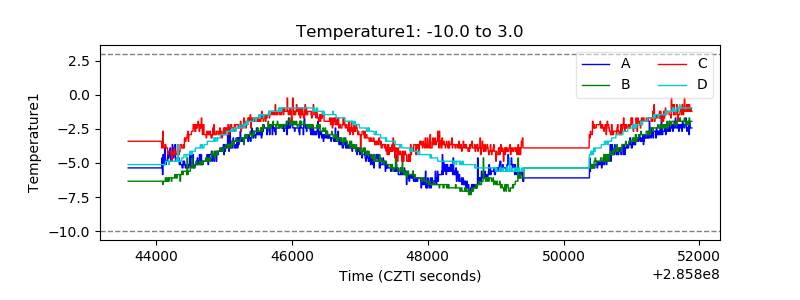 |
| Veto HV Monitor | 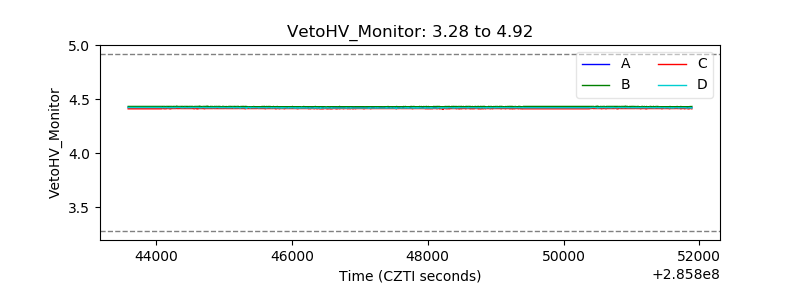 |
| Veto LLD | 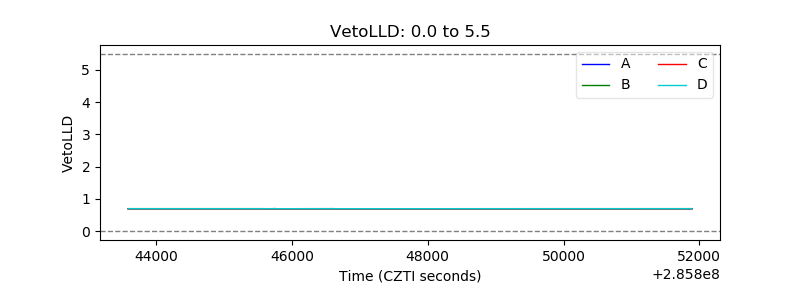 |
| Alpha Counter | 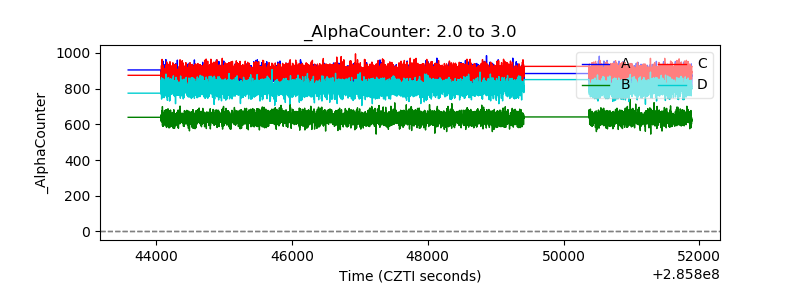 |
| _CPM_Rate | 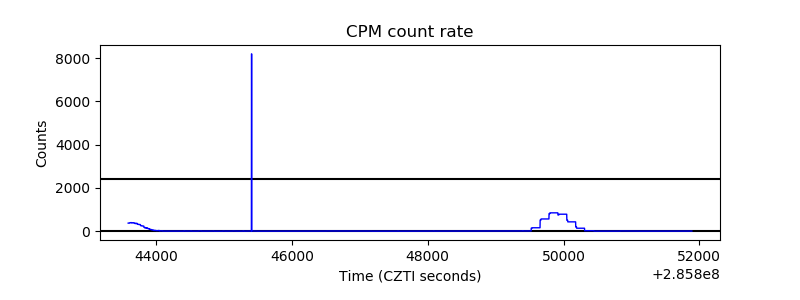 |
| CZT Counter | 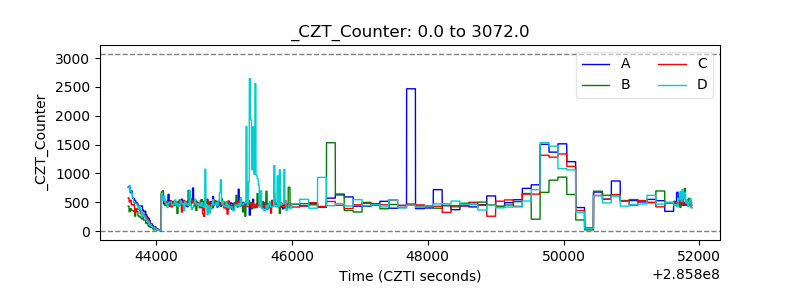 |
| +2.5 Volts monitor |  |
| +5 Volts monitor |  |
| _ROLL_ROT | 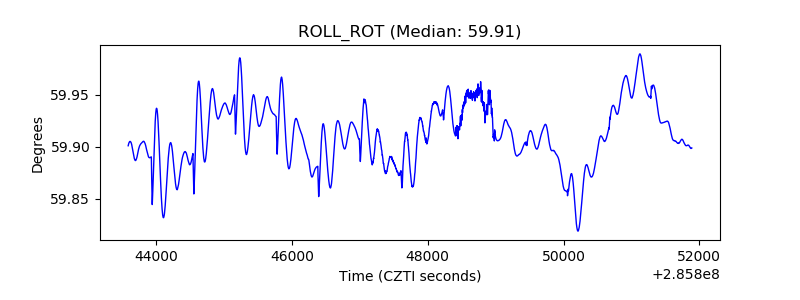 |
| _Roll_DEC | 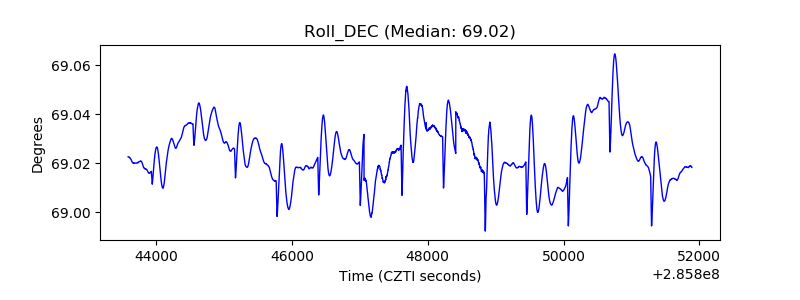 |
| _Roll_RA | 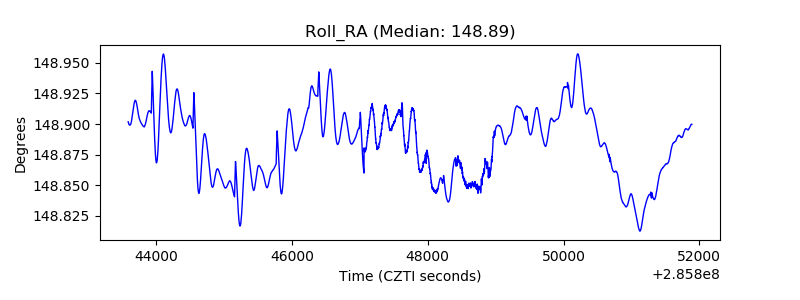 |
| Veto Counter | 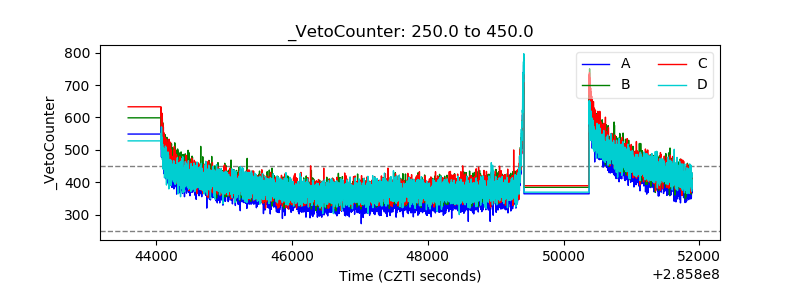 |