| Param | Original file | Final file |
|---|---|---|
| Filename | modeM0/AS1T03_025T01_9000002670_17945cztM0_level2.evt | modeM0/AS1T03_025T01_9000002670_17945cztM0_level2_quad_clean.evt |
| Size (bytes) | 451,739,520 | 82,802,880 |
| Size | 430.8 MB | 79.0 MB |
| Events in quadrant A | 3,303,195 | 524,163 |
| Events in quadrant B | 3,246,478 | 533,079 |
| Events in quadrant C | 3,199,382 | 499,721 |
| Events in quadrant D | 3,490,421 | 497,398 |
| Mode SS | |||
|---|---|---|---|
| Quadrant | BADHDUFLAG | Total packets | Discarded packets |
| A | 0 | 130 | 0 |
| B | 0 | 130 | 0 |
| C | 0 | 130 | 0 |
| D | 0 | 130 | 0 |
| Mode M0 | |||
|---|---|---|---|
| Quadrant | BADHDUFLAG | Total packets | Discarded packets |
| A | 0 | 14114 | 1 |
| B | 0 | 13787 | 1 |
| C | 0 | 13514 | 1 |
| D | 0 | 14807 | 1 |
| Mode M9 | |||
|---|---|---|---|
| Quadrant | BADHDUFLAG | Total packets | Discarded packets |
| A | 0 | 11 | 0 |
| B | 0 | 11 | 0 |
| C | 0 | 11 | 0 |
| D | 0 | 11 | 0 |
| Quadrant | Total seconds | Saturated seconds | Saturation percentage |
|---|---|---|---|
| A | 6500 | 72 | 1.107692% |
| B | 6501 | 73 | 1.122904% |
| C | 6501 | 82 | 1.261344% |
| D | 6501 | 129 | 1.984310% |
Noise dominated data is calculated using 1-second bins in cleaned event files. If a bin has >2000 counts, and if more than 50% of those come from <1% of pixels, then it is considered to be noise-dominated and hence unusable.
| Quadrant | # 1 sec bins | Bins with >0 counts | Bins with >2000 counts | High rate bins dominated by noise | Noise dominated (total time) | Noise dominated (detector-on time) | Marked lightcurve |
|---|---|---|---|---|---|---|---|
| A | 7570 | 6500 | 5 | 5 | 0.07% | 0.08% | 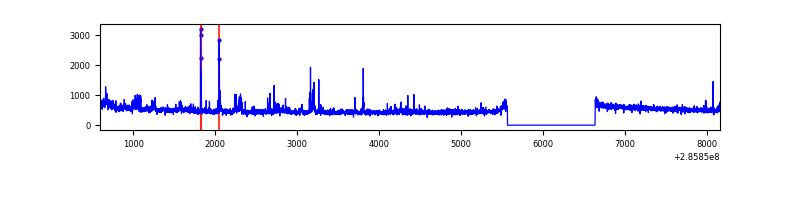 |
| B | 7571 | 6501 | 7 | 7 | 0.09% | 0.11% | 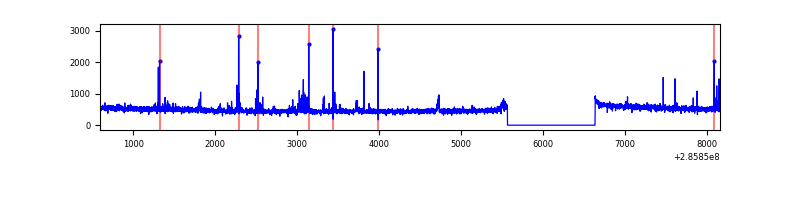 |
| C | 7571 | 6502 | 0 | 0 | 0.00% | 0.00% |  |
| D | 7571 | 6501 | 63 | 63 | 0.83% | 0.97% | 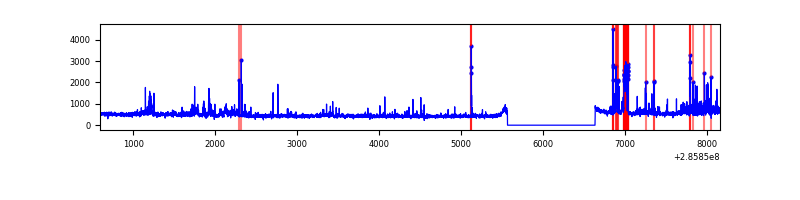 |
Top three noisy pixels from each quadrant. If the there are fewer than three noisy pixels in the level2.evt file, extra rows are filled as -1
| Pixel properties | Quadrant properties | ||||||
|---|---|---|---|---|---|---|---|
| Quadrant | DetID | PixID | Counts | Sigma | Mean | Median | Sigma |
| A | 15 | 174 | 201246 | 1234.76 | 807 | 790 | 162.3 |
| A | 0 | 226 | 6907 | 37.68 | 807 | 790 | 162.3 |
| A | 3 | 137 | 5963 | 31.86 | 807 | 790 | 162.3 |
| B | 0 | 197 | 44525 | 288.98 | 803 | 783 | 151.4 |
| B | 10 | 247 | 20834 | 132.47 | 803 | 783 | 151.4 |
| B | 12 | 111 | 17597 | 111.08 | 803 | 783 | 151.4 |
| C | 14 | 238 | 118498 | 654.88 | 770 | 775 | 179.8 |
| C | 5 | 218 | 61387 | 337.18 | 770 | 775 | 179.8 |
| C | 3 | 233 | 12835 | 67.09 | 770 | 775 | 179.8 |
| D | 5 | 222 | 347493 | 1812.72 | 782 | 757 | 191.3 |
| D | 7 | 238 | 73187 | 378.66 | 782 | 757 | 191.3 |
| D | 9 | 64 | 33175 | 169.48 | 782 | 757 | 191.3 |
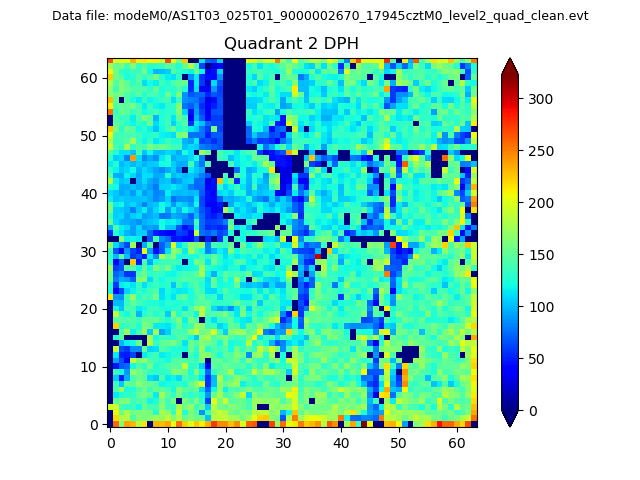
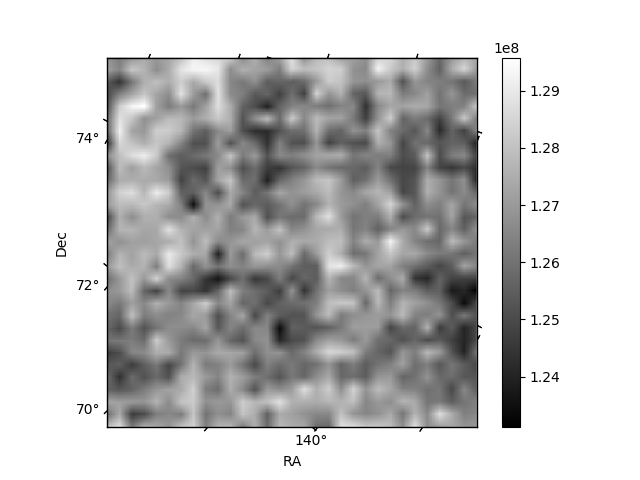
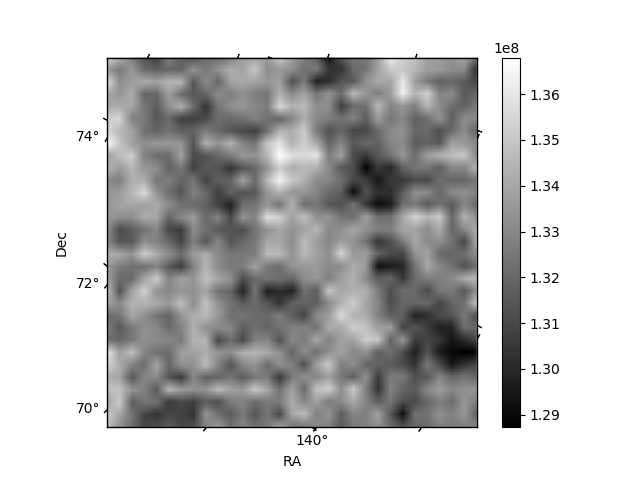
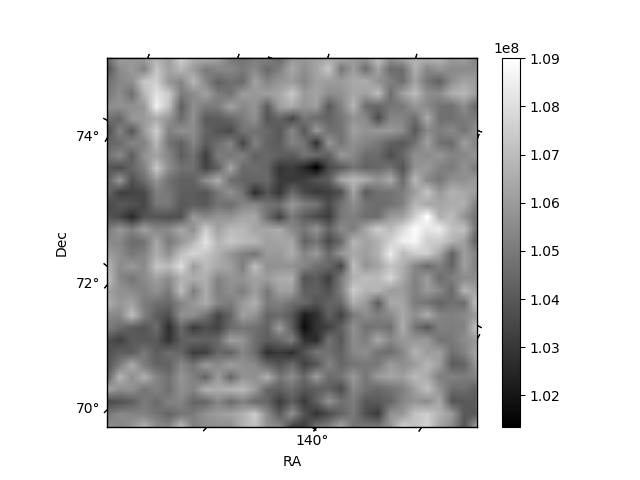
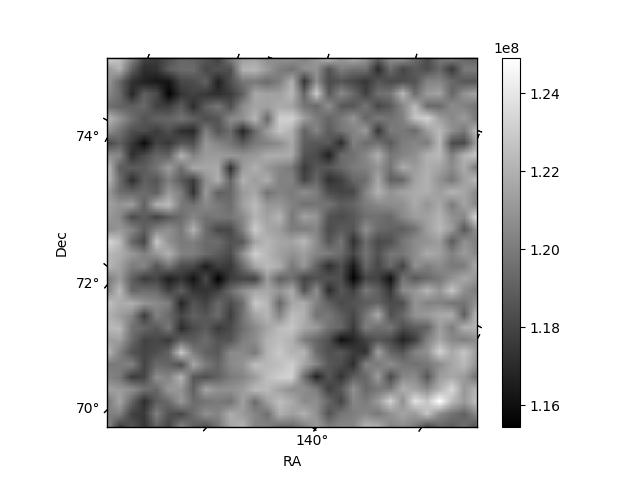
Histogram calculated using DETX and DETY for each event in the final _common_clean file
| Quadrant A | 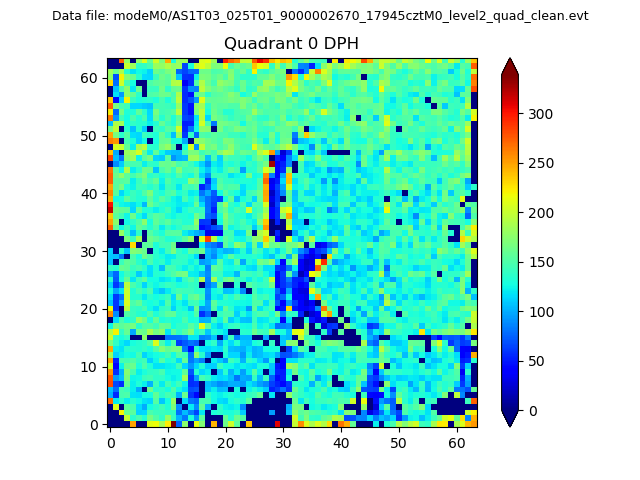 |
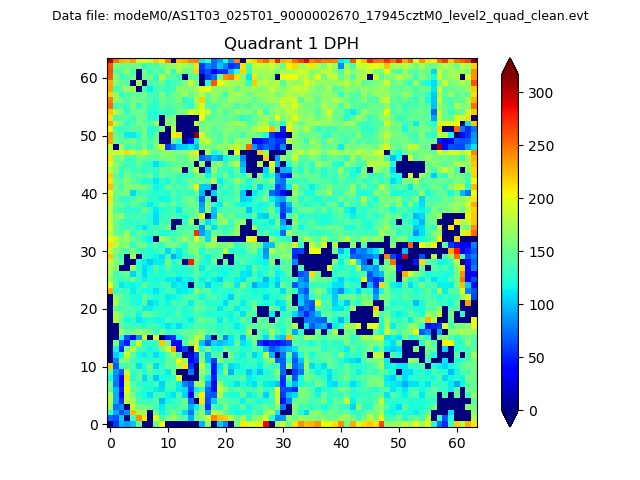 |
Quadrant B |
|---|---|---|---|
| Quadrant D | 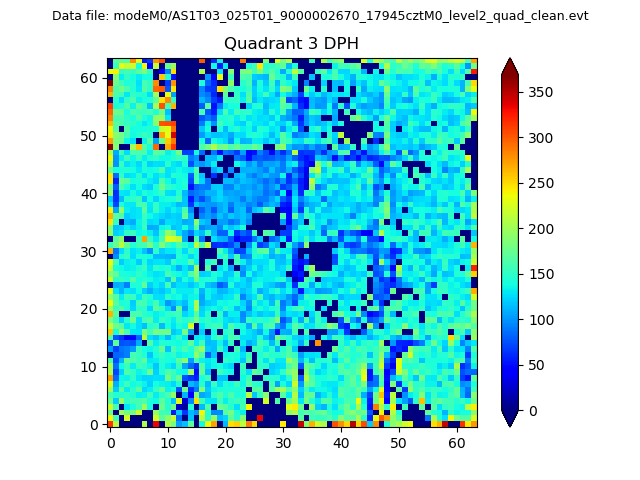 |
 |
Quadrant C |
| Plot type | Count rate plots | Images |
|---|---|---|
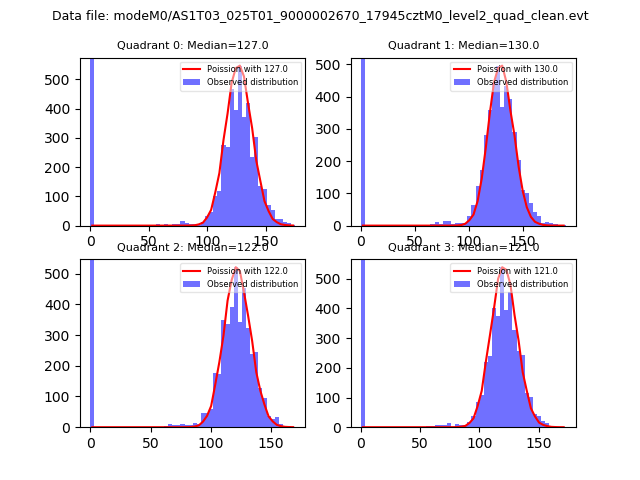
| Comparison with Poisson distribution Blue bars denote a histogram of data divided into 1 sec bins. Red curve is a Poisson curve with rate = median count rate of data. |
 |
 |
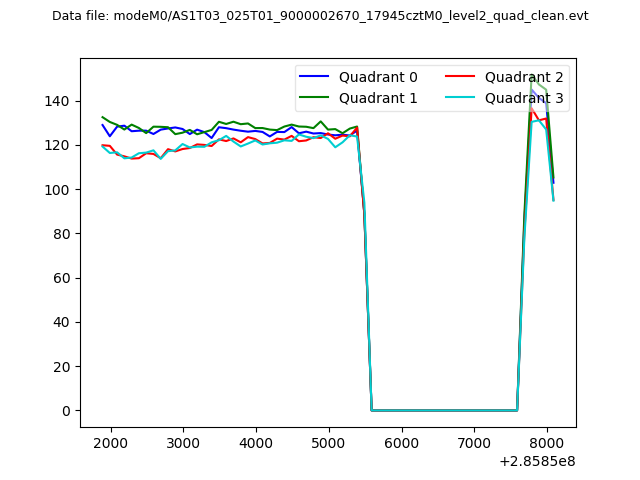
| Quadrant-wise count rates Data is divided into 100 sec bins |
 |
|
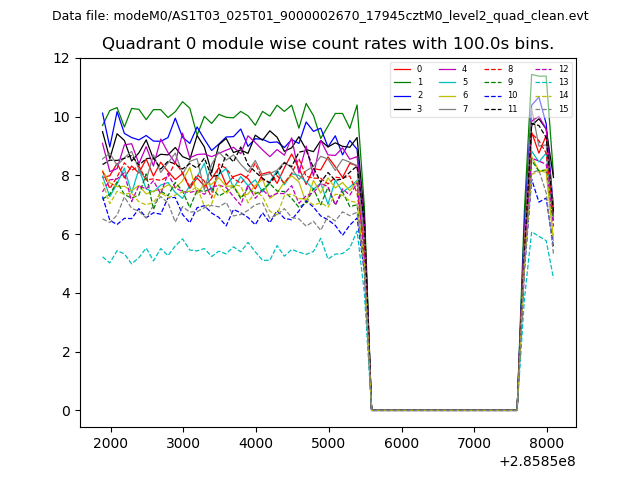
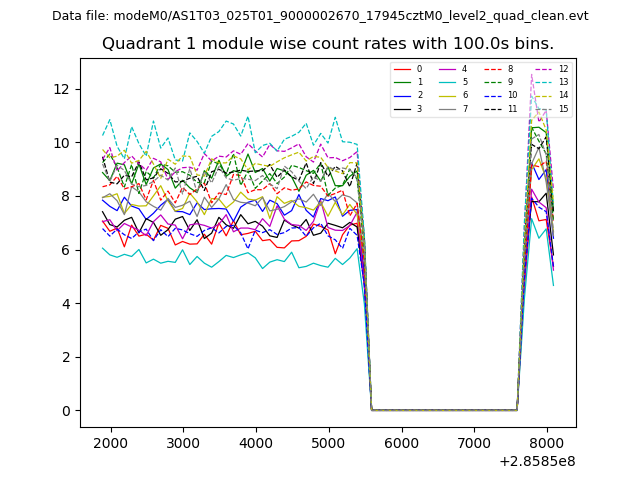
| Module-wise count rates for Quadrant A Data is divided into 100 sec bins |
 |
 |
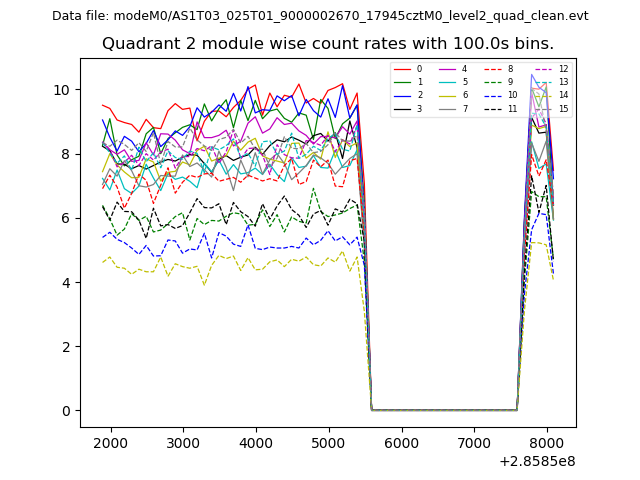
| Module-wise count rates for Quadrant B Data is divided into 100 sec bins |
 |
 |
| Module-wise count rates for Quadrant C Data is divided into 100 sec bins |
 |
 |
| Module-wise count rates for Quadrant D Data is divided into 100 sec bins |
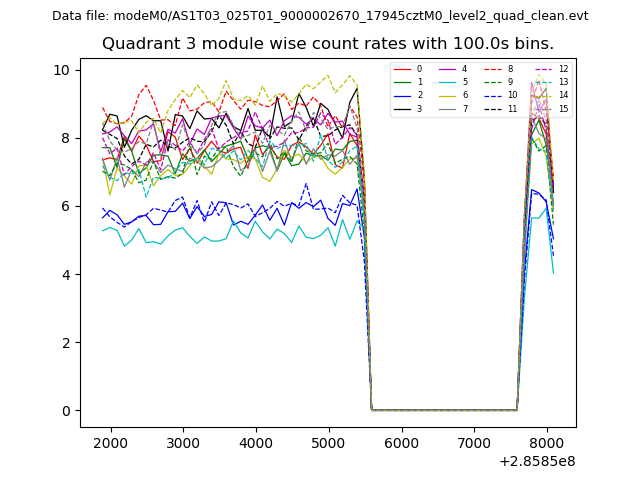 |
 |
| Parameter | Plot |
|---|---|
| CZT HV Monitor | 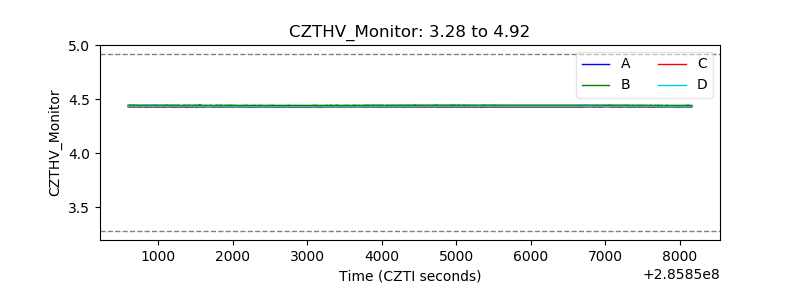 |
| D_VDD | 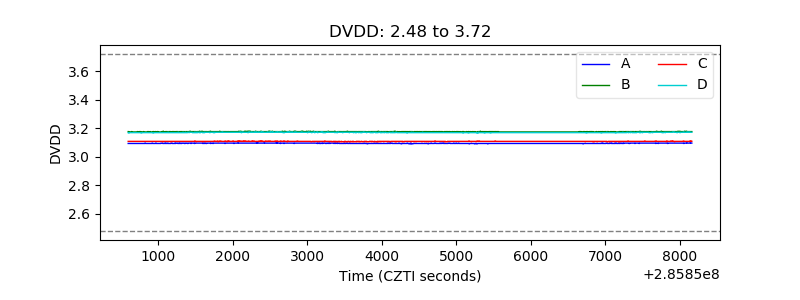 |
| Temperature 1 | 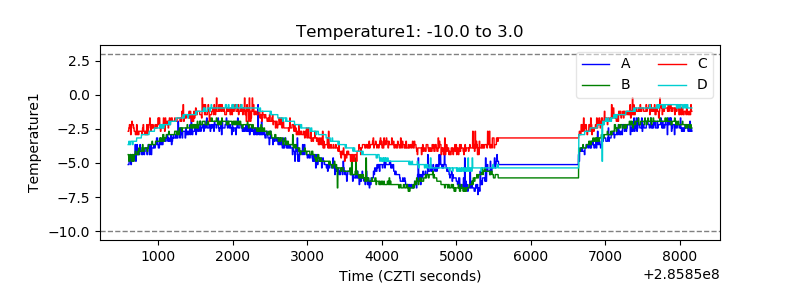 |
| Veto HV Monitor | 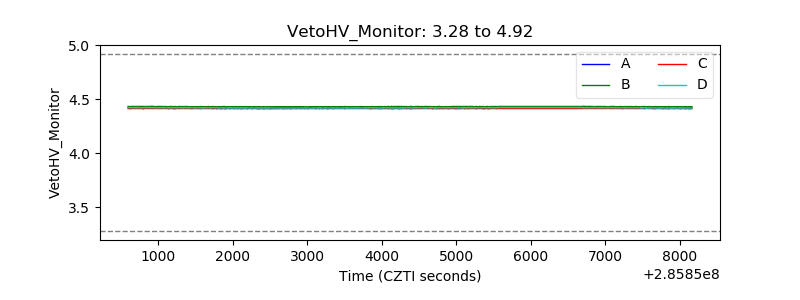 |
| Veto LLD | 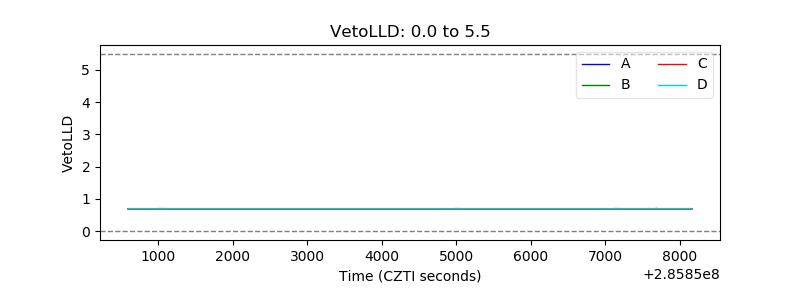 |
| Alpha Counter | 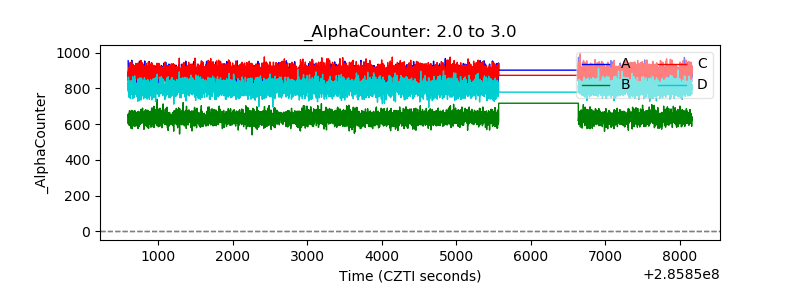 |
| _CPM_Rate | 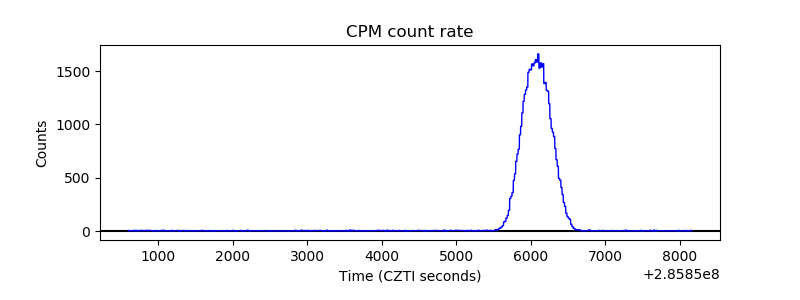 |
| CZT Counter | 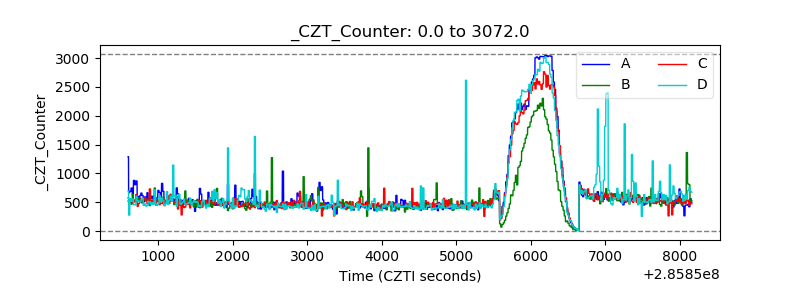 |
| +2.5 Volts monitor | 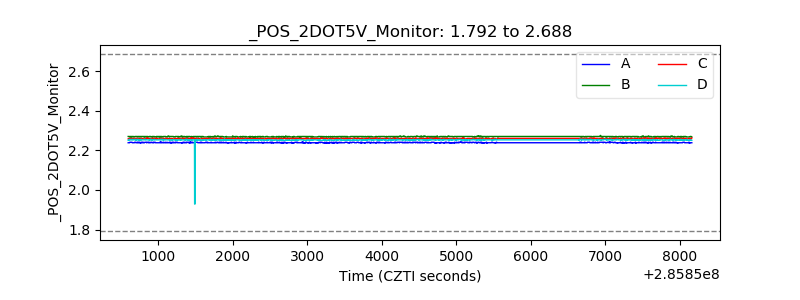 |
| +5 Volts monitor |  |
| _ROLL_ROT | 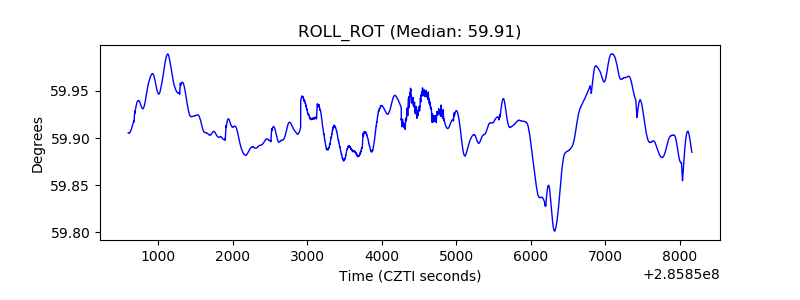 |
| _Roll_DEC | 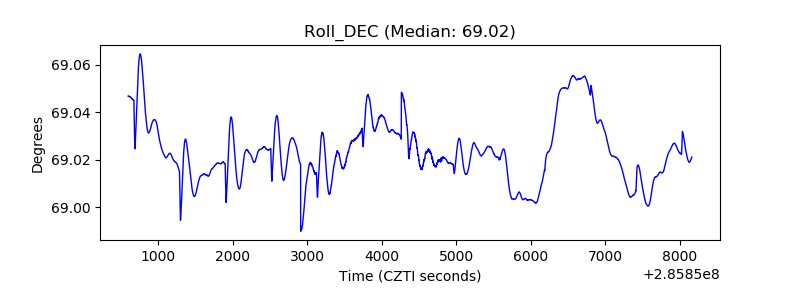 |
| _Roll_RA | 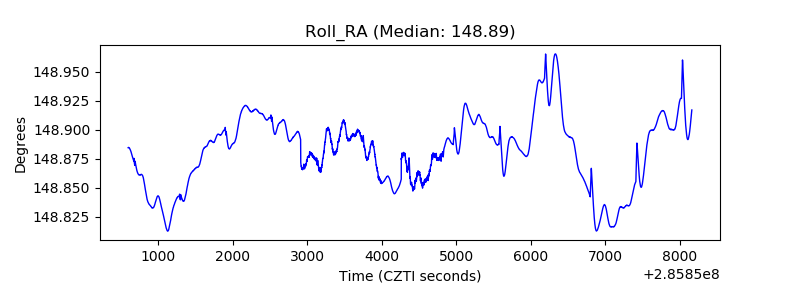 |
| Veto Counter | 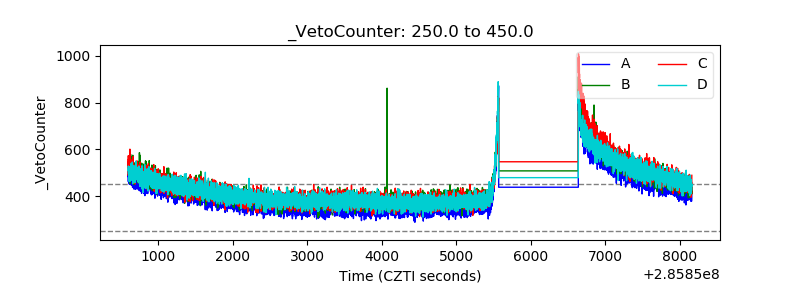 |