| Param | Original file | Final file |
|---|---|---|
| Filename | modeM0/AS1T03_025T01_9000002670_17947cztM0_level2.evt | modeM0/AS1T03_025T01_9000002670_17947cztM0_level2_quad_clean.evt |
| Size (bytes) | 486,233,280 | 115,971,840 |
| Size | 463.7 MB | 110.6 MB |
| Events in quadrant A | 4,364,192 | 758,661 |
| Events in quadrant B | 3,246,380 | 804,759 |
| Events in quadrant C | 3,243,220 | 770,311 |
| Events in quadrant D | 3,458,899 | 753,945 |
| Mode SS | |||
|---|---|---|---|
| Quadrant | BADHDUFLAG | Total packets | Discarded packets |
| A | 0 | 124 | 0 |
| B | 0 | 124 | 0 |
| C | 0 | 124 | 0 |
| D | 0 | 124 | 0 |
| Mode M0 | |||
|---|---|---|---|
| Quadrant | BADHDUFLAG | Total packets | Discarded packets |
| A | 0 | 16904 | 1 |
| B | 0 | 13729 | 1 |
| C | 0 | 13549 | 2 |
| D | 0 | 14414 | 1 |
| Mode M9 | |||
|---|---|---|---|
| Quadrant | BADHDUFLAG | Total packets | Discarded packets |
| A | 0 | 13 | 0 |
| B | 0 | 13 | 0 |
| C | 0 | 13 | 0 |
| D | 0 | 13 | 0 |
| Quadrant | Total seconds | Saturated seconds | Saturation percentage |
|---|---|---|---|
| A | 6082 | 480 | 7.892141% |
| B | 6082 | 97 | 1.594870% |
| C | 6082 | 114 | 1.874383% |
| D | 6082 | 140 | 2.301874% |
Noise dominated data is calculated using 1-second bins in cleaned event files. If a bin has >2000 counts, and if more than 50% of those come from <1% of pixels, then it is considered to be noise-dominated and hence unusable.
| Quadrant | # 1 sec bins | Bins with >0 counts | Bins with >2000 counts | High rate bins dominated by noise | Noise dominated (total time) | Noise dominated (detector-on time) | Marked lightcurve |
|---|---|---|---|---|---|---|---|
| A | 7362 | 6082 | 382 | 382 | 5.19% | 6.28% | 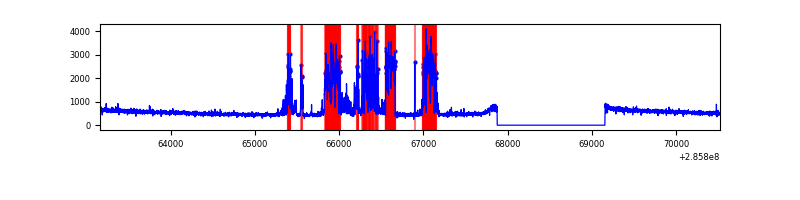 |
| B | 7362 | 6083 | 12 | 12 | 0.16% | 0.20% | 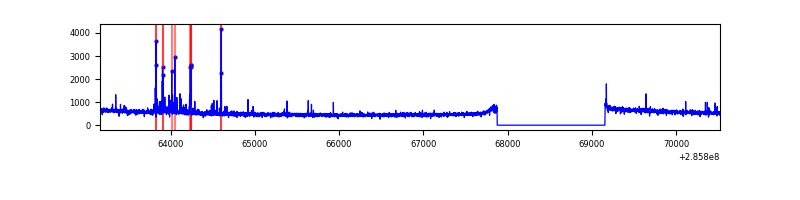 |
| C | 7362 | 6083 | 1 | 1 | 0.01% | 0.02% | 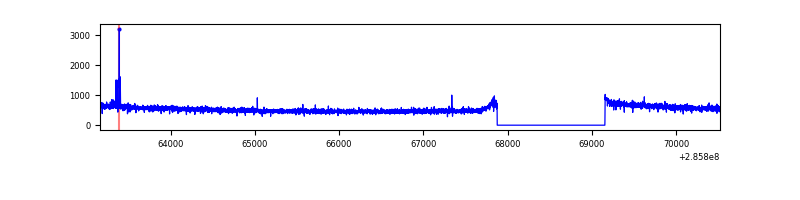 |
| D | 7362 | 6083 | 61 | 61 | 0.83% | 1.00% | 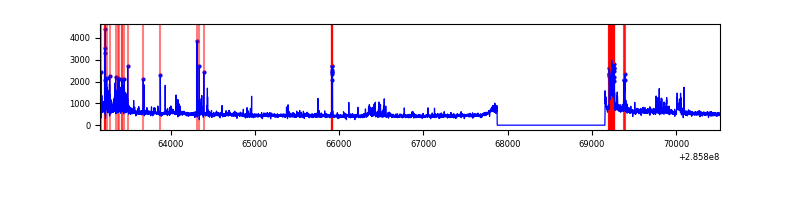 |
Top three noisy pixels from each quadrant. If the there are fewer than three noisy pixels in the level2.evt file, extra rows are filled as -1
| Pixel properties | Quadrant properties | ||||||
|---|---|---|---|---|---|---|---|
| Quadrant | DetID | PixID | Counts | Sigma | Mean | Median | Sigma |
| A | 15 | 174 | 1379679 | 8912.4 | 776 | 760 | 154.7 |
| A | 0 | 226 | 6896 | 39.66 | 776 | 760 | 154.7 |
| A | 12 | 194 | 5812 | 32.65 | 776 | 760 | 154.7 |
| B | 7 | 220 | 100545 | 676.59 | 798 | 780 | 147.5 |
| B | 12 | 111 | 16168 | 104.36 | 798 | 780 | 147.5 |
| B | 11 | 111 | 14009 | 89.72 | 798 | 780 | 147.5 |
| C | 14 | 238 | 121829 | 679.97 | 776 | 783 | 178.0 |
| C | 3 | 233 | 36753 | 202.06 | 776 | 783 | 178.0 |
| C | 5 | 218 | 31970 | 175.19 | 776 | 783 | 178.0 |
| D | 5 | 222 | 246419 | 1299.45 | 785 | 763 | 189.0 |
| D | 9 | 64 | 128572 | 676.07 | 785 | 763 | 189.0 |
| D | 2 | 234 | 25784 | 132.35 | 785 | 763 | 189.0 |
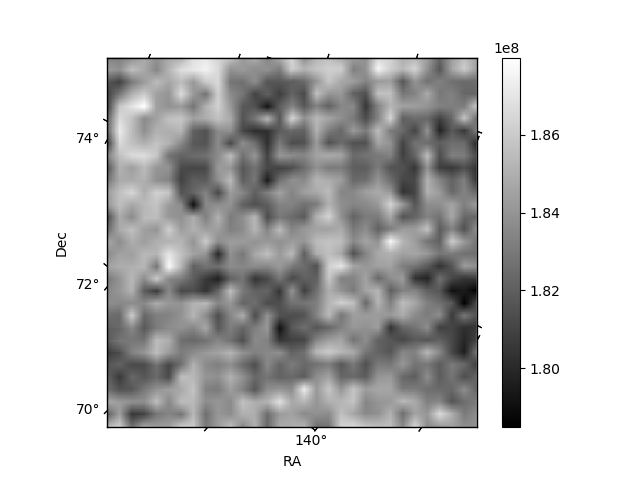
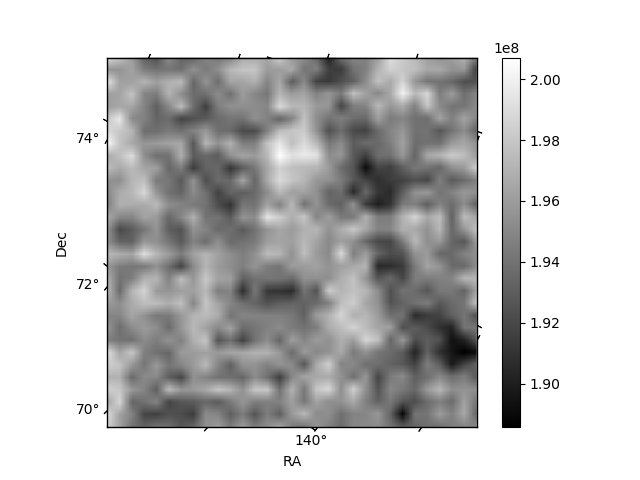
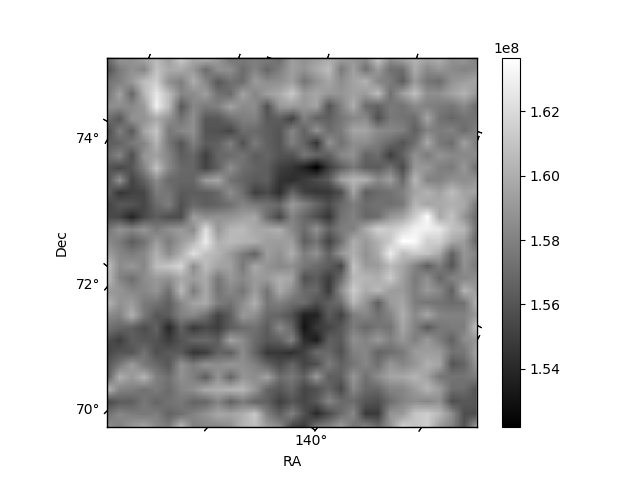
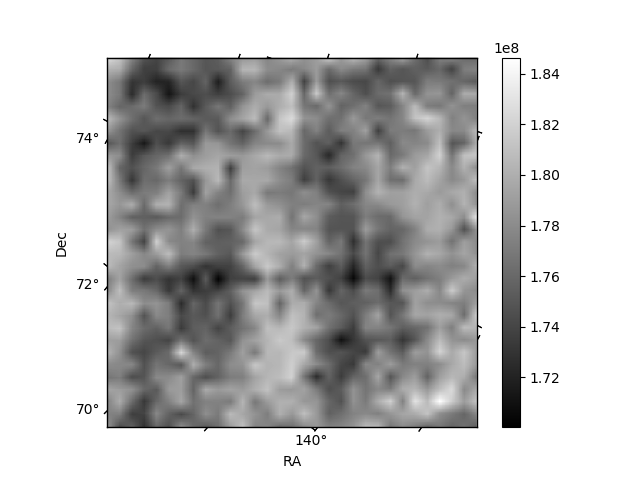
Histogram calculated using DETX and DETY for each event in the final _common_clean file
| Quadrant A | 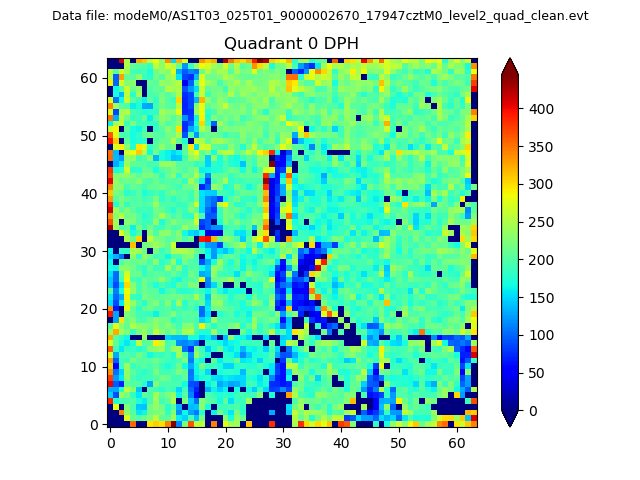 |
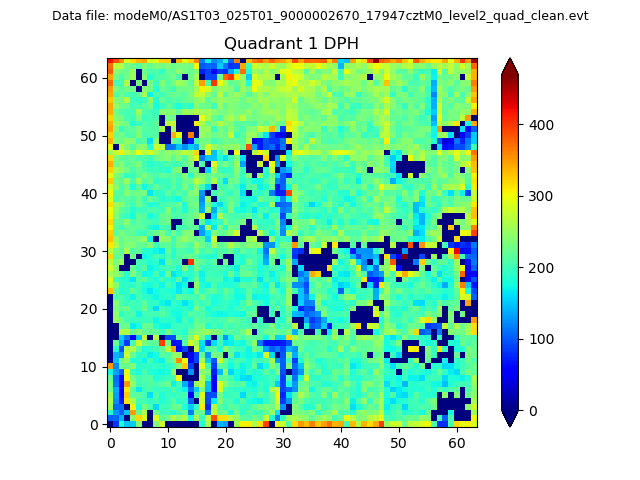 |
Quadrant B |
|---|---|---|---|
| Quadrant D | 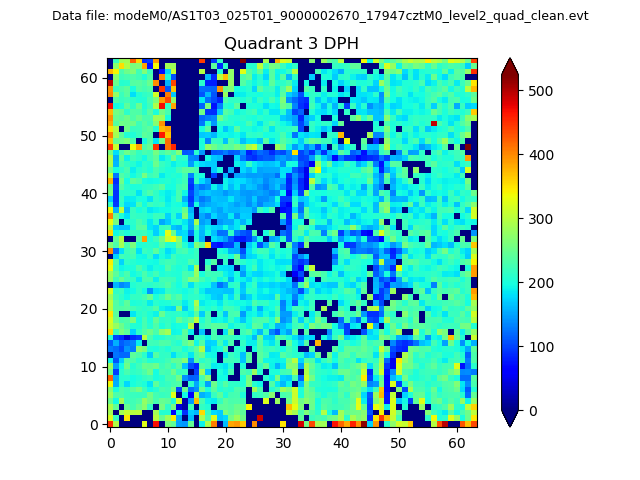 |
 |
Quadrant C |
| Plot type | Count rate plots | Images |
|---|---|---|
| Comparison with Poisson distribution Blue bars denote a histogram of data divided into 1 sec bins. Red curve is a Poisson curve with rate = median count rate of data. |
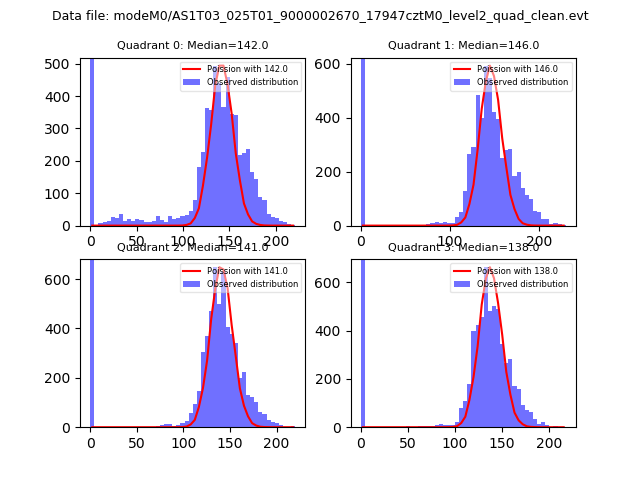 |
 |
| Quadrant-wise count rates Data is divided into 100 sec bins |
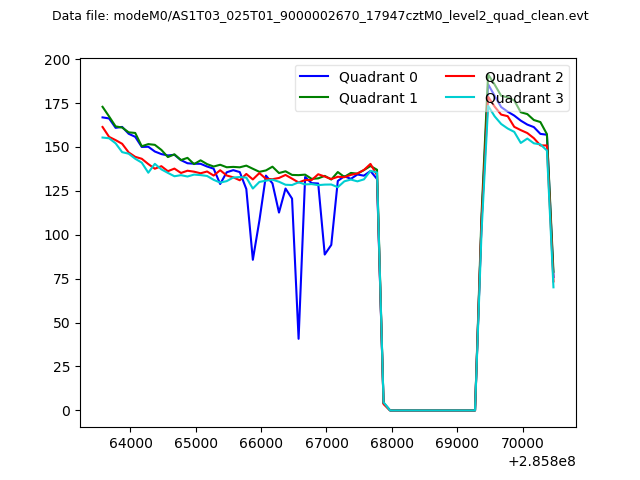 |
|
| Module-wise count rates for Quadrant A Data is divided into 100 sec bins |
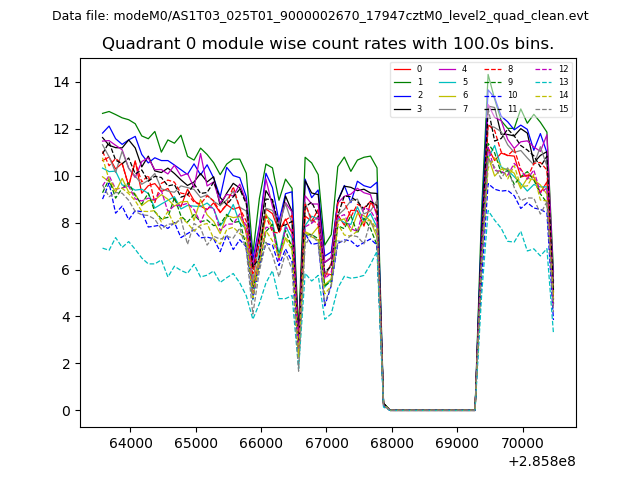 |
 |
| Module-wise count rates for Quadrant B Data is divided into 100 sec bins |
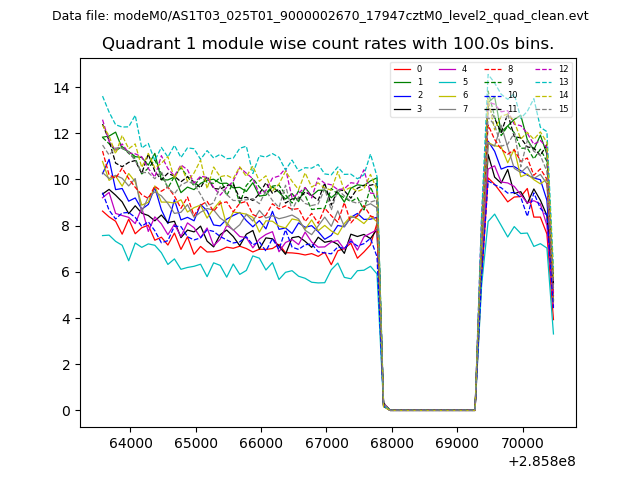 |
 |
| Module-wise count rates for Quadrant C Data is divided into 100 sec bins |
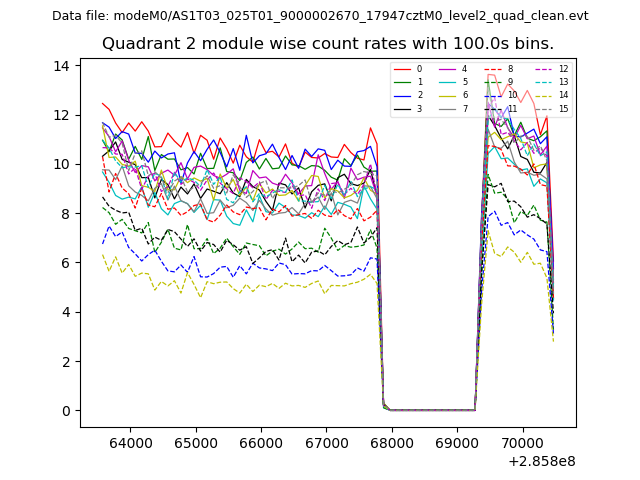 |
 |
| Module-wise count rates for Quadrant D Data is divided into 100 sec bins |
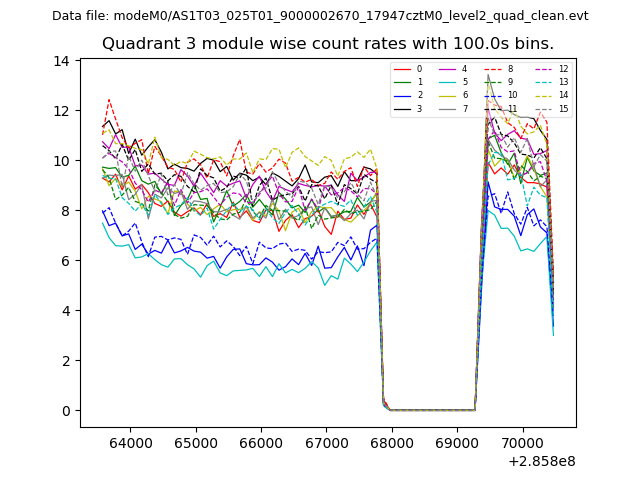 |
 |
| Parameter | Plot |
|---|---|
| CZT HV Monitor | 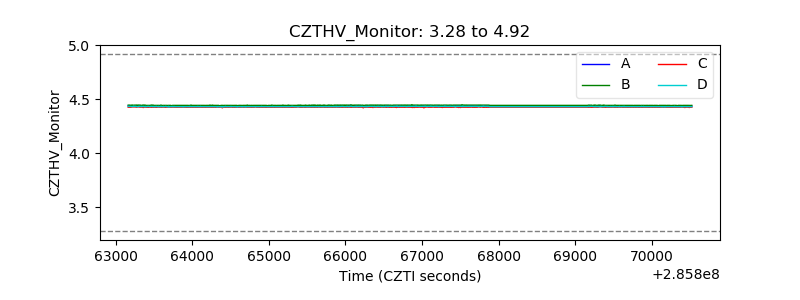 |
| D_VDD | 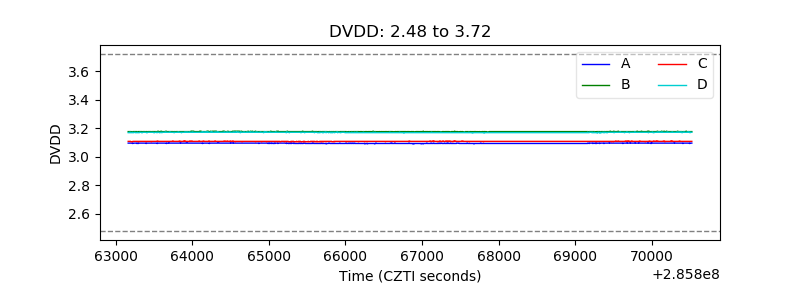 |
| Temperature 1 | 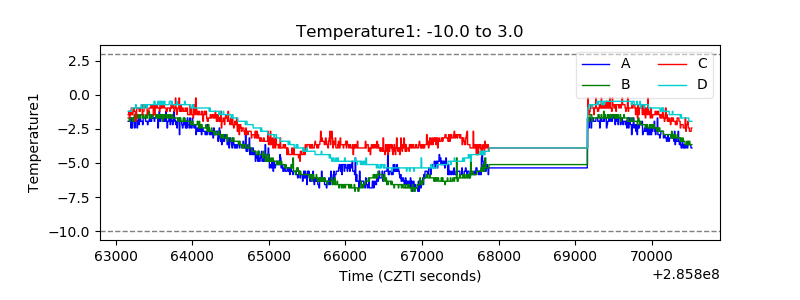 |
| Veto HV Monitor | 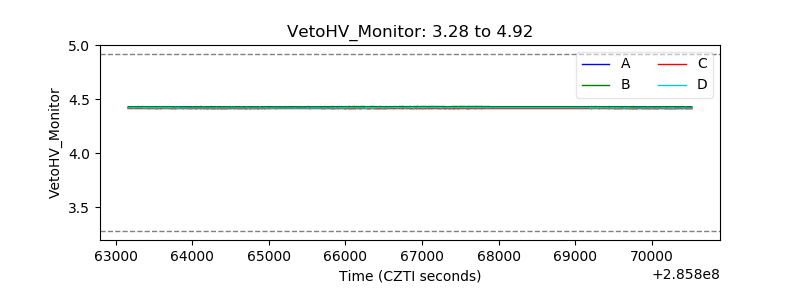 |
| Veto LLD | 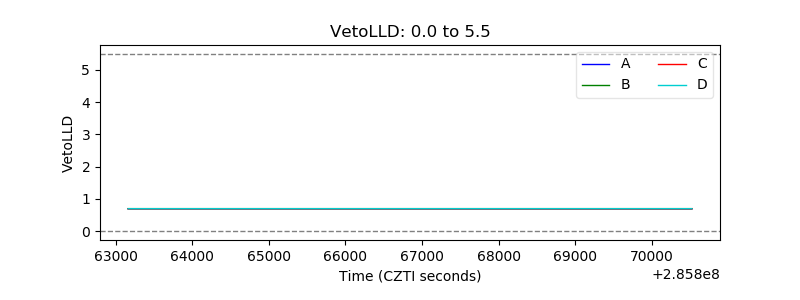 |
| Alpha Counter | 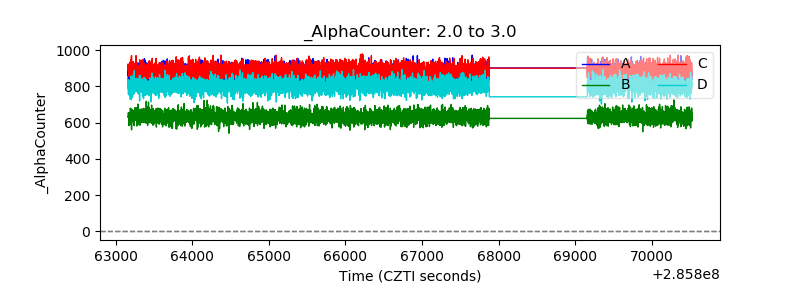 |
| _CPM_Rate | 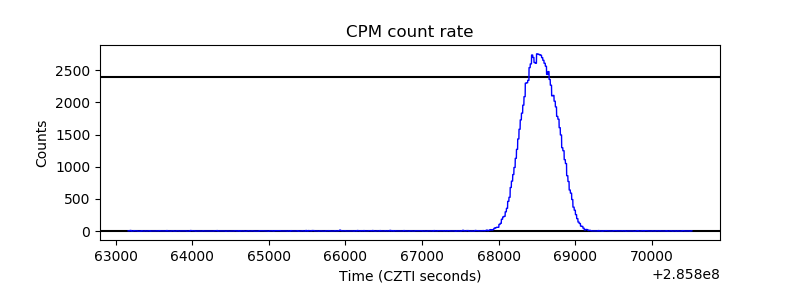 |
| CZT Counter |  |
| +2.5 Volts monitor |  |
| +5 Volts monitor | 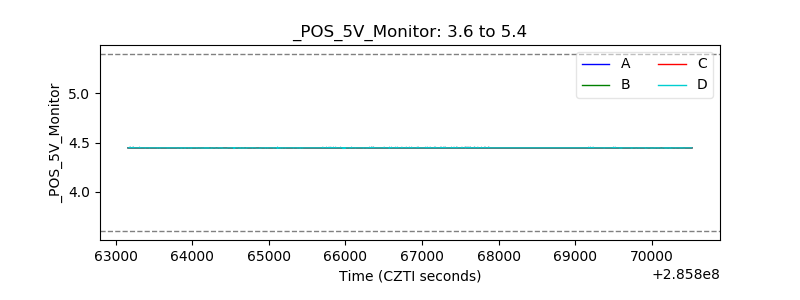 |
| _ROLL_ROT | 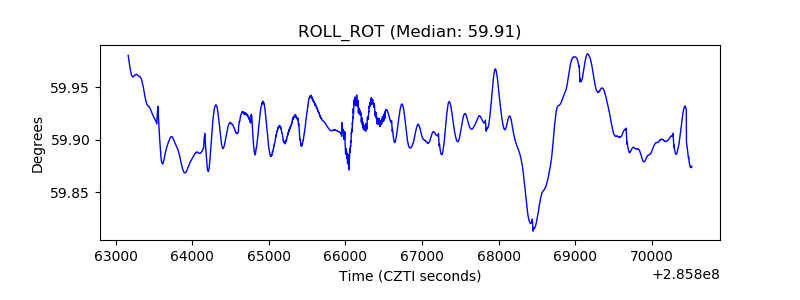 |
| _Roll_DEC | 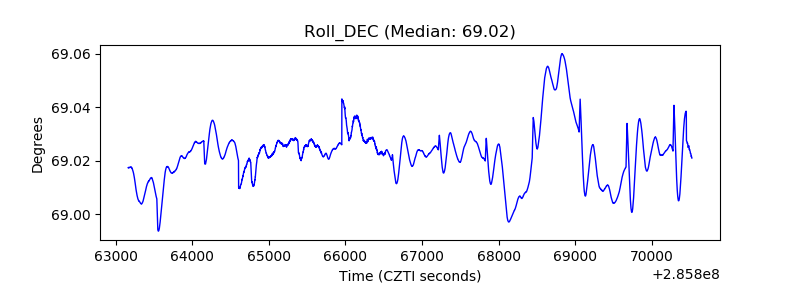 |
| _Roll_RA | 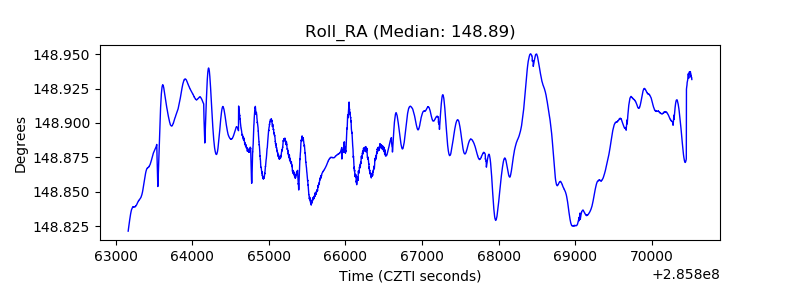 |
| Veto Counter | 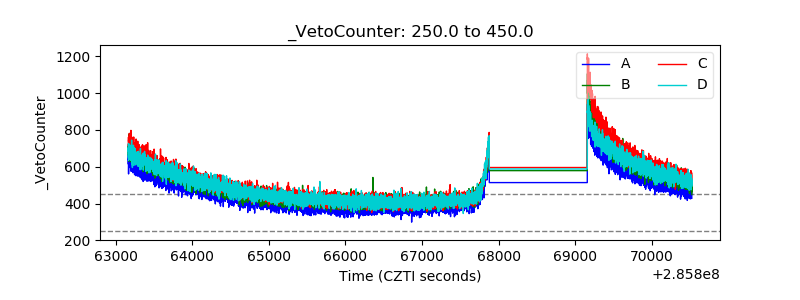 |