| Param | Original file | Final file |
|---|---|---|
| Filename | modeM0/AS1T03_025T01_9000002670_17948cztM0_level2.evt | modeM0/AS1T03_025T01_9000002670_17948cztM0_level2_quad_clean.evt |
| Size (bytes) | 429,842,880 | 125,449,920 |
| Size | 409.9 MB | 119.6 MB |
| Events in quadrant A | 3,002,712 | 852,359 |
| Events in quadrant B | 3,093,559 | 878,479 |
| Events in quadrant C | 3,151,616 | 841,019 |
| Events in quadrant D | 3,368,542 | 815,517 |
| Mode SS | |||
|---|---|---|---|
| Quadrant | BADHDUFLAG | Total packets | Discarded packets |
| A | 0 | 118 | 0 |
| B | 0 | 118 | 0 |
| C | 0 | 118 | 0 |
| D | 0 | 118 | 0 |
| Mode M0 | |||
|---|---|---|---|
| Quadrant | BADHDUFLAG | Total packets | Discarded packets |
| A | 0 | 12865 | 2 |
| B | 0 | 13068 | 1 |
| C | 0 | 13241 | 1 |
| D | 0 | 14019 | 1 |
| Mode M9 | |||
|---|---|---|---|
| Quadrant | BADHDUFLAG | Total packets | Discarded packets |
| A | 0 | 14 | 0 |
| B | 0 | 14 | 0 |
| C | 0 | 14 | 0 |
| D | 0 | 14 | 0 |
| Quadrant | Total seconds | Saturated seconds | Saturation percentage |
|---|---|---|---|
| A | 5910 | 79 | 1.336717% |
| B | 5911 | 86 | 1.454915% |
| C | 5911 | 126 | 2.131619% |
| D | 5911 | 158 | 2.672983% |
Noise dominated data is calculated using 1-second bins in cleaned event files. If a bin has >2000 counts, and if more than 50% of those come from <1% of pixels, then it is considered to be noise-dominated and hence unusable.
| Quadrant | # 1 sec bins | Bins with >0 counts | Bins with >2000 counts | High rate bins dominated by noise | Noise dominated (total time) | Noise dominated (detector-on time) | Marked lightcurve |
|---|---|---|---|---|---|---|---|
| A | 7250 | 5911 | 11 | 11 | 0.15% | 0.19% | 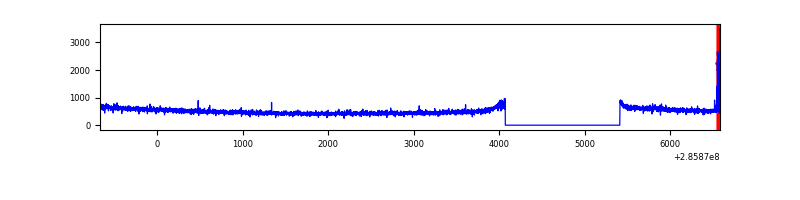 |
| B | 7251 | 5912 | 1 | 1 | 0.01% | 0.02% | 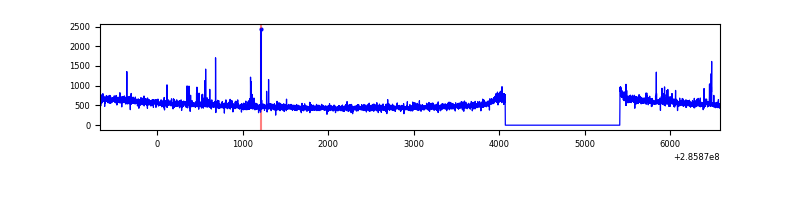 |
| C | 7251 | 5911 | 1 | 1 | 0.01% | 0.02% | 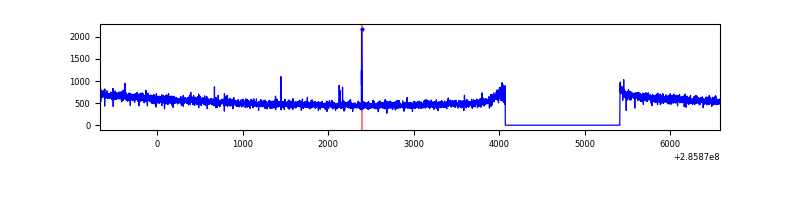 |
| D | 7251 | 5912 | 78 | 78 | 1.08% | 1.32% |  |
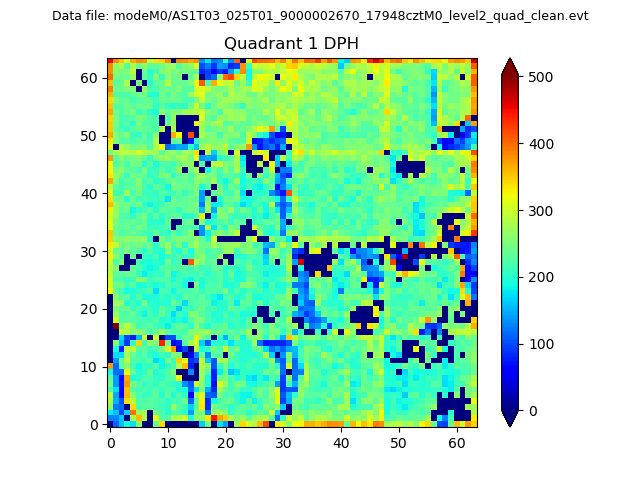
Top three noisy pixels from each quadrant. If the there are fewer than three noisy pixels in the level2.evt file, extra rows are filled as -1
| Pixel properties | Quadrant properties | ||||||
|---|---|---|---|---|---|---|---|
| Quadrant | DetID | PixID | Counts | Sigma | Mean | Median | Sigma |
| A | 15 | 174 | 44539 | 286.15 | 769 | 754 | 153.0 |
| A | 0 | 226 | 6649 | 38.53 | 769 | 754 | 153.0 |
| A | 12 | 194 | 5726 | 32.49 | 769 | 754 | 153.0 |
| B | 7 | 220 | 19479 | 130.84 | 778 | 760 | 143.1 |
| B | 12 | 111 | 15873 | 105.64 | 778 | 760 | 143.1 |
| B | 11 | 111 | 13515 | 89.15 | 778 | 760 | 143.1 |
| C | 14 | 238 | 118667 | 674.82 | 759 | 764 | 174.7 |
| C | 3 | 233 | 35526 | 198.96 | 759 | 764 | 174.7 |
| C | 5 | 218 | 22684 | 125.46 | 759 | 764 | 174.7 |
| D | 5 | 222 | 353069 | 1926.1 | 762 | 742 | 182.9 |
| D | 9 | 64 | 33474 | 178.94 | 762 | 742 | 182.9 |
| D | 10 | 70 | 26072 | 138.47 | 762 | 742 | 182.9 |
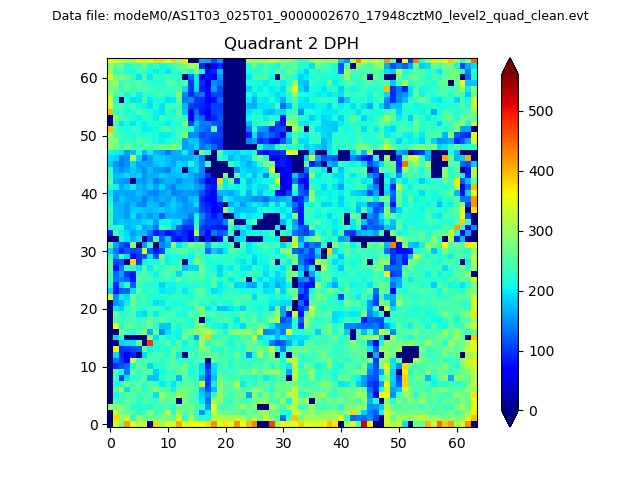
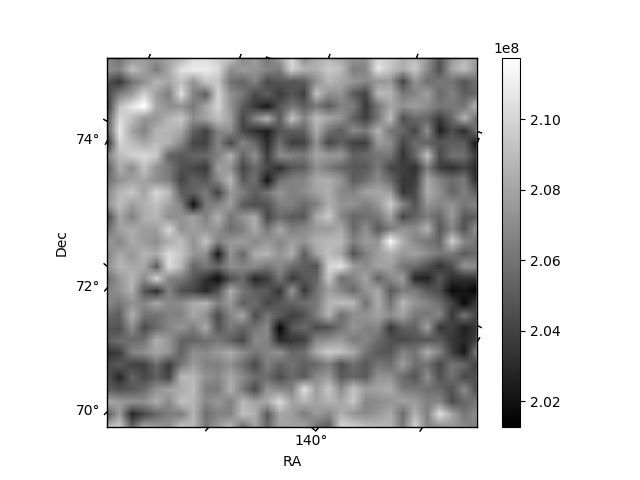
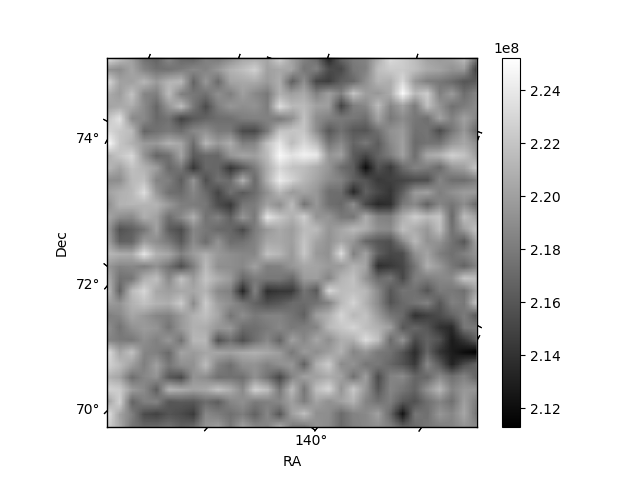
Histogram calculated using DETX and DETY for each event in the final _common_clean file
| Quadrant A |  |
 |
Quadrant B |
|---|---|---|---|
| Quadrant D | 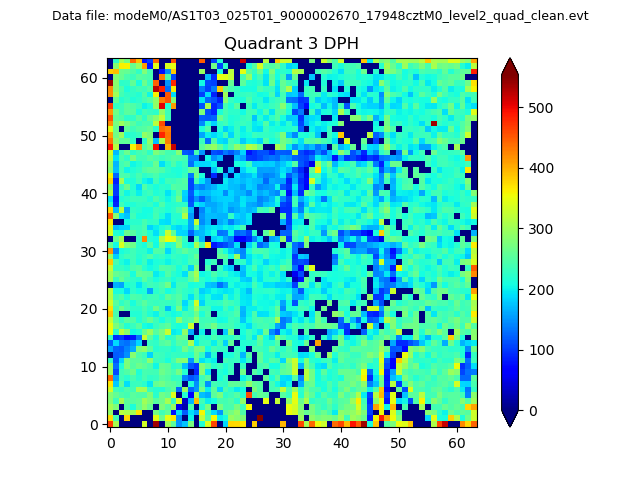 |
 |
Quadrant C |
| Plot type | Count rate plots | Images |
|---|---|---|
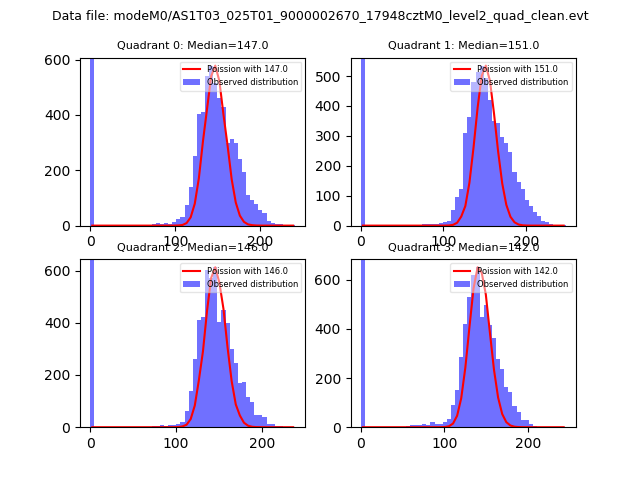
| Comparison with Poisson distribution Blue bars denote a histogram of data divided into 1 sec bins. Red curve is a Poisson curve with rate = median count rate of data. |
 |
 |
| Quadrant-wise count rates Data is divided into 100 sec bins |
 |
|
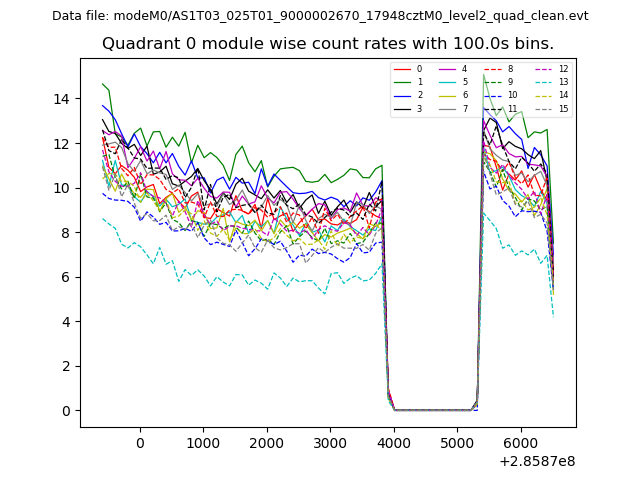
| Module-wise count rates for Quadrant A Data is divided into 100 sec bins |
 |
 |
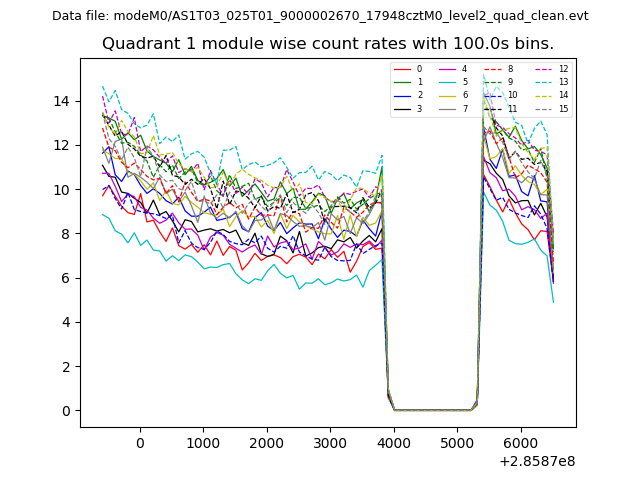
| Module-wise count rates for Quadrant B Data is divided into 100 sec bins |
 |
 |
| Module-wise count rates for Quadrant C Data is divided into 100 sec bins |
 |
 |
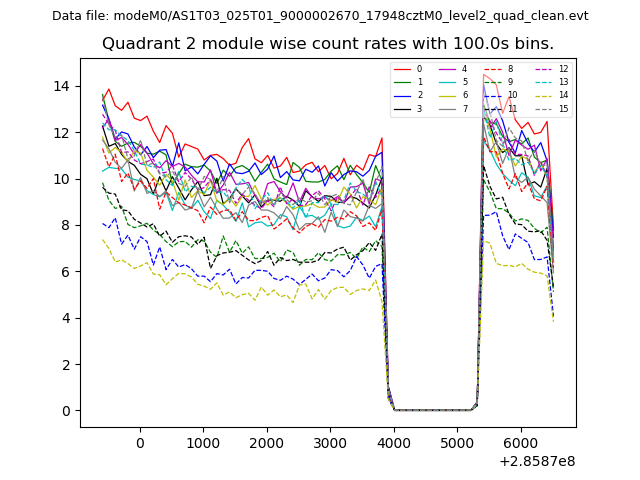
| Module-wise count rates for Quadrant D Data is divided into 100 sec bins |
 |
 |
| Parameter | Plot |
|---|---|
| CZT HV Monitor | 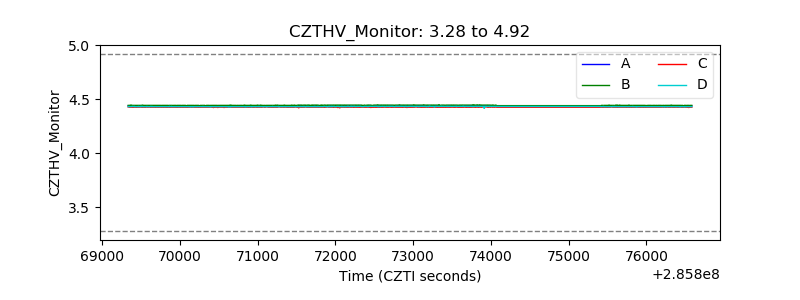 |
| D_VDD |  |
| Temperature 1 | 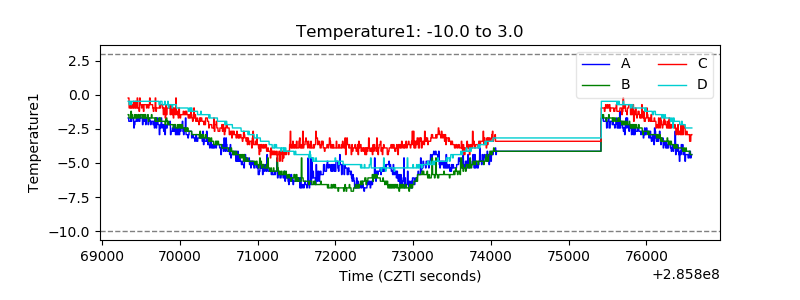 |
| Veto HV Monitor | 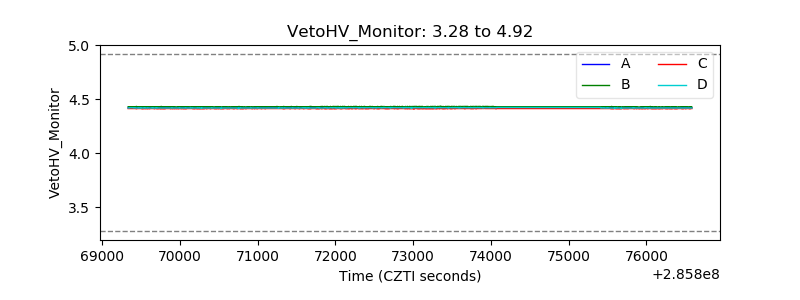 |
| Veto LLD | 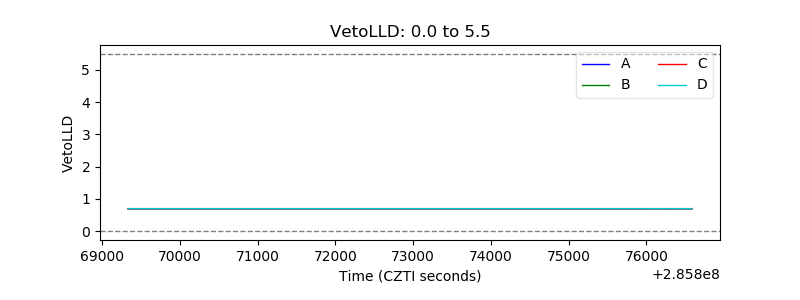 |
| Alpha Counter | 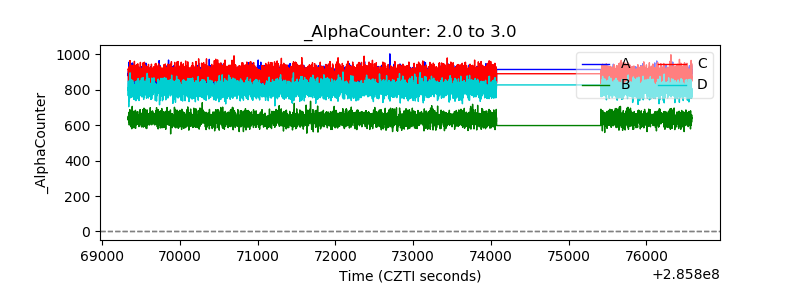 |
| _CPM_Rate | 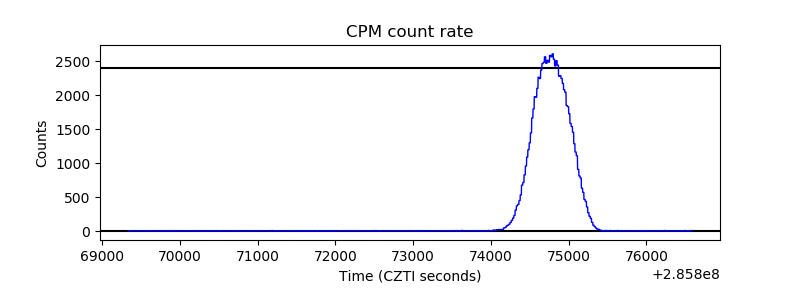 |
| CZT Counter | 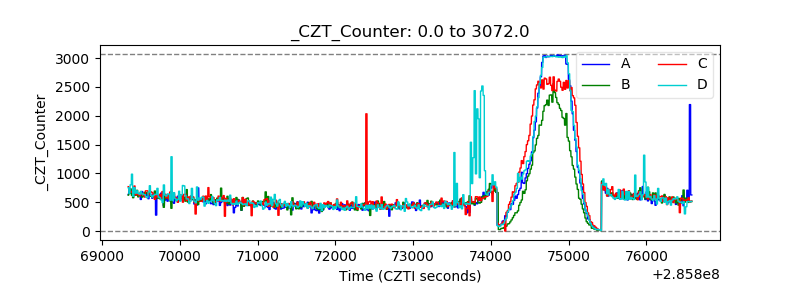 |
| +2.5 Volts monitor |  |
| +5 Volts monitor |  |
| _ROLL_ROT | 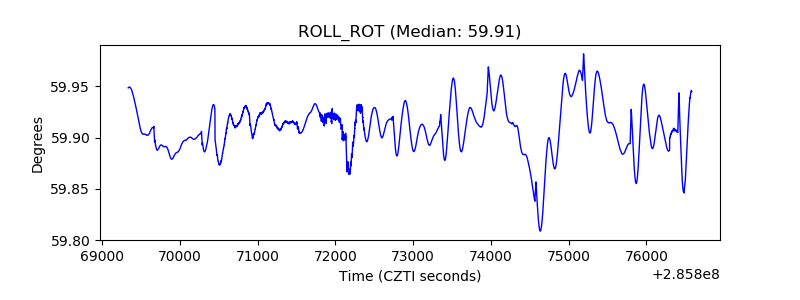 |
| _Roll_DEC | 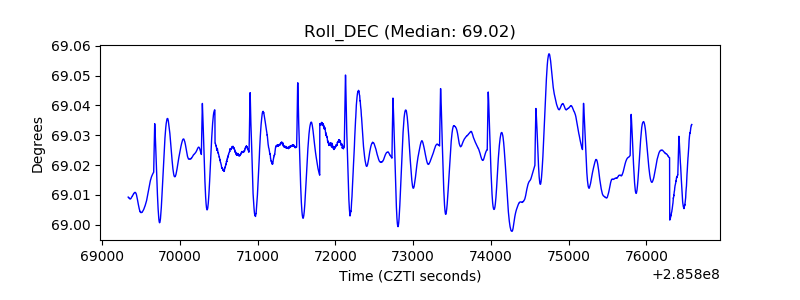 |
| _Roll_RA | 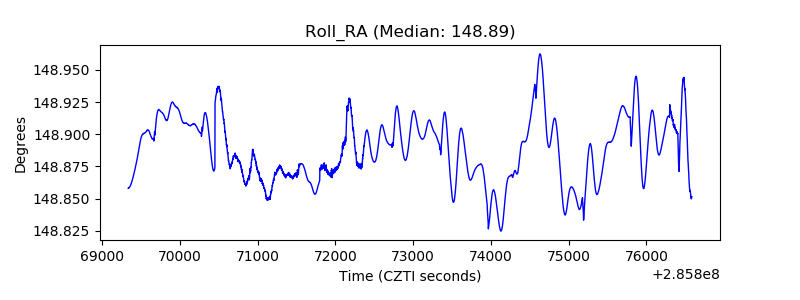 |
| Veto Counter |  |