| Param | Original file | Final file |
|---|---|---|
| Filename | modeM0/AS1T03_025T01_9000002670_17951cztM0_level2.evt | modeM0/AS1T03_025T01_9000002670_17951cztM0_level2_quad_clean.evt |
| Size (bytes) | 503,930,880 | 108,115,200 |
| Size | 480.6 MB | 103.1 MB |
| Events in quadrant A | 3,334,964 | 707,177 |
| Events in quadrant B | 3,485,285 | 726,491 |
| Events in quadrant C | 3,420,508 | 695,516 |
| Events in quadrant D | 4,541,018 | 653,216 |
| Mode SS | |||
|---|---|---|---|
| Quadrant | BADHDUFLAG | Total packets | Discarded packets |
| A | 0 | 144 | 0 |
| B | 0 | 144 | 0 |
| C | 0 | 144 | 0 |
| D | 0 | 144 | 0 |
| Mode M0 | |||
|---|---|---|---|
| Quadrant | BADHDUFLAG | Total packets | Discarded packets |
| A | 0 | 14888 | 3 |
| B | 0 | 15165 | 2 |
| C | 0 | 14885 | 2 |
| D | 0 | 18500 | 2 |
| Mode M9 | |||
|---|---|---|---|
| Quadrant | BADHDUFLAG | Total packets | Discarded packets |
| A | 0 | 20 | 0 |
| B | 0 | 20 | 0 |
| C | 0 | 20 | 0 |
| D | 0 | 20 | 0 |
| Quadrant | Total seconds | Saturated seconds | Saturation percentage |
|---|---|---|---|
| A | 7066 | 58 | 0.820832% |
| B | 7067 | 101 | 1.429178% |
| C | 7067 | 148 | 2.094241% |
| D | 7067 | 397 | 5.617660% |
Noise dominated data is calculated using 1-second bins in cleaned event files. If a bin has >2000 counts, and if more than 50% of those come from <1% of pixels, then it is considered to be noise-dominated and hence unusable.
| Quadrant | # 1 sec bins | Bins with >0 counts | Bins with >2000 counts | High rate bins dominated by noise | Noise dominated (total time) | Noise dominated (detector-on time) | Marked lightcurve |
|---|---|---|---|---|---|---|---|
| A | 9011 | 7068 | 14 | 14 | 0.16% | 0.20% | 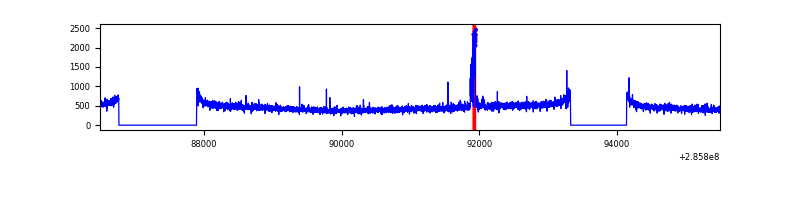 |
| B | 9012 | 7069 | 4 | 4 | 0.04% | 0.06% | 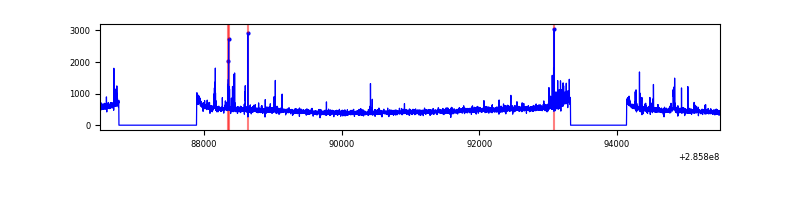 |
| C | 9012 | 7069 | 10 | 10 | 0.11% | 0.14% | 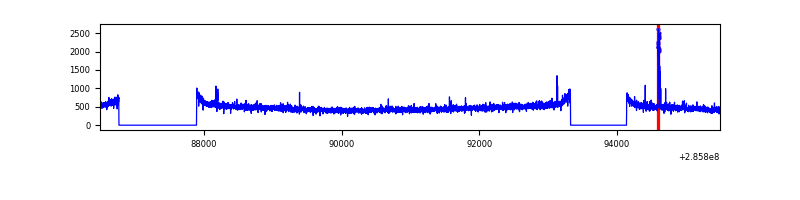 |
| D | 9011 | 7068 | 250 | 250 | 2.77% | 3.54% | 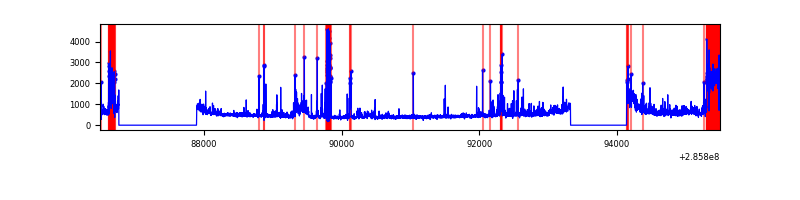 |
Top three noisy pixels from each quadrant. If the there are fewer than three noisy pixels in the level2.evt file, extra rows are filled as -1
| Pixel properties | Quadrant properties | ||||||
|---|---|---|---|---|---|---|---|
| Quadrant | DetID | PixID | Counts | Sigma | Mean | Median | Sigma |
| A | 15 | 174 | 94385 | 551.12 | 842 | 824 | 169.8 |
| A | 0 | 226 | 7272 | 37.98 | 842 | 824 | 169.8 |
| A | 3 | 137 | 6485 | 33.35 | 842 | 824 | 169.8 |
| B | 0 | 197 | 43961 | 269.54 | 853 | 830 | 160.0 |
| B | 7 | 220 | 43634 | 267.5 | 853 | 830 | 160.0 |
| B | 4 | 48 | 23115 | 139.27 | 853 | 830 | 160.0 |
| C | 14 | 238 | 126943 | 654.14 | 823 | 827 | 192.8 |
| C | 9 | 160 | 29405 | 148.23 | 823 | 827 | 192.8 |
| C | 9 | 176 | 22859 | 114.28 | 823 | 827 | 192.8 |
| D | 5 | 222 | 1118394 | 5755.29 | 804 | 781 | 194.2 |
| D | 2 | 165 | 189005 | 969.28 | 804 | 781 | 194.2 |
| D | 13 | 168 | 64010 | 325.61 | 804 | 781 | 194.2 |
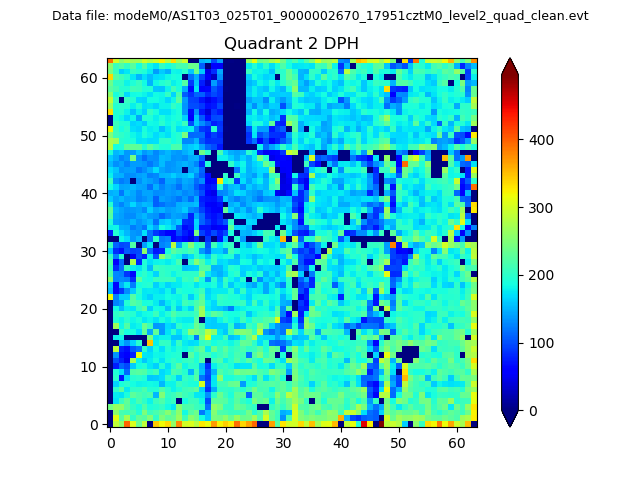
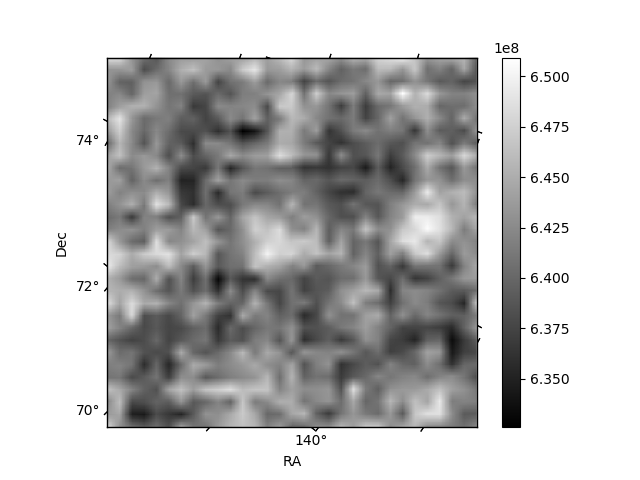
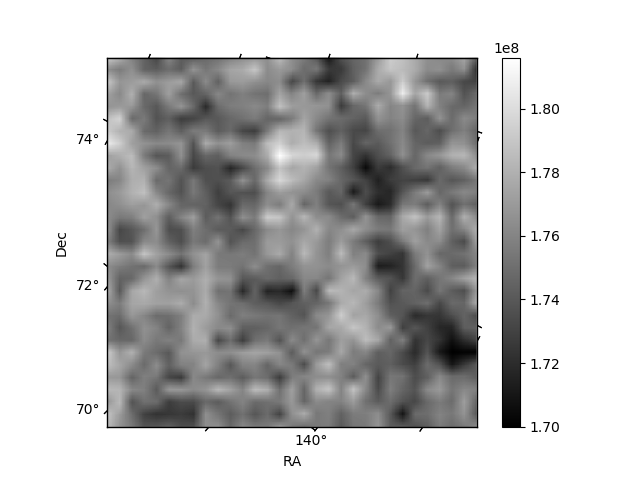
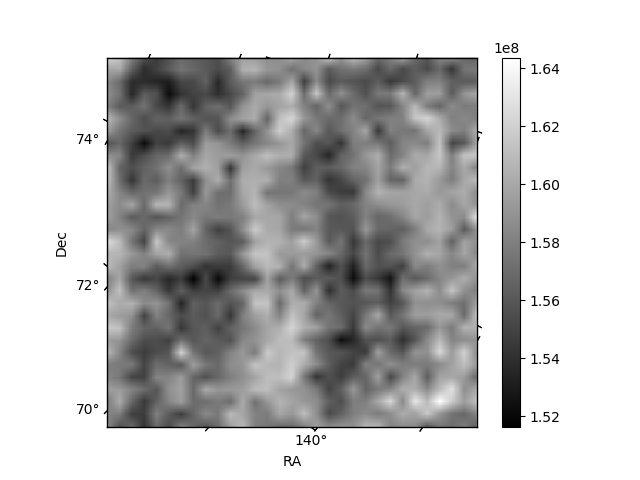
Histogram calculated using DETX and DETY for each event in the final _common_clean file
| Quadrant A | 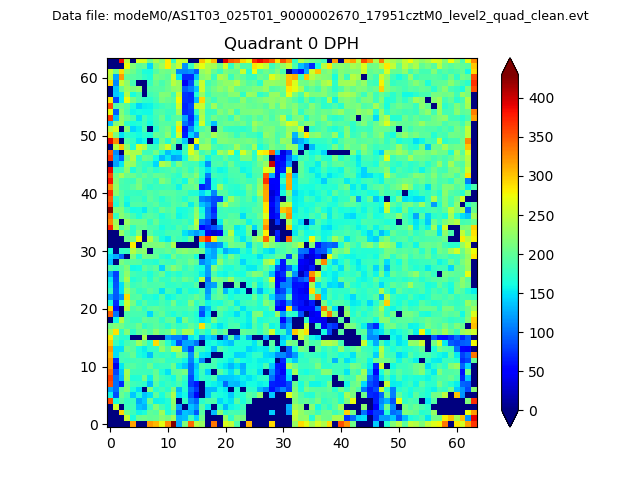 |
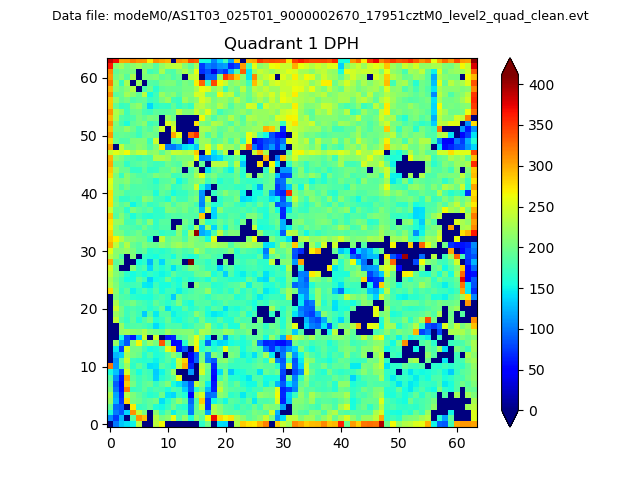 |
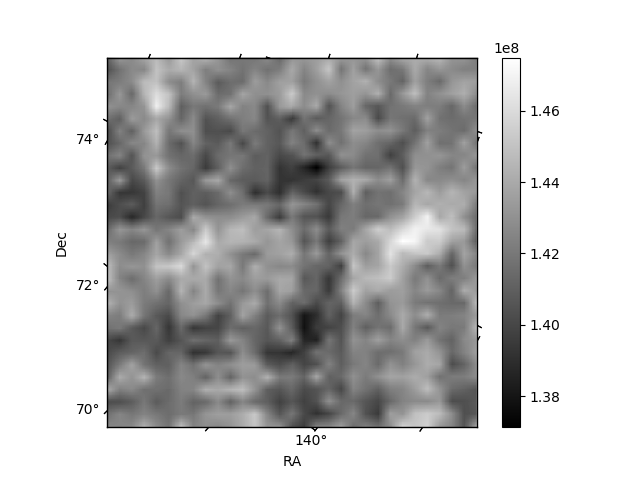
Quadrant B |
|---|---|---|---|
| Quadrant D | 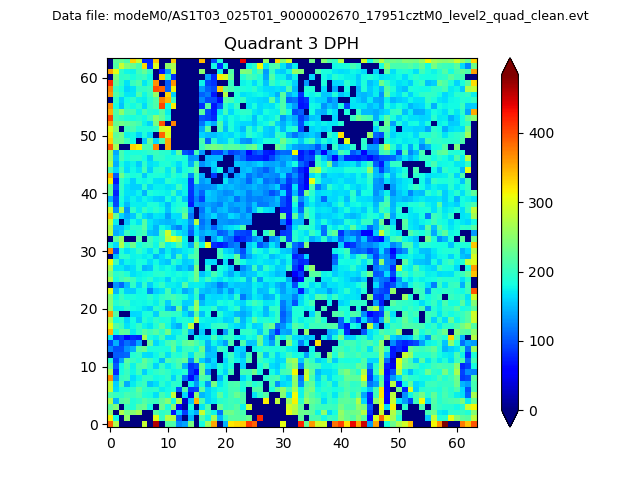 |
 |
Quadrant C |
| Plot type | Count rate plots | Images |
|---|---|---|
| Comparison with Poisson distribution Blue bars denote a histogram of data divided into 1 sec bins. Red curve is a Poisson curve with rate = median count rate of data. |
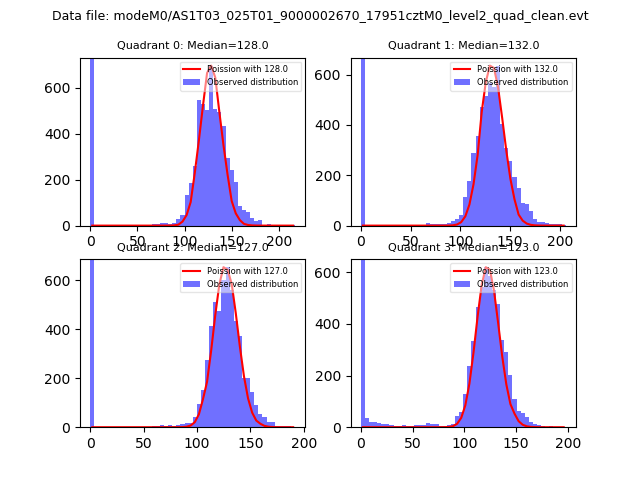 |
 |
| Quadrant-wise count rates Data is divided into 100 sec bins |
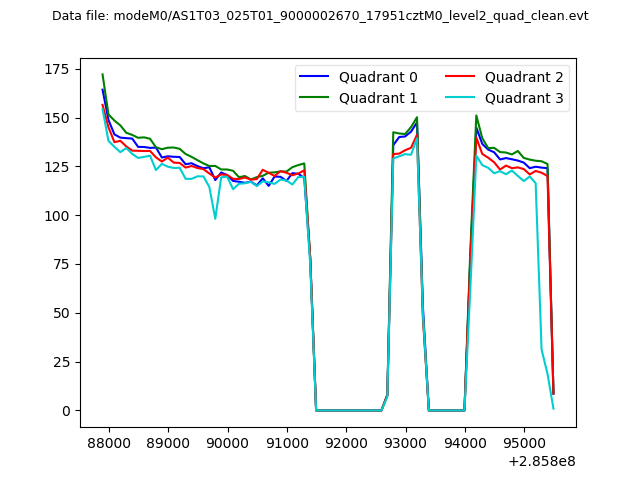 |
|
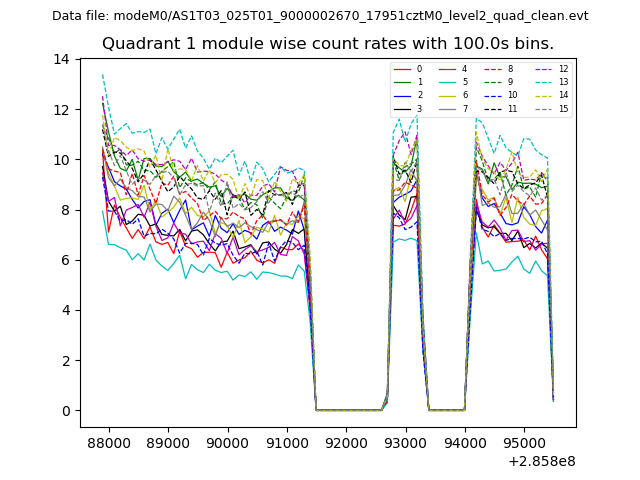
| Module-wise count rates for Quadrant A Data is divided into 100 sec bins |
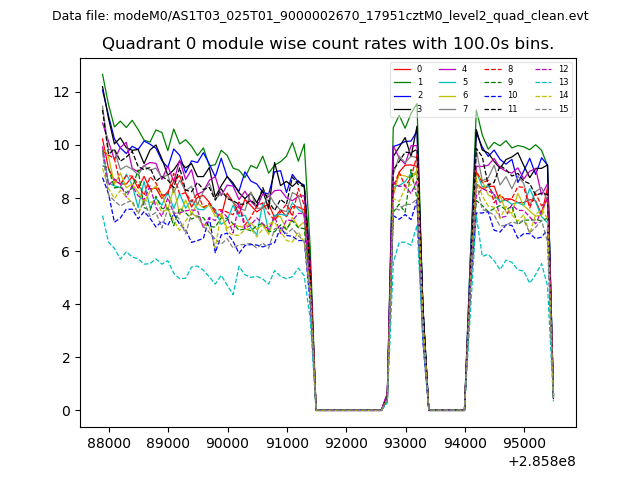 |
 |
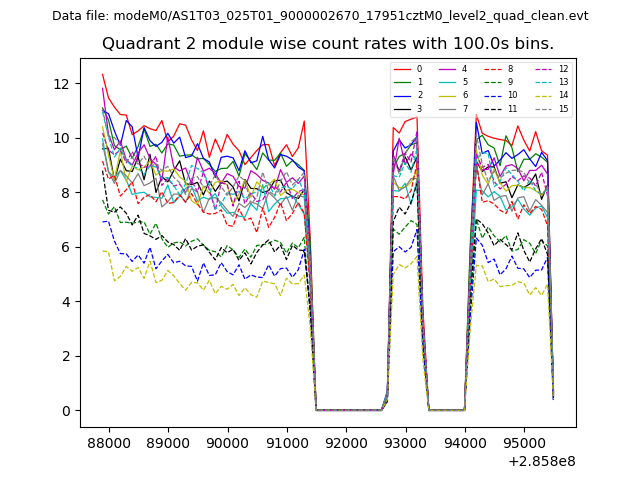
| Module-wise count rates for Quadrant B Data is divided into 100 sec bins |
 |
 |
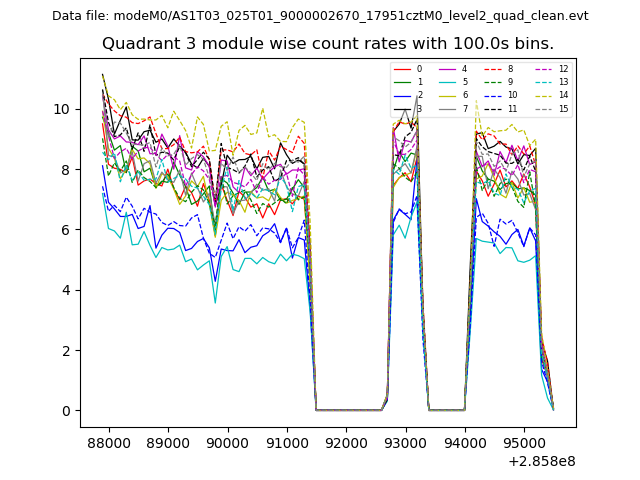
| Module-wise count rates for Quadrant C Data is divided into 100 sec bins |
 |
 |
| Module-wise count rates for Quadrant D Data is divided into 100 sec bins |
 |
 |
| Parameter | Plot |
|---|---|
| CZT HV Monitor | 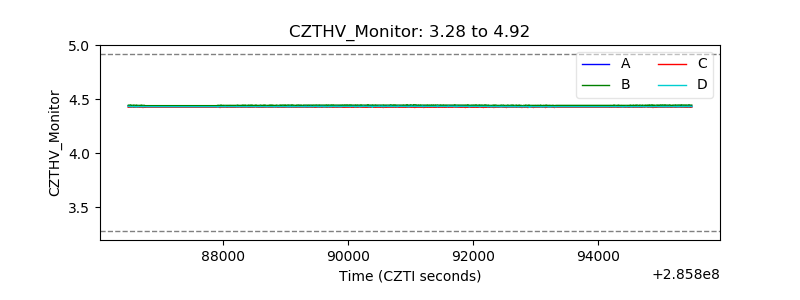 |
| D_VDD | 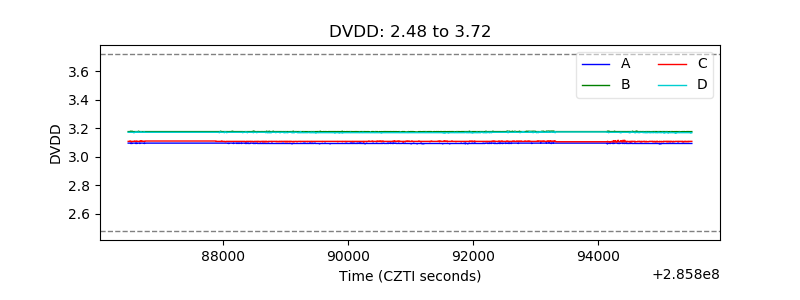 |
| Temperature 1 | 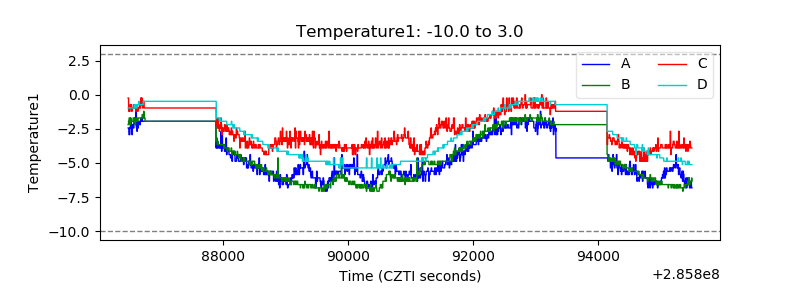 |
| Veto HV Monitor | 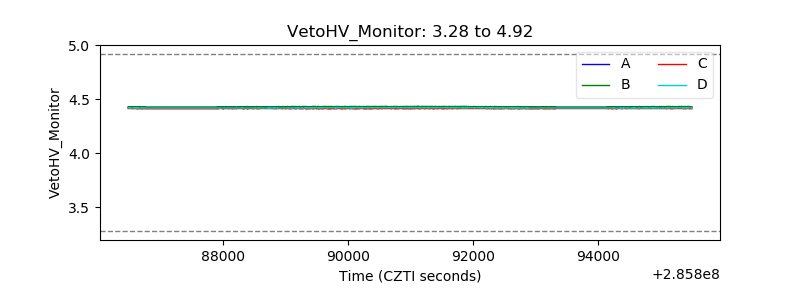 |
| Veto LLD | 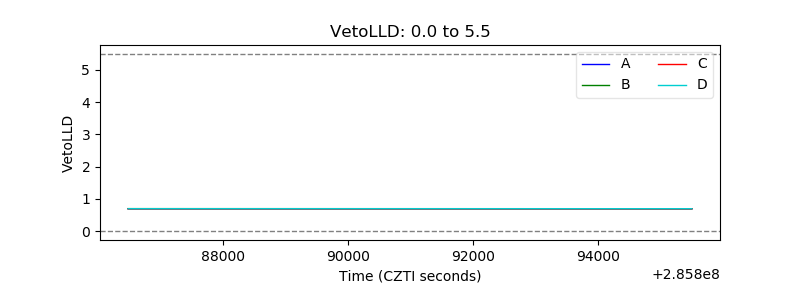 |
| Alpha Counter | 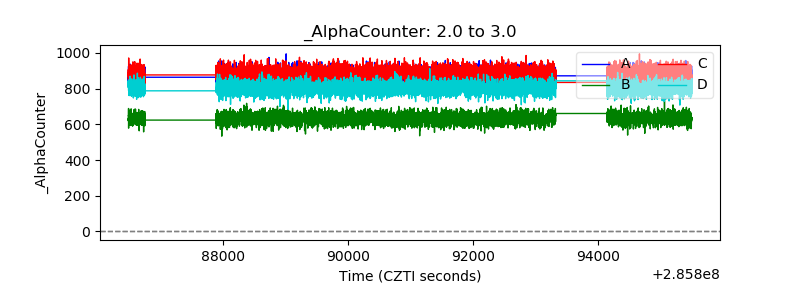 |
| _CPM_Rate | 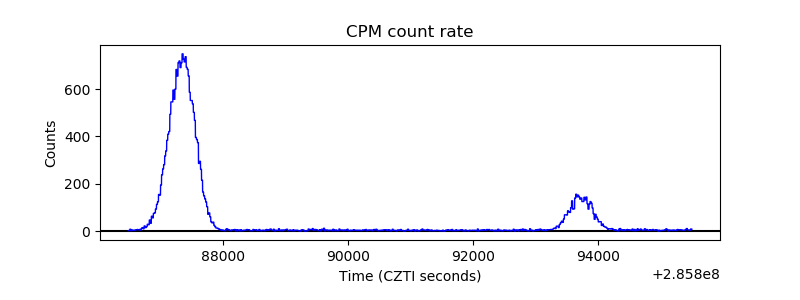 |
| CZT Counter | 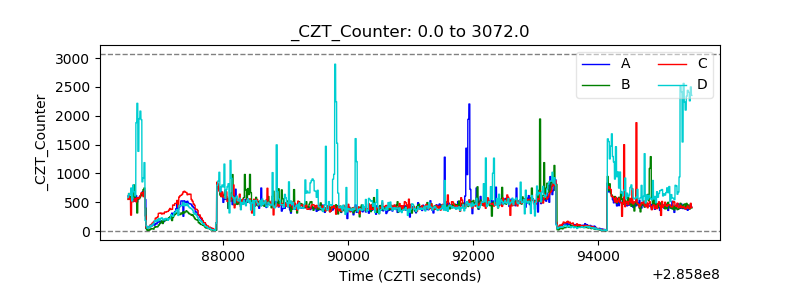 |
| +2.5 Volts monitor |  |
| +5 Volts monitor |  |
| _ROLL_ROT | 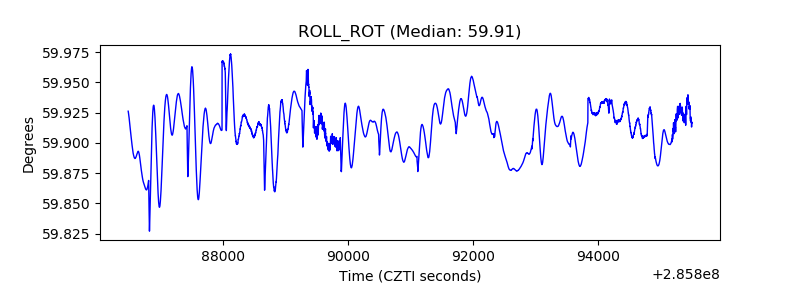 |
| _Roll_DEC | 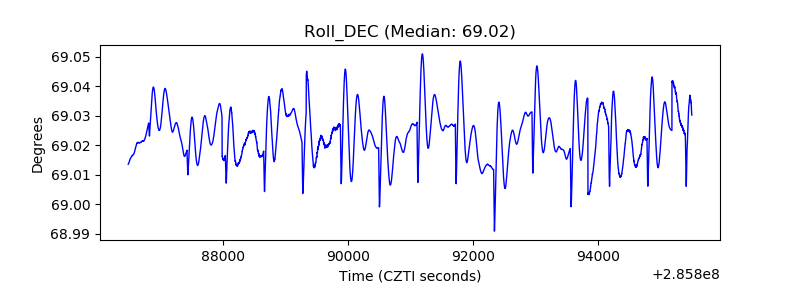 |
| _Roll_RA | 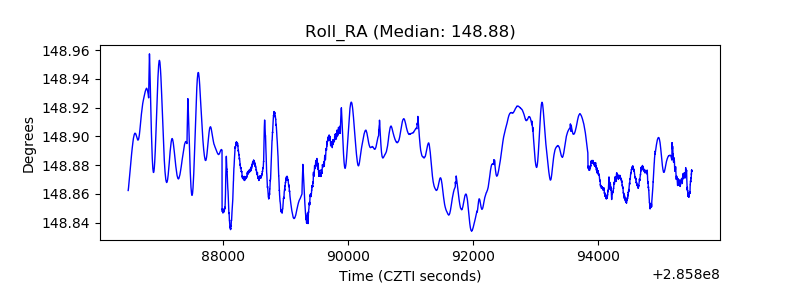 |
| Veto Counter | 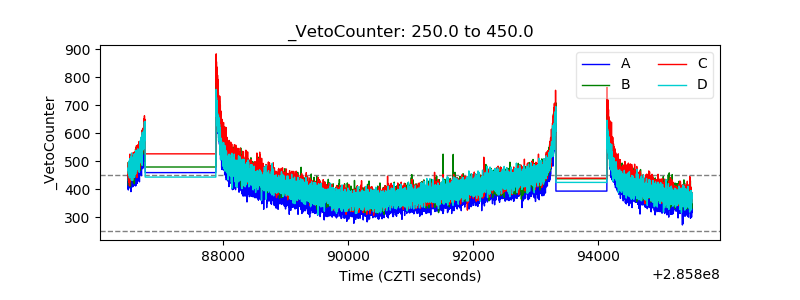 |