| Param | Original file | Final file |
|---|---|---|
| Filename | modeM0/AS1T03_025T01_9000002670_17953cztM0_level2.evt | modeM0/AS1T03_025T01_9000002670_17953cztM0_level2_quad_clean.evt |
| Size (bytes) | 556,534,080 | 127,958,400 |
| Size | 530.8 MB | 122.0 MB |
| Events in quadrant A | 3,733,943 | 837,898 |
| Events in quadrant B | 3,784,448 | 859,520 |
| Events in quadrant C | 4,405,136 | 814,898 |
| Events in quadrant D | 4,384,613 | 803,750 |
| Mode SS | |||
|---|---|---|---|
| Quadrant | BADHDUFLAG | Total packets | Discarded packets |
| A | 0 | 166 | 0 |
| B | 0 | 166 | 0 |
| C | 0 | 166 | 0 |
| D | 0 | 166 | 0 |
| Mode M0 | |||
|---|---|---|---|
| Quadrant | BADHDUFLAG | Total packets | Discarded packets |
| A | 0 | 16858 | 2 |
| B | 0 | 16801 | 2 |
| C | 0 | 18575 | 2 |
| D | 0 | 18888 | 2 |
| Mode M9 | |||
|---|---|---|---|
| Quadrant | BADHDUFLAG | Total packets | Discarded packets |
| A | 0 | 6 | 0 |
| B | 0 | 6 | 0 |
| C | 0 | 6 | 0 |
| D | 0 | 6 | 0 |
| Quadrant | Total seconds | Saturated seconds | Saturation percentage |
|---|---|---|---|
| A | 8041 | 106 | 1.318244% |
| B | 8042 | 125 | 1.554340% |
| C | 8042 | 391 | 4.861975% |
| D | 8042 | 180 | 2.238249% |
Noise dominated data is calculated using 1-second bins in cleaned event files. If a bin has >2000 counts, and if more than 50% of those come from <1% of pixels, then it is considered to be noise-dominated and hence unusable.
| Quadrant | # 1 sec bins | Bins with >0 counts | Bins with >2000 counts | High rate bins dominated by noise | Noise dominated (total time) | Noise dominated (detector-on time) | Marked lightcurve |
|---|---|---|---|---|---|---|---|
| A | 8711 | 8043 | 27 | 27 | 0.31% | 0.34% | 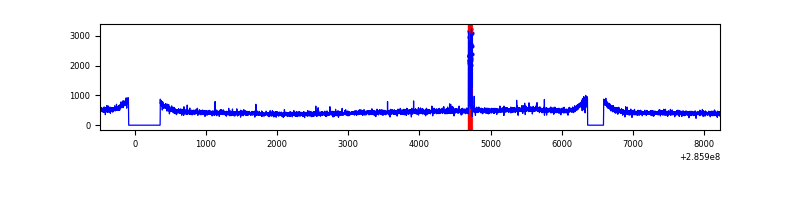 |
| B | 8712 | 8044 | 3 | 3 | 0.03% | 0.04% | 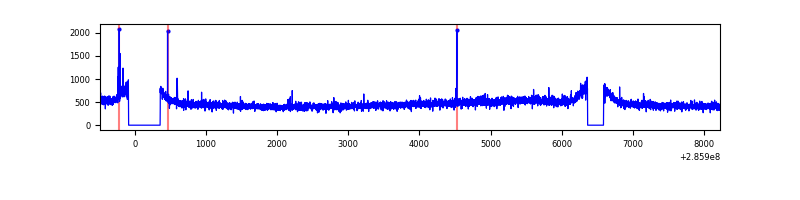 |
| C | 8712 | 8044 | 160 | 160 | 1.84% | 1.99% | 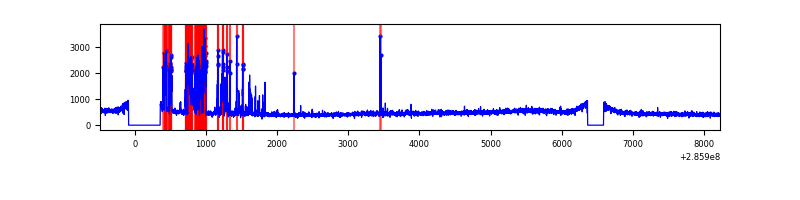 |
| D | 8712 | 8044 | 102 | 102 | 1.17% | 1.27% | 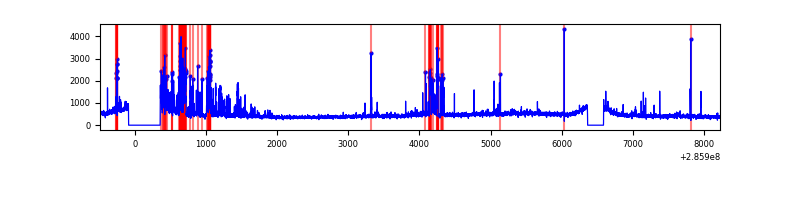 |
Top three noisy pixels from each quadrant. If the there are fewer than three noisy pixels in the level2.evt file, extra rows are filled as -1
| Pixel properties | Quadrant properties | ||||||
|---|---|---|---|---|---|---|---|
| Quadrant | DetID | PixID | Counts | Sigma | Mean | Median | Sigma |
| A | 15 | 174 | 89508 | 463.71 | 948 | 925 | 191.0 |
| A | 0 | 226 | 8108 | 37.6 | 948 | 925 | 191.0 |
| A | 3 | 137 | 7433 | 34.07 | 948 | 925 | 191.0 |
| B | 12 | 111 | 22377 | 116.64 | 959 | 932 | 183.9 |
| B | 11 | 111 | 18952 | 98.01 | 959 | 932 | 183.9 |
| B | 14 | 111 | 15961 | 81.74 | 959 | 932 | 183.9 |
| C | 9 | 160 | 423771 | 1973.53 | 914 | 918 | 214.3 |
| C | 9 | 176 | 252180 | 1172.69 | 914 | 918 | 214.3 |
| C | 14 | 238 | 141998 | 658.45 | 914 | 918 | 214.3 |
| D | 5 | 222 | 802013 | 3599.43 | 921 | 893 | 222.6 |
| D | 7 | 96 | 32360 | 141.38 | 921 | 893 | 222.6 |
| D | 2 | 234 | 30475 | 132.91 | 921 | 893 | 222.6 |
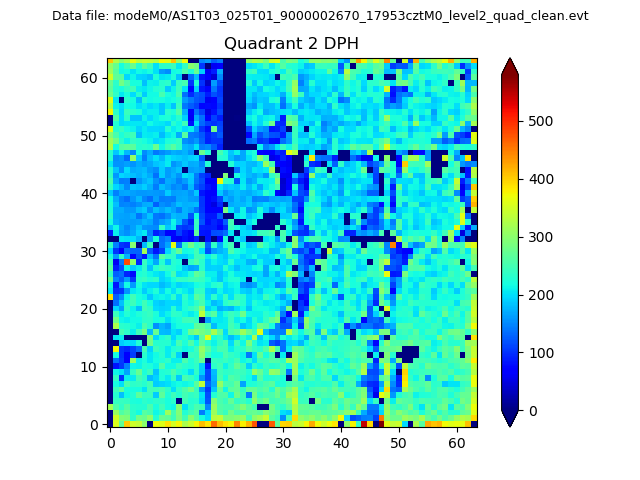
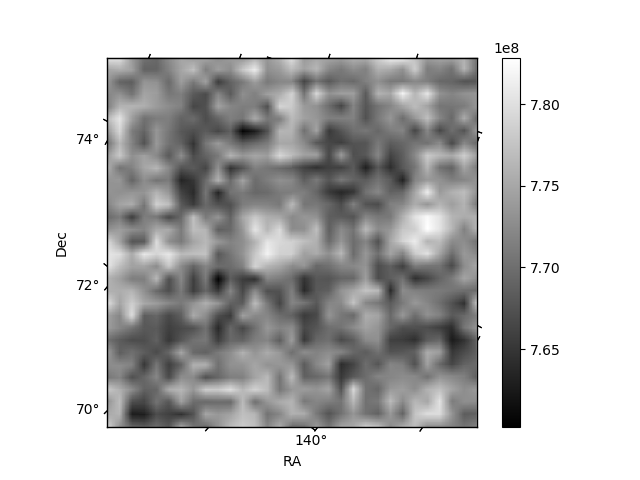
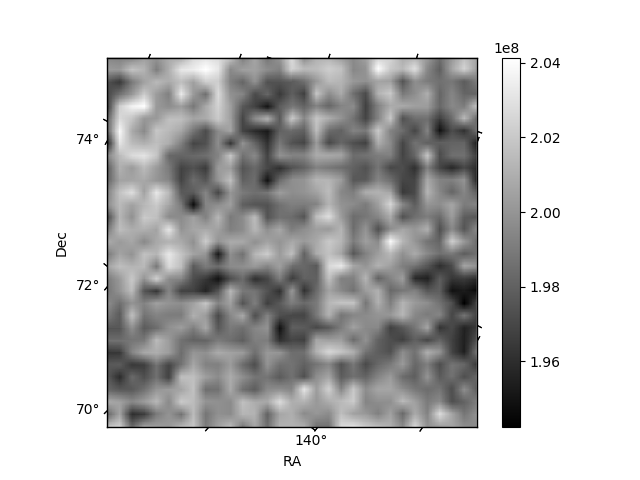
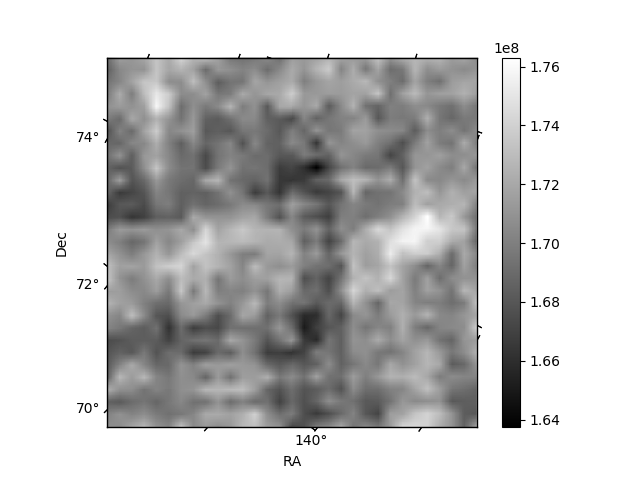
Histogram calculated using DETX and DETY for each event in the final _common_clean file
| Quadrant A | 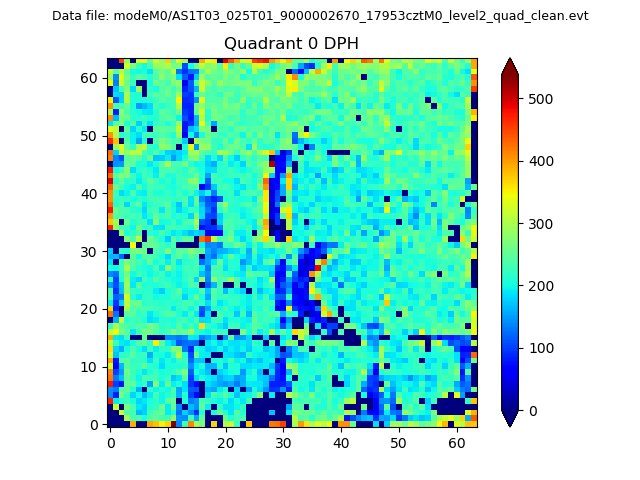 |
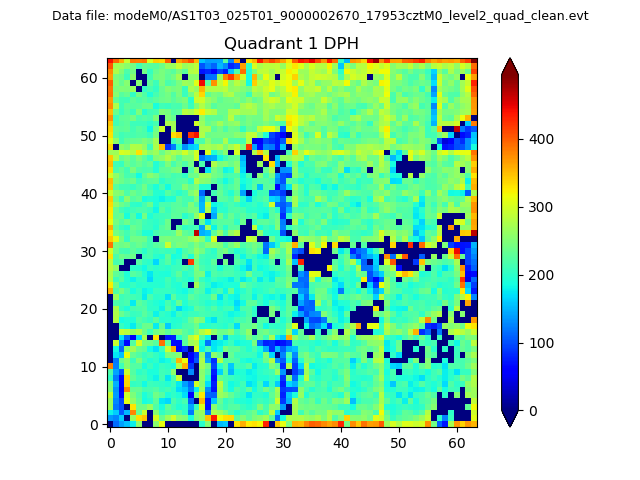 |
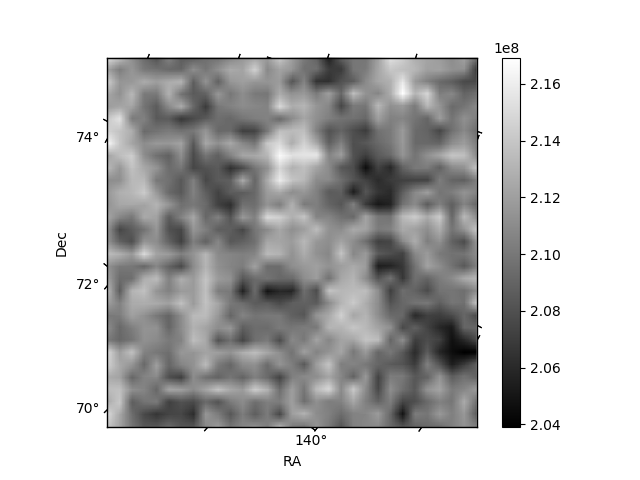
Quadrant B |
|---|---|---|---|
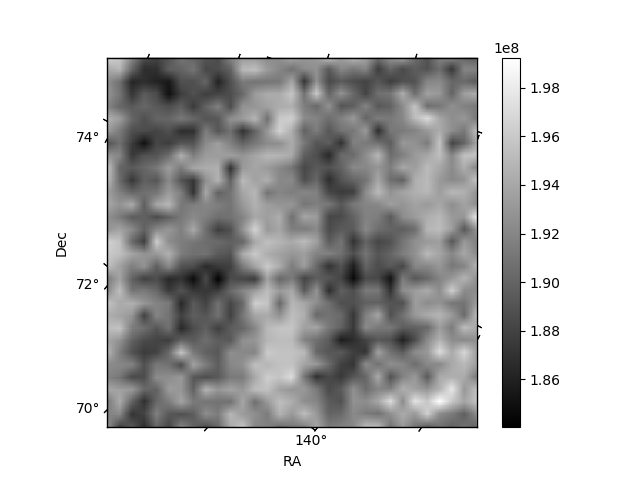
| Quadrant D | 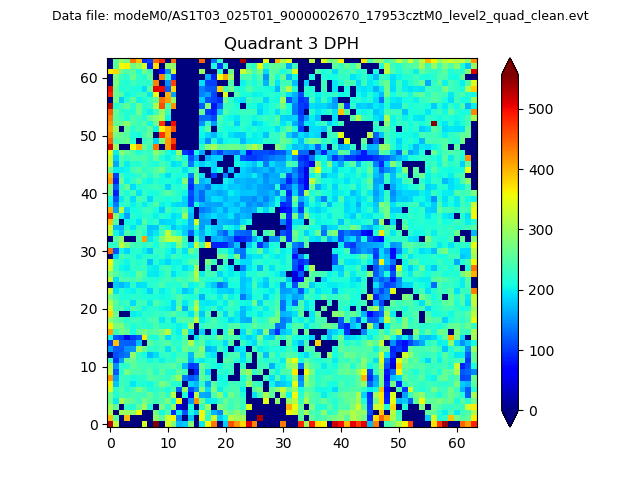 |
 |
Quadrant C |
| Plot type | Count rate plots | Images |
|---|---|---|
| Comparison with Poisson distribution Blue bars denote a histogram of data divided into 1 sec bins. Red curve is a Poisson curve with rate = median count rate of data. |
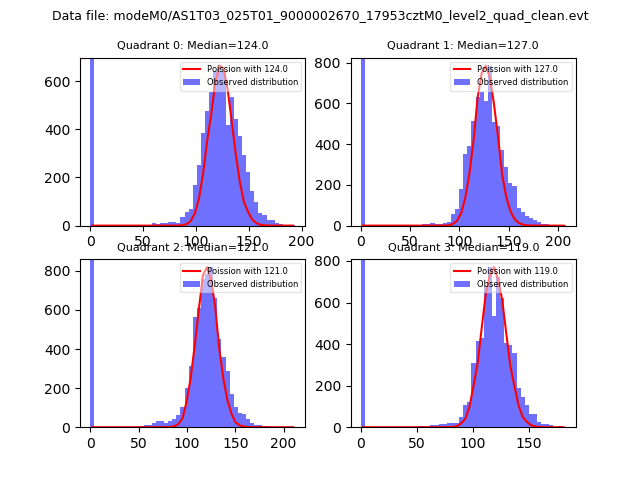 |
 |
| Quadrant-wise count rates Data is divided into 100 sec bins |
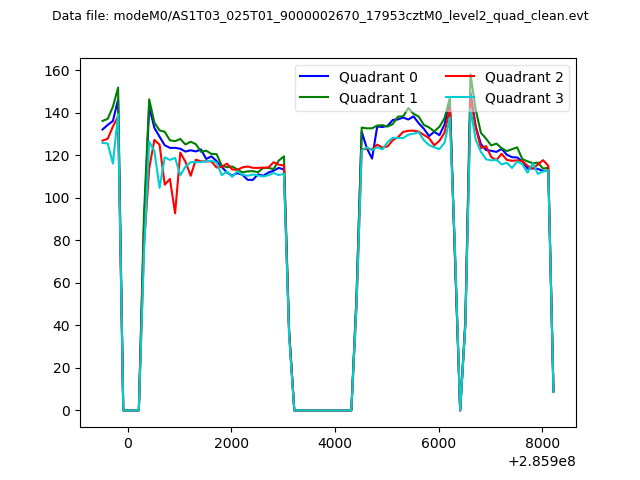 |
|
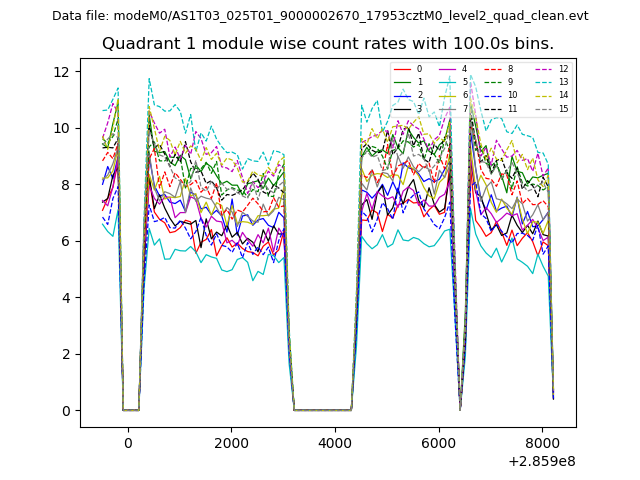
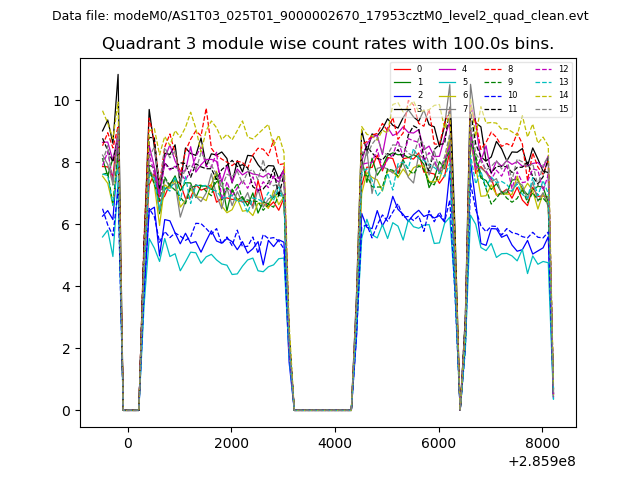
| Module-wise count rates for Quadrant A Data is divided into 100 sec bins |
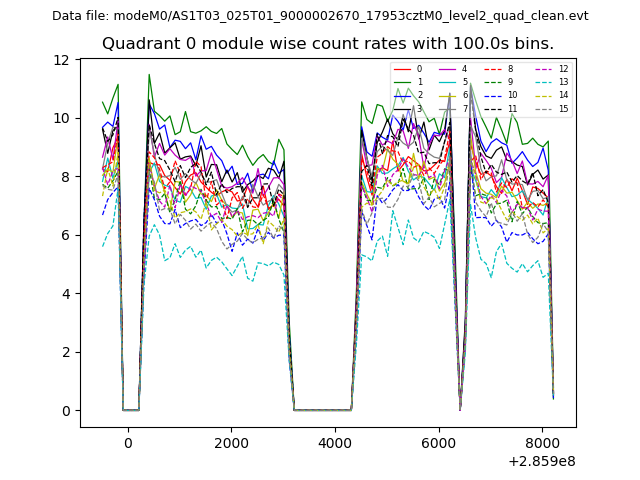 |
 |
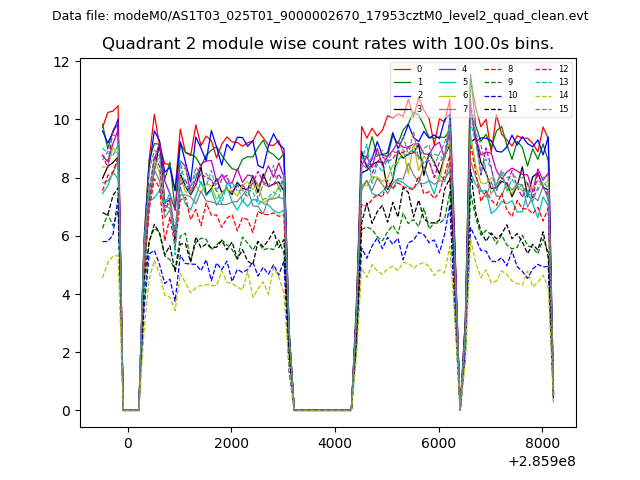
| Module-wise count rates for Quadrant B Data is divided into 100 sec bins |
 |
 |
| Module-wise count rates for Quadrant C Data is divided into 100 sec bins |
 |
 |
| Module-wise count rates for Quadrant D Data is divided into 100 sec bins |
 |
 |
| Parameter | Plot |
|---|---|
| CZT HV Monitor | 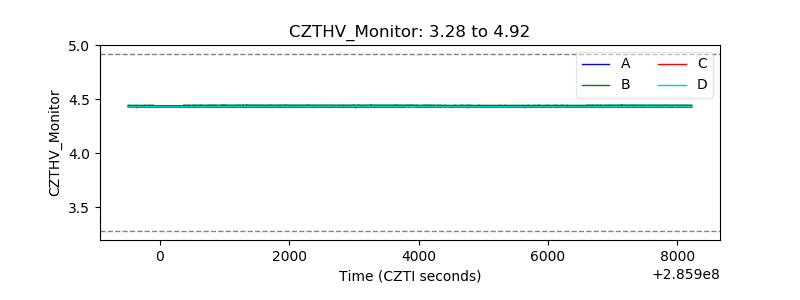 |
| D_VDD | 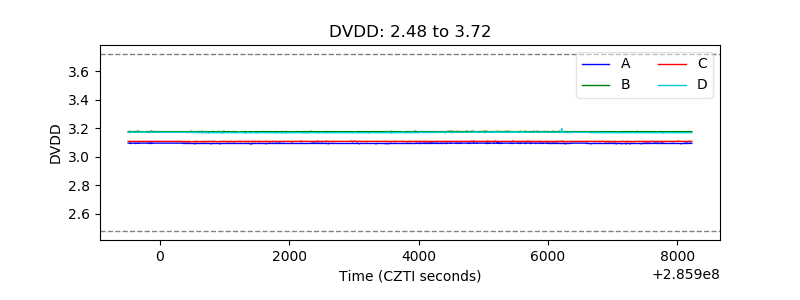 |
| Temperature 1 | 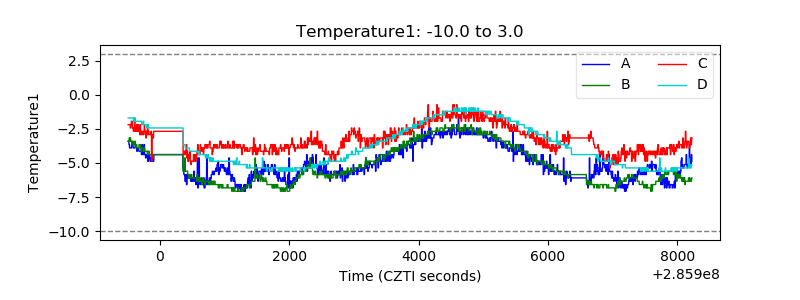 |
| Veto HV Monitor | 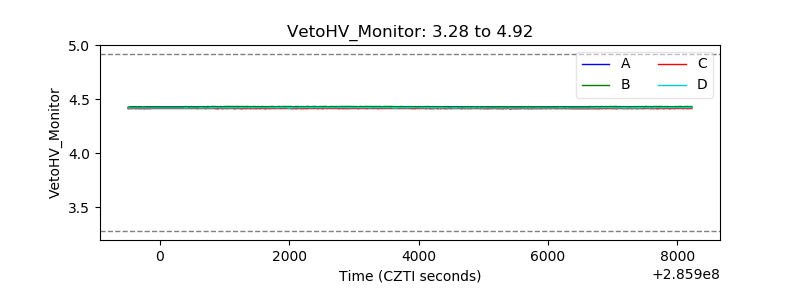 |
| Veto LLD |  |
| Alpha Counter | 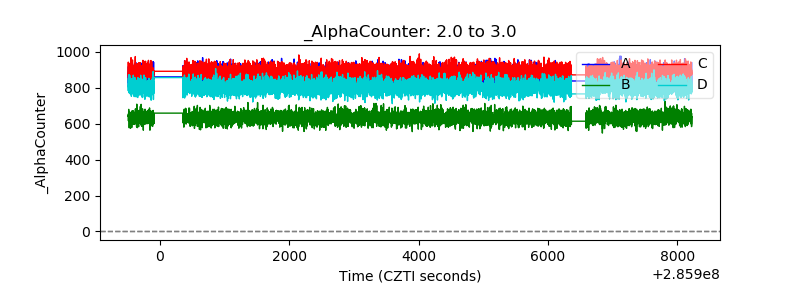 |
| _CPM_Rate | 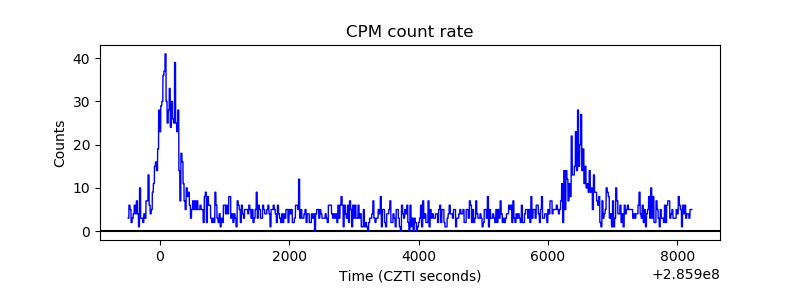 |
| CZT Counter | 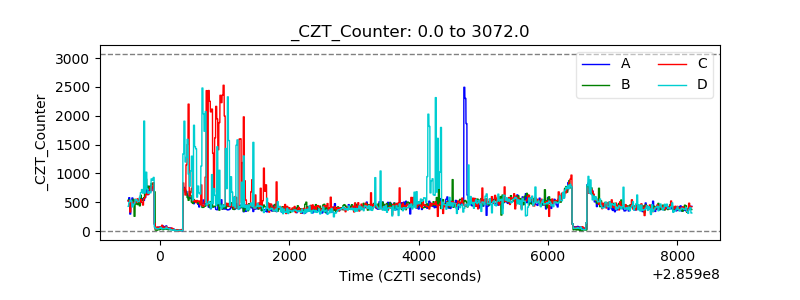 |
| +2.5 Volts monitor |  |
| +5 Volts monitor |  |
| _ROLL_ROT |  |
| _Roll_DEC |  |
| _Roll_RA | 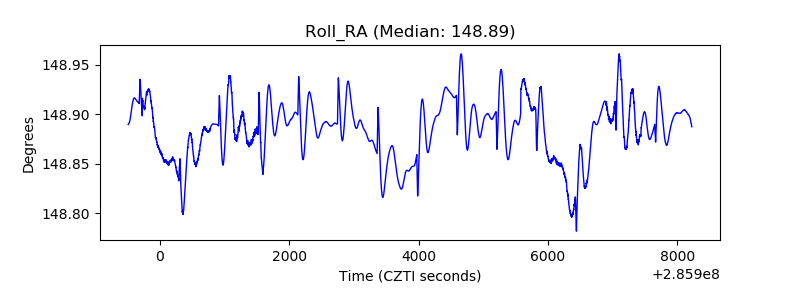 |
| Veto Counter | 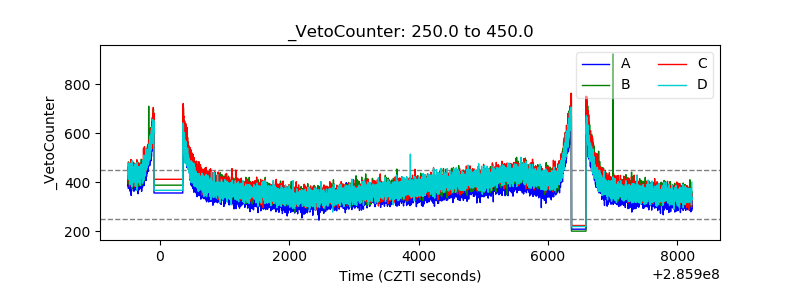 |