| Param | Original file | Final file |
|---|---|---|
| Filename | modeM0/AS1T03_025T01_9000002670_17954cztM0_level2.evt | modeM0/AS1T03_025T01_9000002670_17954cztM0_level2_quad_clean.evt |
| Size (bytes) | 560,566,080 | 135,878,400 |
| Size | 534.6 MB | 129.6 MB |
| Events in quadrant A | 3,875,986 | 890,099 |
| Events in quadrant B | 3,980,409 | 911,821 |
| Events in quadrant C | 4,138,240 | 871,895 |
| Events in quadrant D | 4,406,413 | 852,770 |
| Mode SS | |||
|---|---|---|---|
| Quadrant | BADHDUFLAG | Total packets | Discarded packets |
| A | 0 | 174 | 0 |
| B | 0 | 174 | 0 |
| C | 0 | 174 | 0 |
| D | 0 | 174 | 0 |
| Mode M0 | |||
|---|---|---|---|
| Quadrant | BADHDUFLAG | Total packets | Discarded packets |
| A | 0 | 17442 | 2 |
| B | 0 | 17536 | 2 |
| C | 0 | 18015 | 2 |
| D | 0 | 19122 | 2 |
| Mode M9 | |||
|---|---|---|---|
| Quadrant | BADHDUFLAG | Total packets | Discarded packets |
| A | 0 | 6 | 0 |
| B | 0 | 6 | 0 |
| C | 0 | 6 | 0 |
| D | 0 | 6 | 0 |
| Quadrant | Total seconds | Saturated seconds | Saturation percentage |
|---|---|---|---|
| A | 8475 | 103 | 1.215339% |
| B | 8476 | 148 | 1.746107% |
| C | 8475 | 143 | 1.687316% |
| D | 8475 | 189 | 2.230088% |
Noise dominated data is calculated using 1-second bins in cleaned event files. If a bin has >2000 counts, and if more than 50% of those come from <1% of pixels, then it is considered to be noise-dominated and hence unusable.
| Quadrant | # 1 sec bins | Bins with >0 counts | Bins with >2000 counts | High rate bins dominated by noise | Noise dominated (total time) | Noise dominated (detector-on time) | Marked lightcurve |
|---|---|---|---|---|---|---|---|
| A | 9080 | 8477 | 0 | 0 | 0.00% | 0.00% | 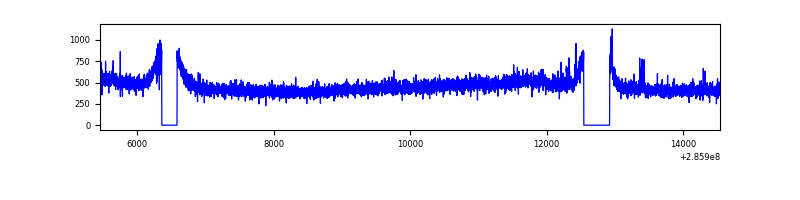 |
| B | 9081 | 8478 | 1 | 1 | 0.01% | 0.01% | 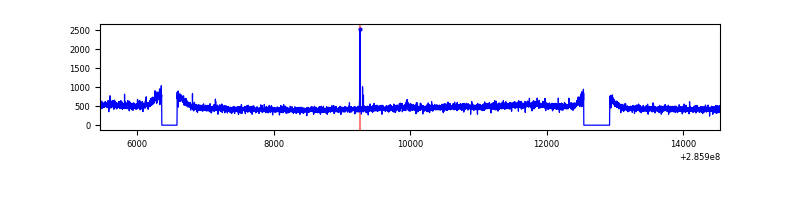 |
| C | 9080 | 8477 | 11 | 11 | 0.12% | 0.13% | 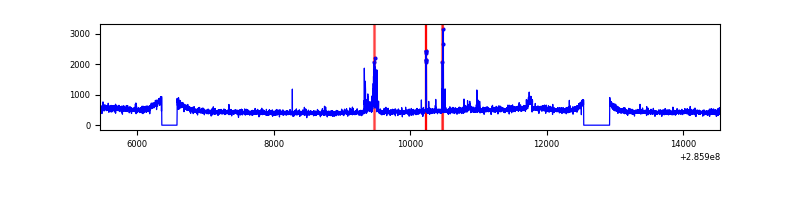 |
| D | 9080 | 8477 | 123 | 123 | 1.35% | 1.45% | 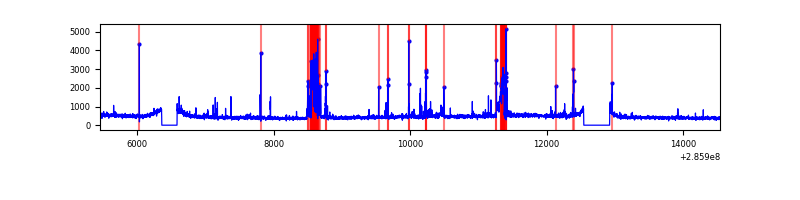 |
Top three noisy pixels from each quadrant. If the there are fewer than three noisy pixels in the level2.evt file, extra rows are filled as -1
| Pixel properties | Quadrant properties | ||||||
|---|---|---|---|---|---|---|---|
| Quadrant | DetID | PixID | Counts | Sigma | Mean | Median | Sigma |
| A | 15 | 174 | 24234 | 114.3 | 1002 | 979 | 203.5 |
| A | 0 | 226 | 8620 | 37.56 | 1002 | 979 | 203.5 |
| A | 3 | 137 | 8015 | 34.58 | 1002 | 979 | 203.5 |
| B | 12 | 111 | 23792 | 118.44 | 1011 | 984 | 192.6 |
| B | 11 | 111 | 20537 | 101.54 | 1011 | 984 | 192.6 |
| B | 14 | 111 | 17038 | 83.37 | 1011 | 984 | 192.6 |
| C | 9 | 54 | 173670 | 755.16 | 972 | 976 | 228.7 |
| C | 14 | 238 | 148704 | 645.99 | 972 | 976 | 228.7 |
| C | 3 | 233 | 20260 | 84.32 | 972 | 976 | 228.7 |
| D | 2 | 165 | 364588 | 1534.17 | 971 | 940 | 237.0 |
| D | 10 | 70 | 188915 | 793.03 | 971 | 940 | 237.0 |
| D | 5 | 222 | 60457 | 251.09 | 971 | 940 | 237.0 |
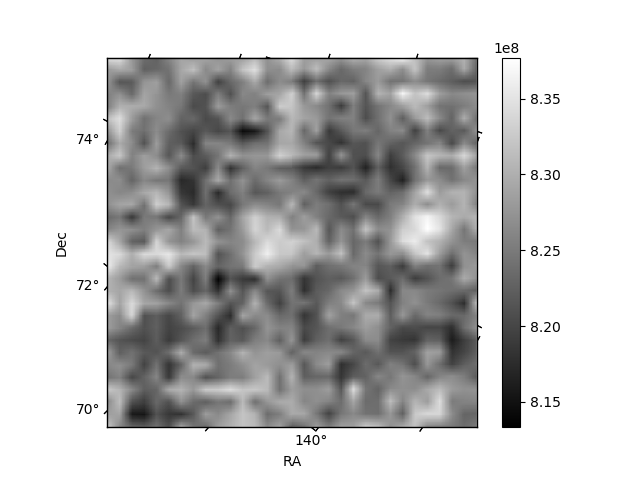
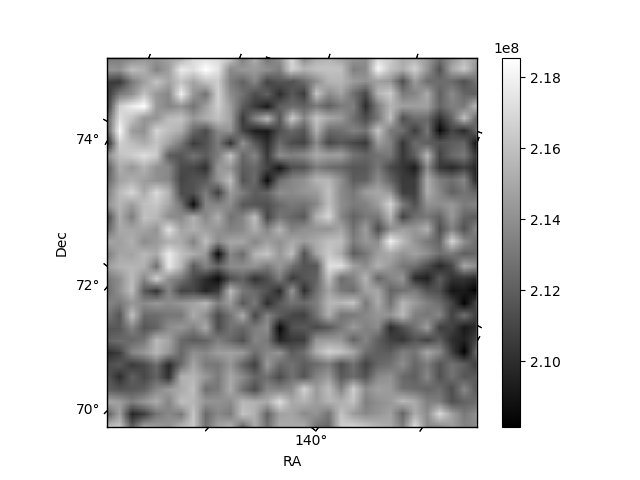
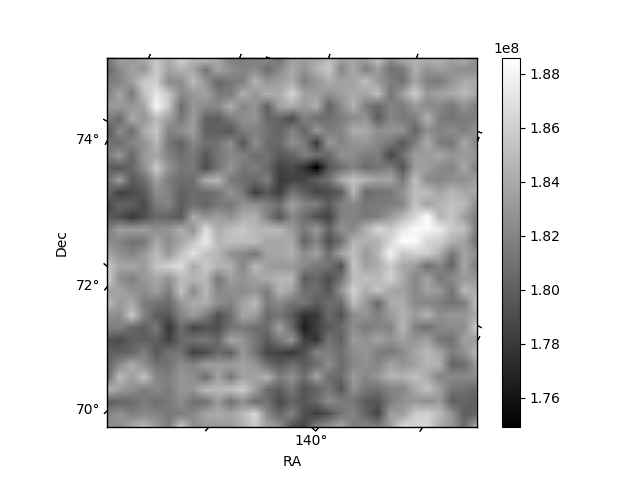
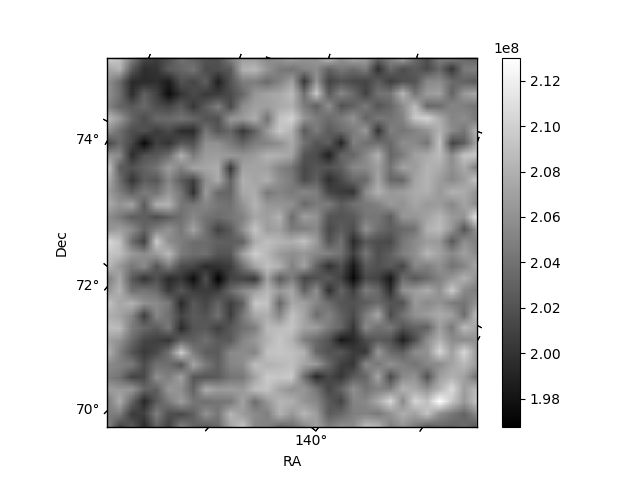
Histogram calculated using DETX and DETY for each event in the final _common_clean file
| Quadrant A | 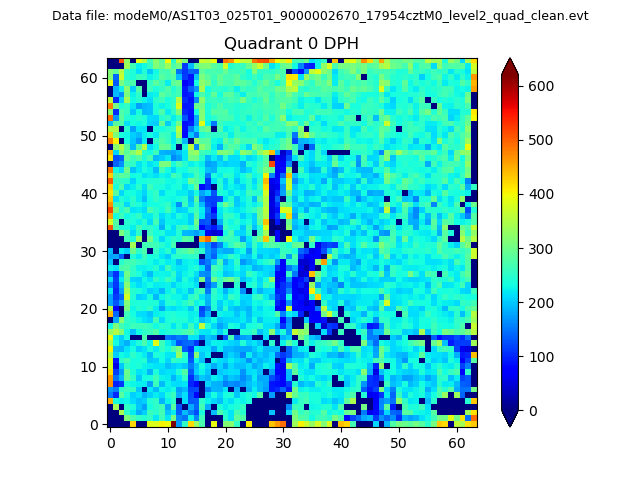 |
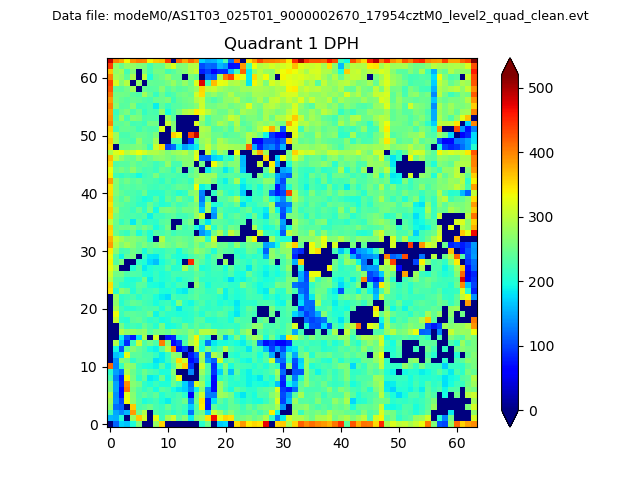 |
Quadrant B |
|---|---|---|---|
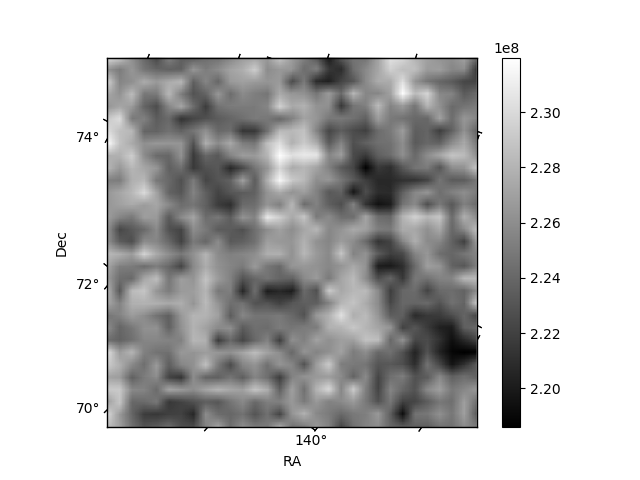
| Quadrant D | 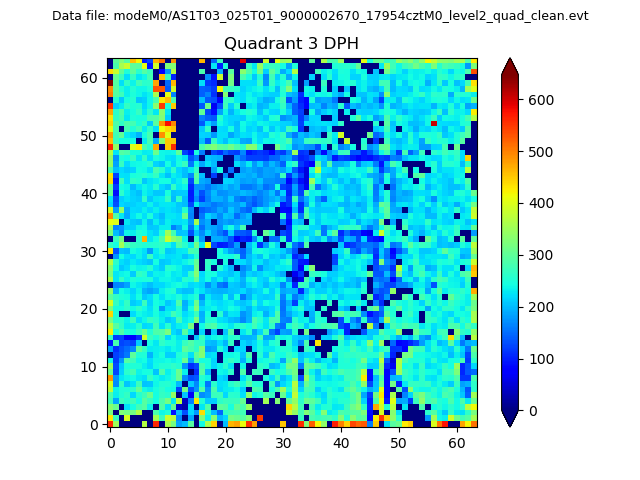 |
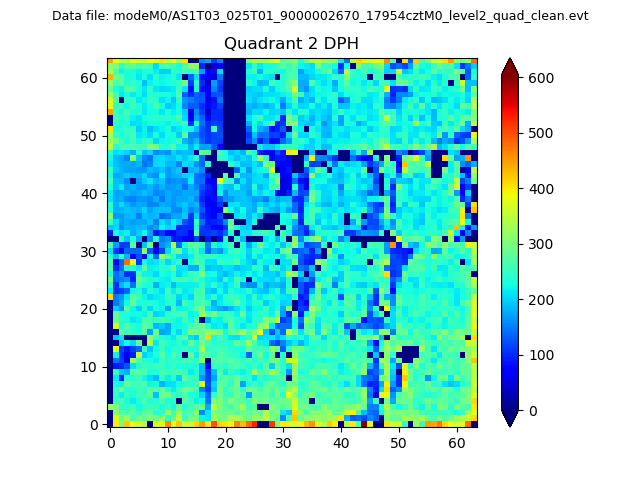 |
Quadrant C |
| Plot type | Count rate plots | Images |
|---|---|---|
| Comparison with Poisson distribution Blue bars denote a histogram of data divided into 1 sec bins. Red curve is a Poisson curve with rate = median count rate of data. |
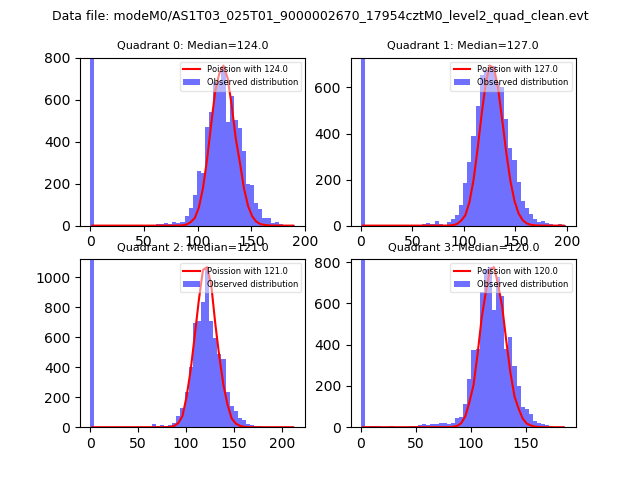 |
 |
| Quadrant-wise count rates Data is divided into 100 sec bins |
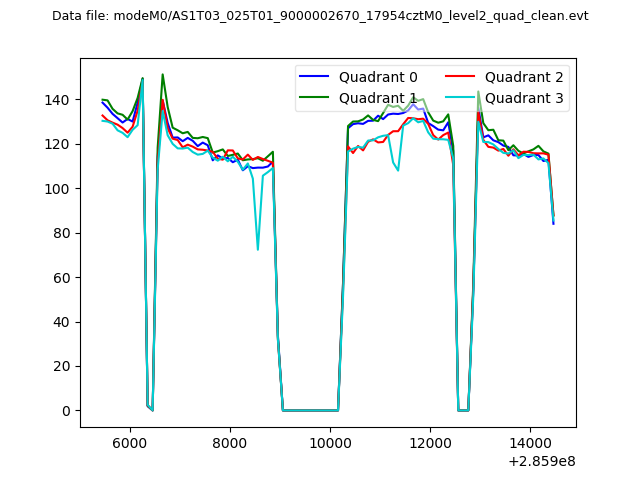 |
|
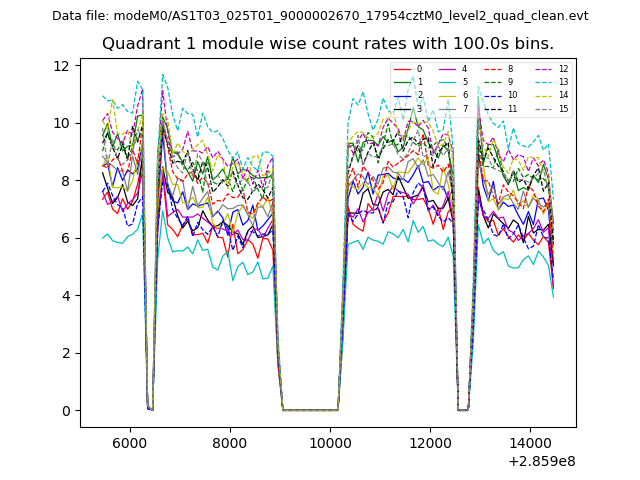
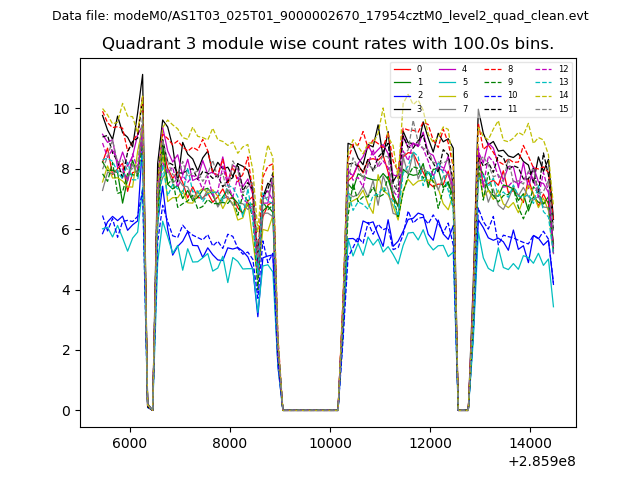
| Module-wise count rates for Quadrant A Data is divided into 100 sec bins |
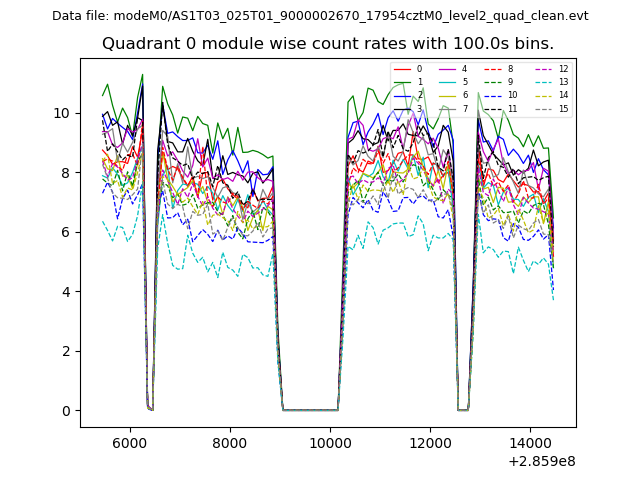 |
 |
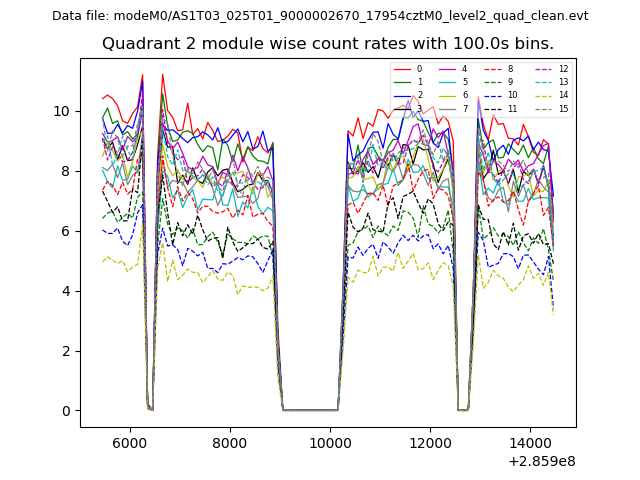
| Module-wise count rates for Quadrant B Data is divided into 100 sec bins |
 |
 |
| Module-wise count rates for Quadrant C Data is divided into 100 sec bins |
 |
 |
| Module-wise count rates for Quadrant D Data is divided into 100 sec bins |
 |
 |
| Parameter | Plot |
|---|---|
| CZT HV Monitor | 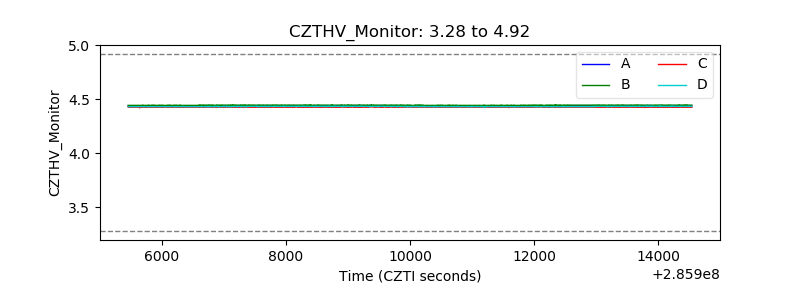 |
| D_VDD | 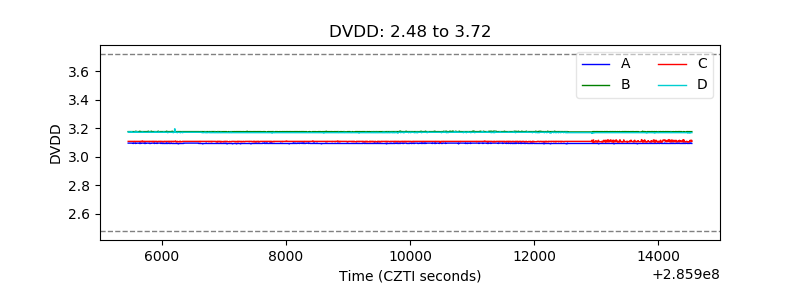 |
| Temperature 1 | 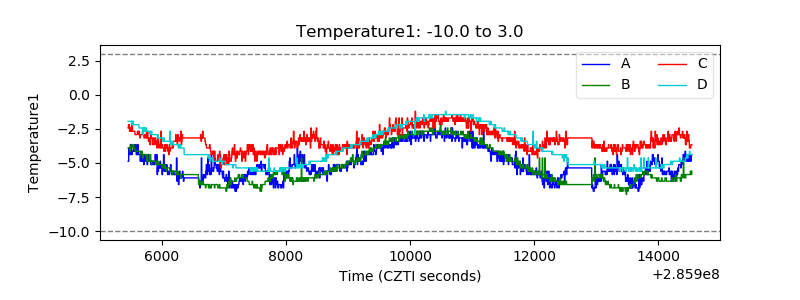 |
| Veto HV Monitor | 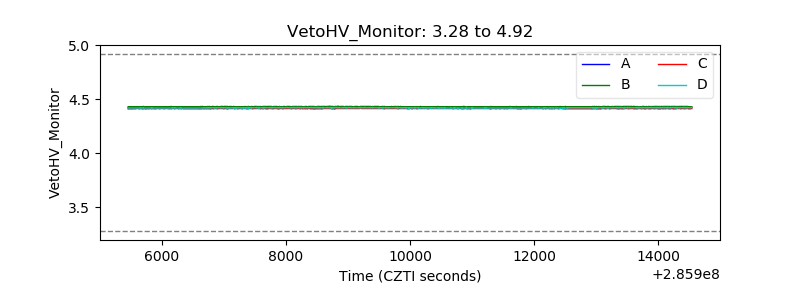 |
| Veto LLD | 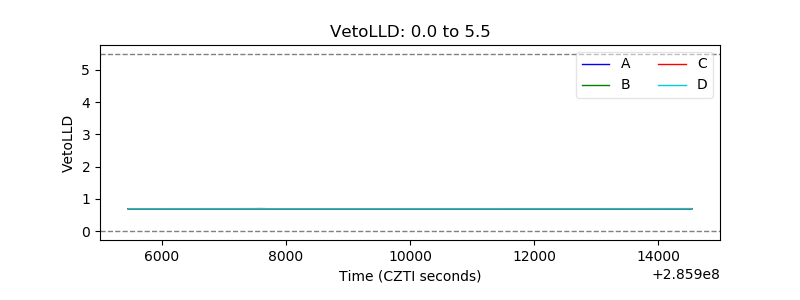 |
| Alpha Counter | 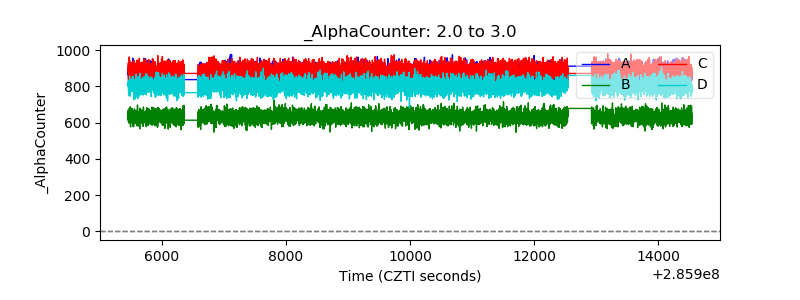 |
| _CPM_Rate | 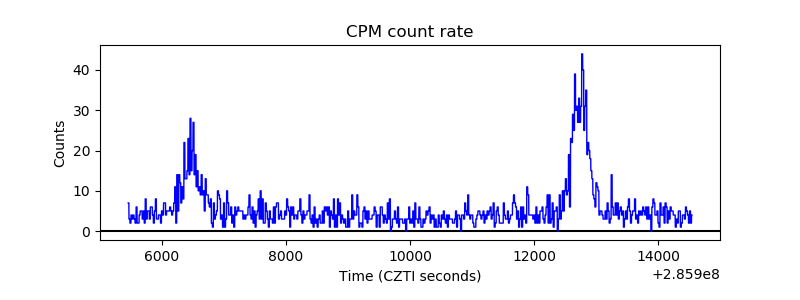 |
| CZT Counter | 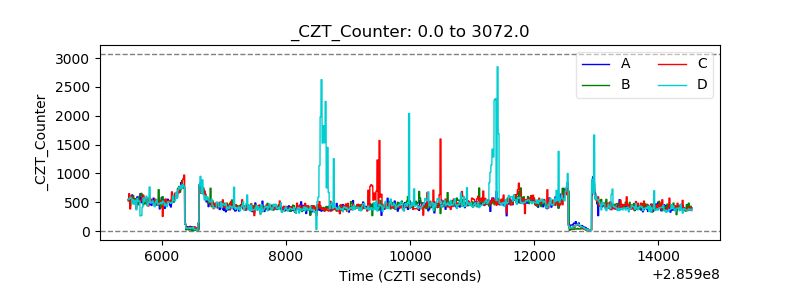 |
| +2.5 Volts monitor | 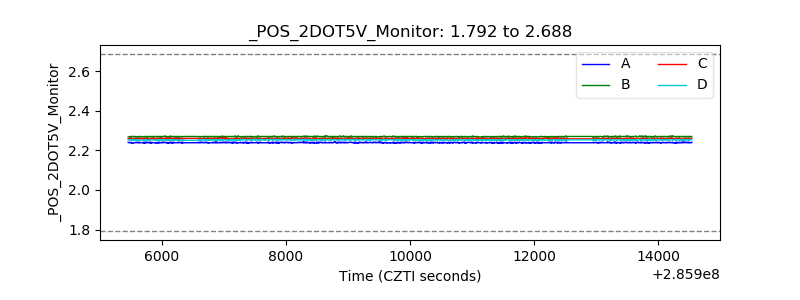 |
| +5 Volts monitor | 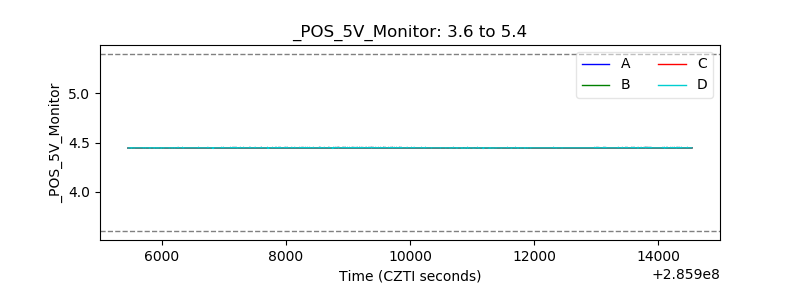 |
| _ROLL_ROT | 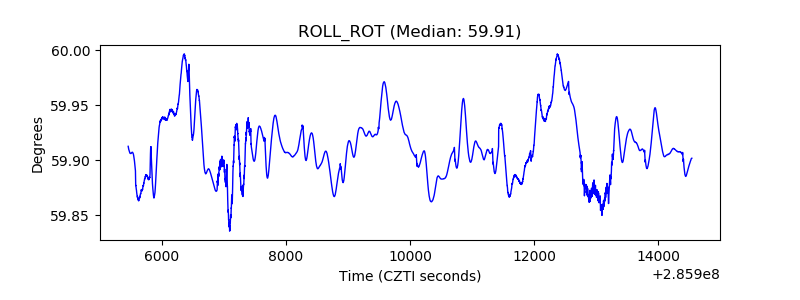 |
| _Roll_DEC | 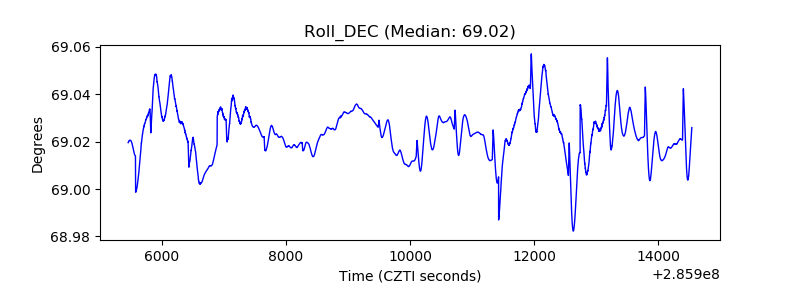 |
| _Roll_RA | 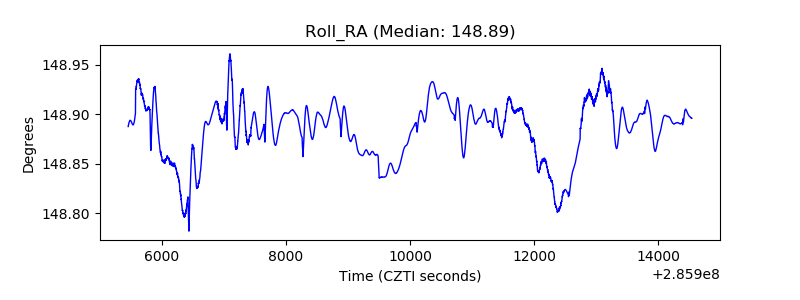 |
| Veto Counter | 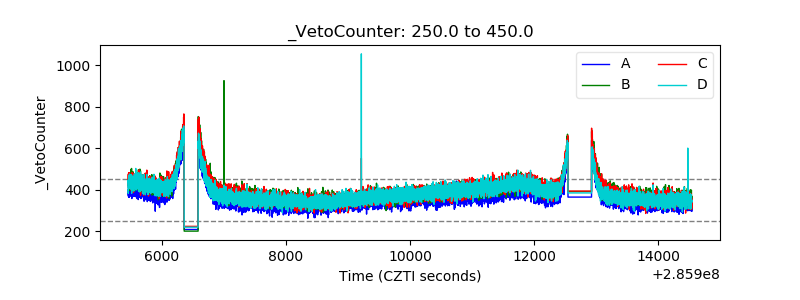 |