| Param | Original file | Final file |
|---|---|---|
| Filename | modeM0/AS1A05_019T01_9000002672_17957cztM0_level2.evt | modeM0/AS1A05_019T01_9000002672_17957cztM0_level2_quad_clean.evt |
| Size (bytes) | 147,948,480 | 14,780,160 |
| Size | 141.1 MB | 14.1 MB |
| Events in quadrant A | 846,966 | 84,124 |
| Events in quadrant B | 849,773 | 86,209 |
| Events in quadrant C | 970,696 | 83,032 |
| Events in quadrant D | 1,701,016 | 74,404 |
| Mode M0 | |||
|---|---|---|---|
| Quadrant | BADHDUFLAG | Total packets | Discarded packets |
| A | 0 | 3413 | 1 |
| B | 0 | 3411 | 1 |
| C | 0 | 3938 | 1 |
| D | 0 | 6140 | 1 |
| Mode M9 | |||
|---|---|---|---|
| Quadrant | BADHDUFLAG | Total packets | Discarded packets |
| A | 0 | 8 | 0 |
| B | 0 | 8 | 0 |
| C | 0 | 8 | 0 |
| D | 0 | 8 | 0 |
| Mode SS | |||
|---|---|---|---|
| Quadrant | BADHDUFLAG | Total packets | Discarded packets |
| A | 0 | 34 | 0 |
| B | 0 | 34 | 0 |
| C | 0 | 34 | 0 |
| D | 0 | 34 | 0 |
| Quadrant | Total seconds | Saturated seconds | Saturation percentage |
|---|---|---|---|
| A | 1611 | 55 | 3.414029% |
| B | 1611 | 57 | 3.538175% |
| C | 1611 | 73 | 4.531347% |
| D | 1611 | 223 | 13.842334% |
Noise dominated data is calculated using 1-second bins in cleaned event files. If a bin has >2000 counts, and if more than 50% of those come from <1% of pixels, then it is considered to be noise-dominated and hence unusable.
| Quadrant | # 1 sec bins | Bins with >0 counts | Bins with >2000 counts | High rate bins dominated by noise | Noise dominated (total time) | Noise dominated (detector-on time) | Marked lightcurve |
|---|---|---|---|---|---|---|---|
| A | 2476 | 1611 | 0 | 0 | 0.00% | 0.00% | 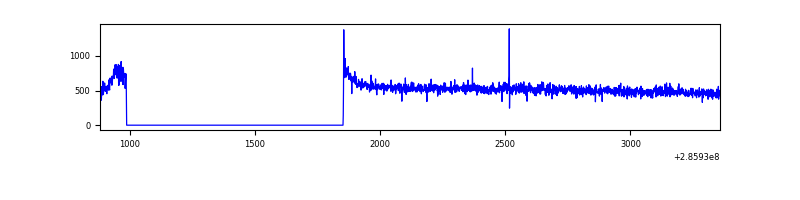 |
| B | 2476 | 1612 | 0 | 0 | 0.00% | 0.00% | 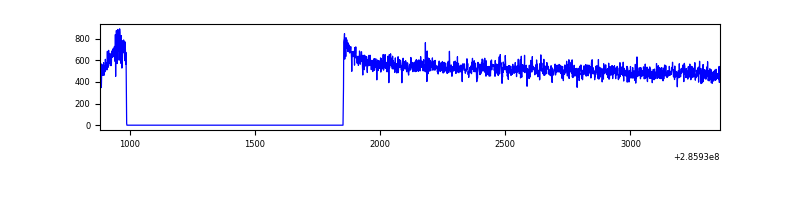 |
| C | 2476 | 1612 | 0 | 0 | 0.00% | 0.00% | 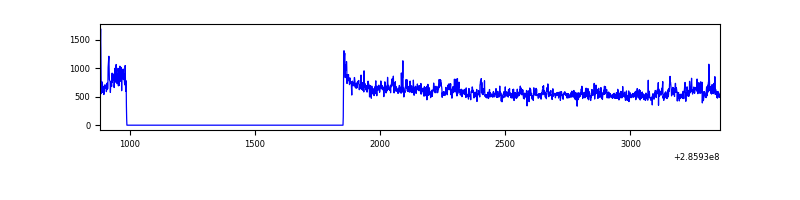 |
| D | 2476 | 1612 | 134 | 134 | 5.41% | 8.31% | 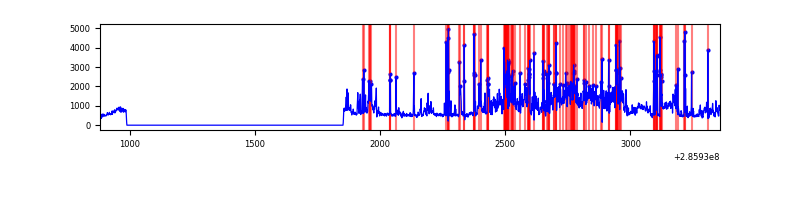 |
Top three noisy pixels from each quadrant. If the there are fewer than three noisy pixels in the level2.evt file, extra rows are filled as -1
| Pixel properties | Quadrant properties | ||||||
|---|---|---|---|---|---|---|---|
| Quadrant | DetID | PixID | Counts | Sigma | Mean | Median | Sigma |
| A | 0 | 226 | 1909 | 36.51 | 219 | 214 | 46.4 |
| A | 3 | 137 | 1744 | 32.95 | 219 | 214 | 46.4 |
| A | 12 | 194 | 1603 | 29.92 | 219 | 214 | 46.4 |
| B | 12 | 111 | 5344 | 116.3 | 216 | 211 | 44.1 |
| B | 11 | 111 | 4818 | 104.38 | 216 | 211 | 44.1 |
| B | 14 | 111 | 4203 | 90.45 | 216 | 211 | 44.1 |
| C | 3 | 233 | 136977 | 2726.23 | 205 | 206 | 50.2 |
| C | 14 | 238 | 31501 | 623.8 | 205 | 206 | 50.2 |
| C | 13 | 61 | 1497 | 25.73 | 205 | 206 | 50.2 |
| D | 5 | 222 | 554664 | 10838.96 | 201 | 194 | 51.2 |
| D | 12 | 110 | 227131 | 4436.24 | 201 | 194 | 51.2 |
| D | 13 | 170 | 127174 | 2482.25 | 201 | 194 | 51.2 |
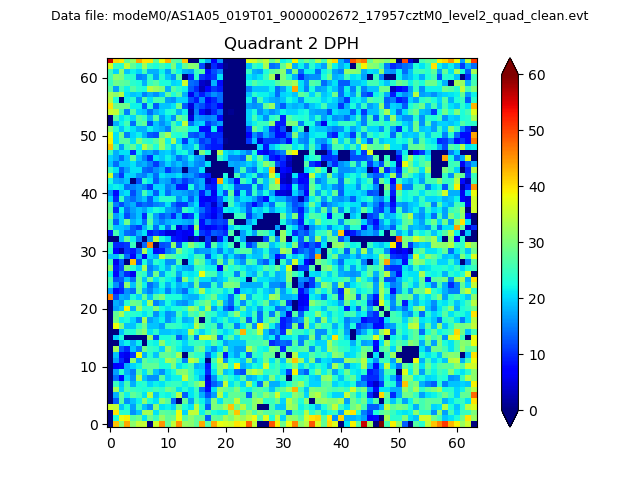
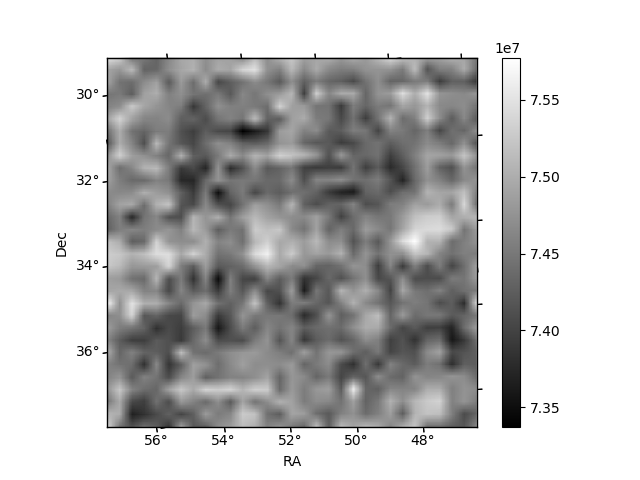
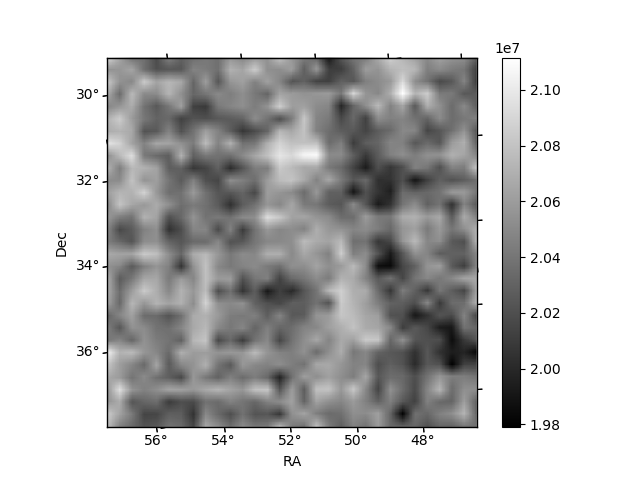
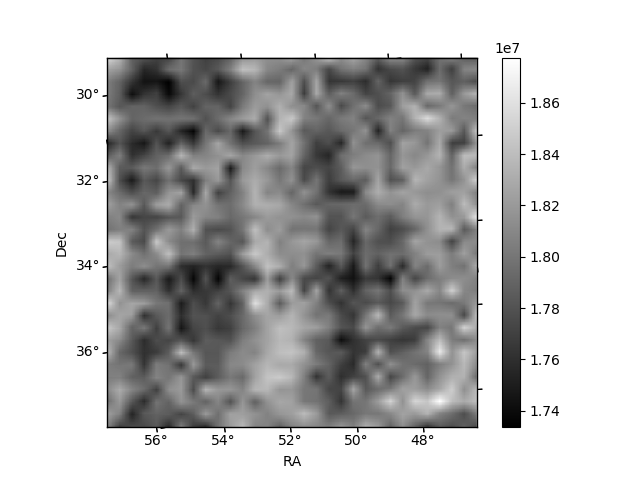
Histogram calculated using DETX and DETY for each event in the final _common_clean file
| Quadrant A | 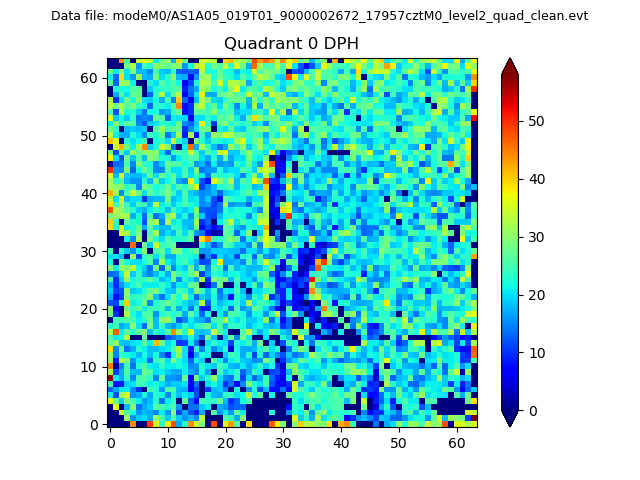 |
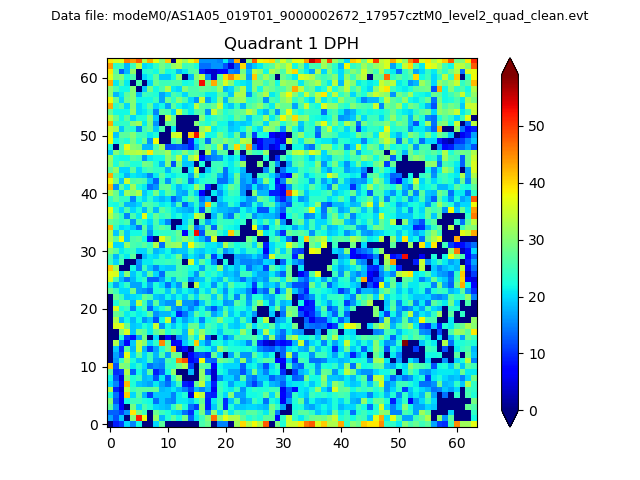 |
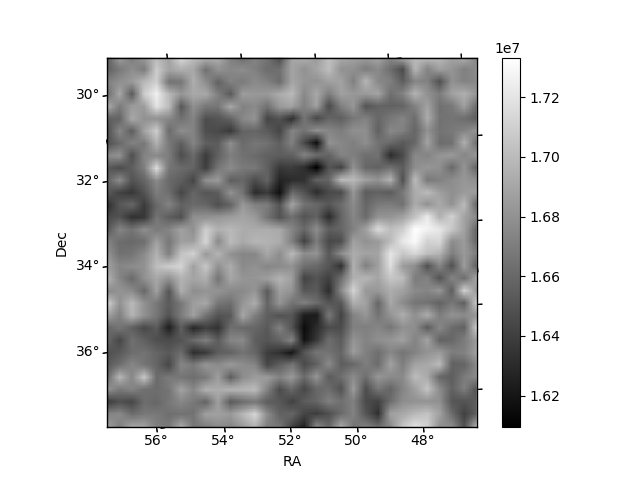
Quadrant B |
|---|---|---|---|
| Quadrant D | 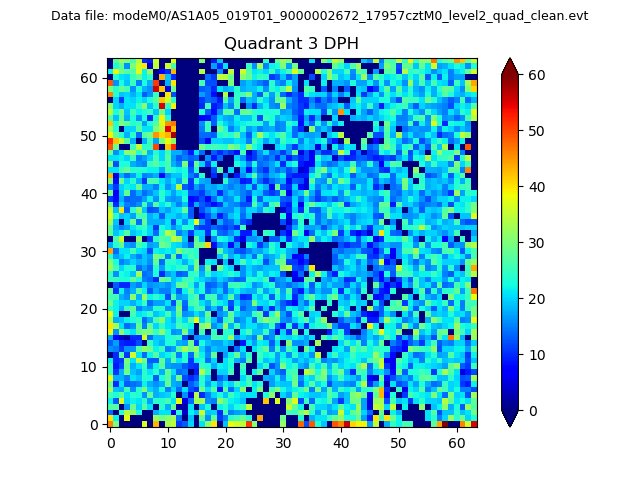 |
 |
Quadrant C |
| Plot type | Count rate plots | Images |
|---|---|---|
| Comparison with Poisson distribution Blue bars denote a histogram of data divided into 1 sec bins. Red curve is a Poisson curve with rate = median count rate of data. |
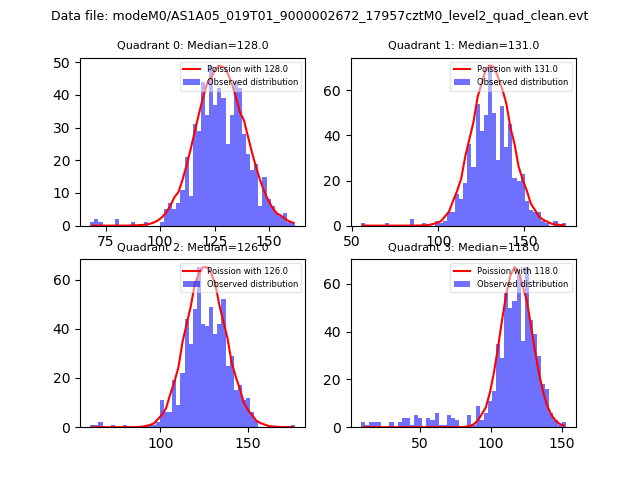 |
 |
| Quadrant-wise count rates Data is divided into 100 sec bins |
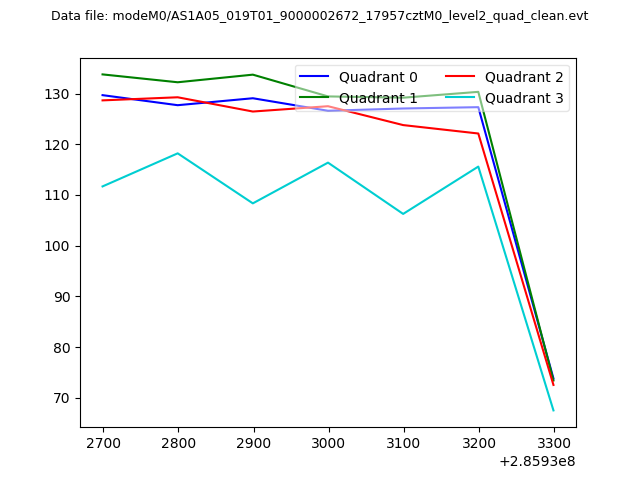 |
|
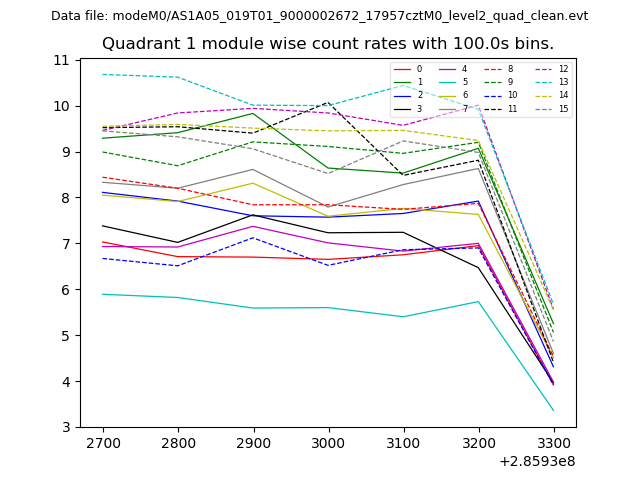
| Module-wise count rates for Quadrant A Data is divided into 100 sec bins |
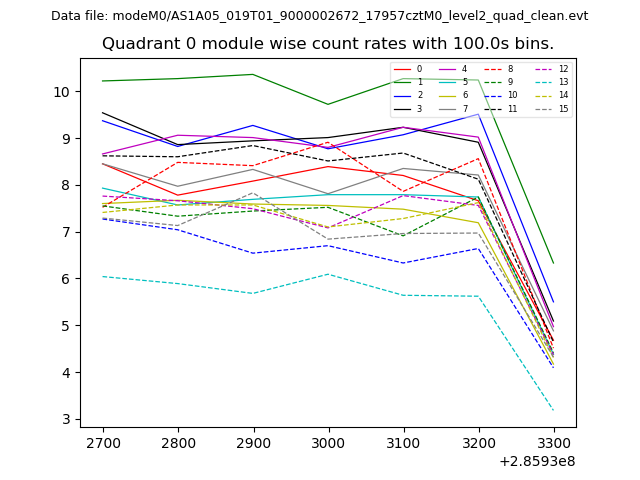 |
 |
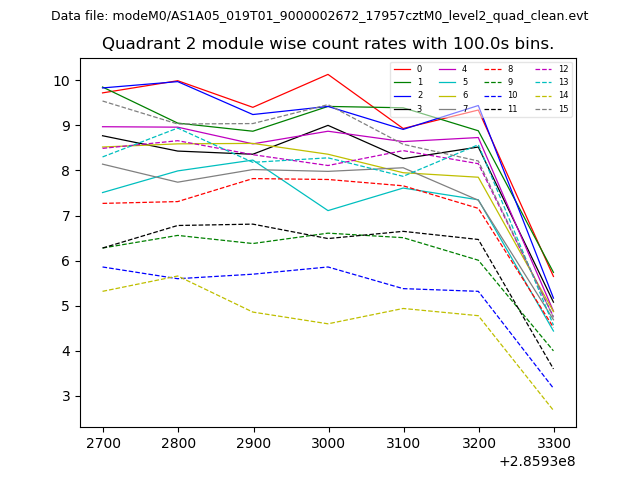
| Module-wise count rates for Quadrant B Data is divided into 100 sec bins |
 |
 |
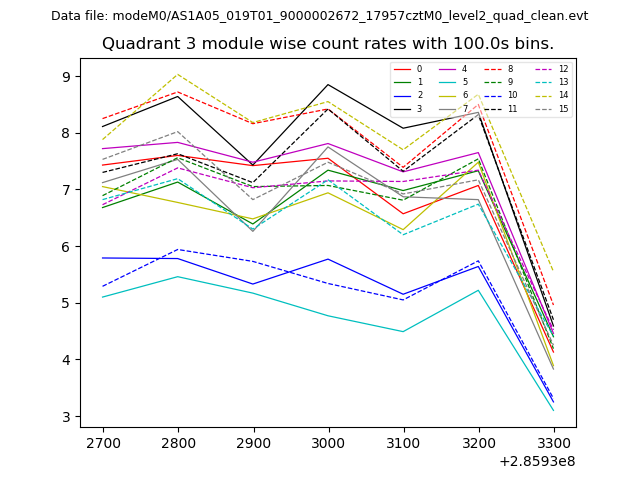
| Module-wise count rates for Quadrant C Data is divided into 100 sec bins |
 |
 |
| Module-wise count rates for Quadrant D Data is divided into 100 sec bins |
 |
 |
| Parameter | Plot |
|---|---|
| CZT HV Monitor | 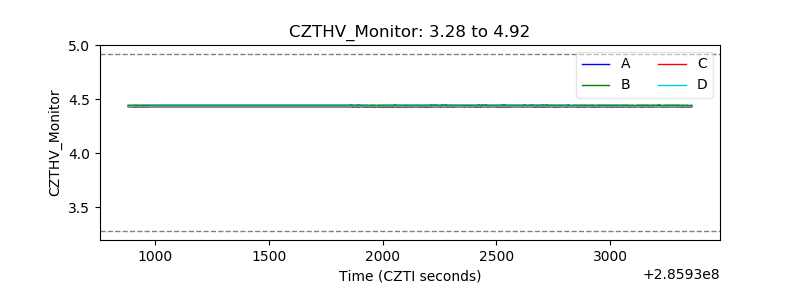 |
| D_VDD | 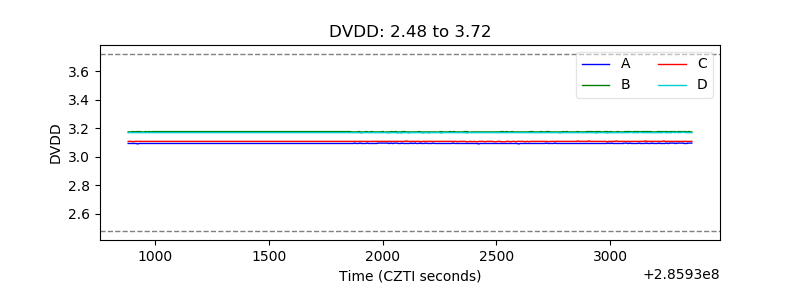 |
| Temperature 1 | 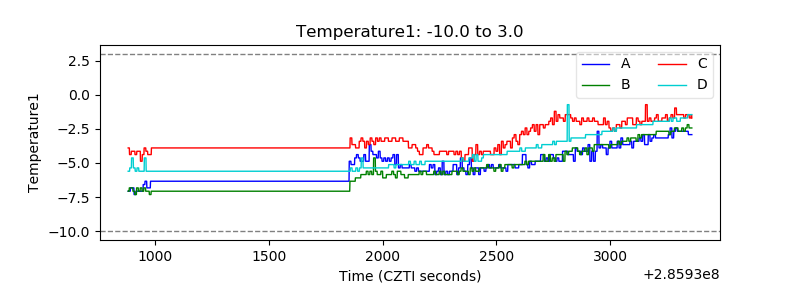 |
| Veto HV Monitor |  |
| Veto LLD | 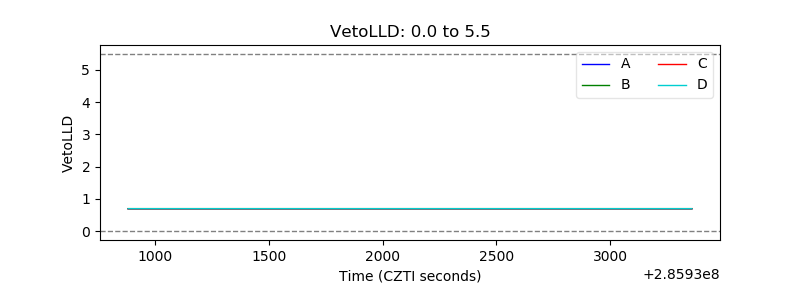 |
| Alpha Counter | 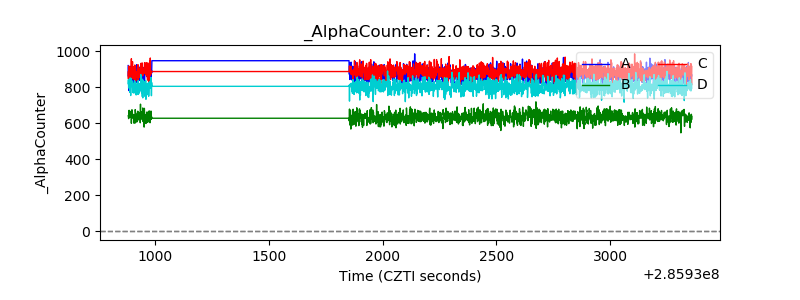 |
| _CPM_Rate | 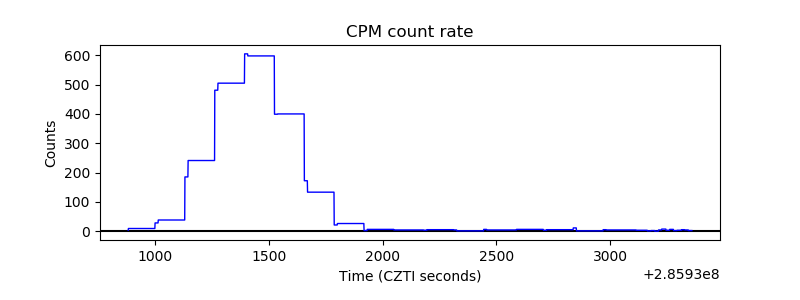 |
| CZT Counter | 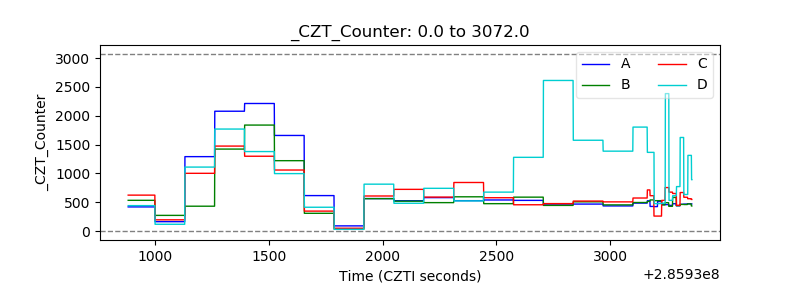 |
| +2.5 Volts monitor | 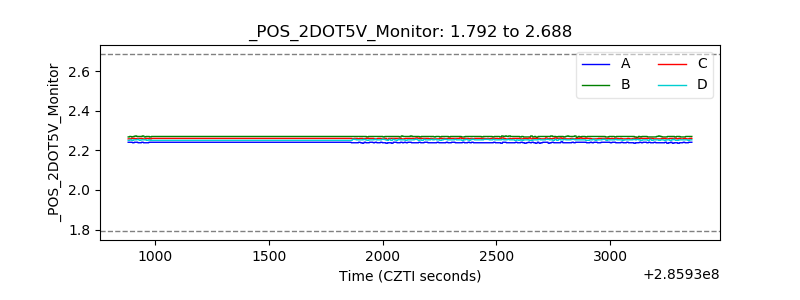 |
| +5 Volts monitor |  |
| _ROLL_ROT | 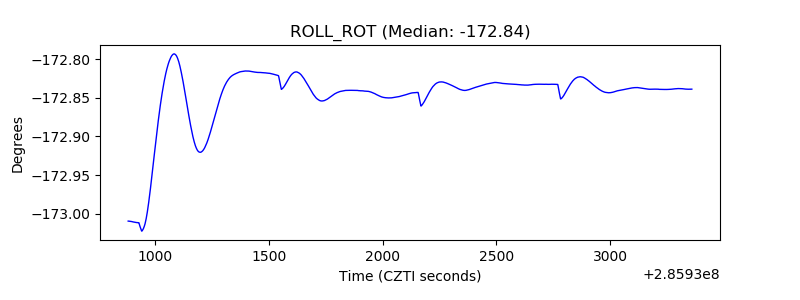 |
| _Roll_DEC | 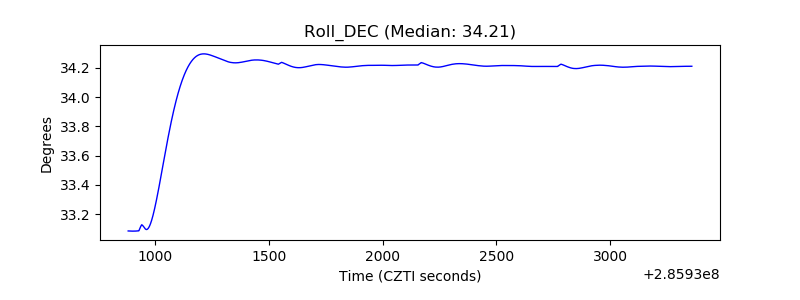 |
| _Roll_RA | 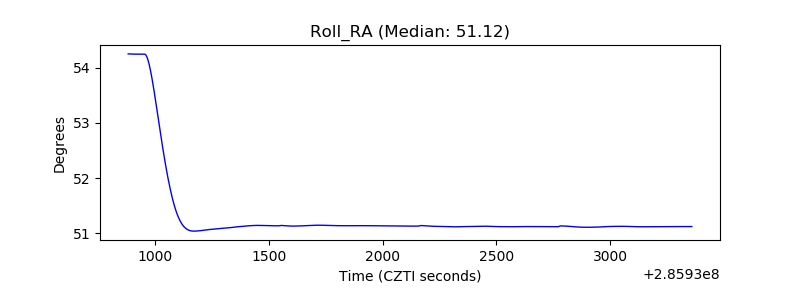 |
| Veto Counter | 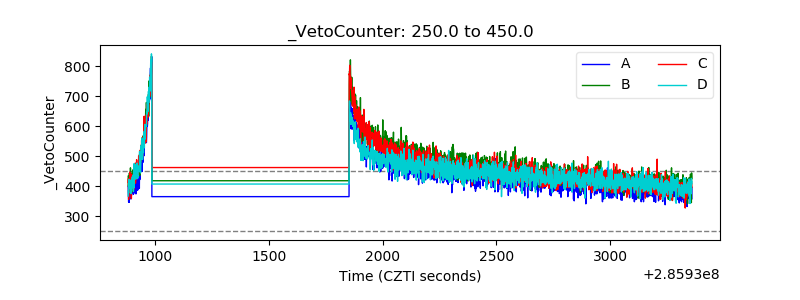 |