| Param | Original file | Final file |
|---|---|---|
| Filename | modeM0/AS1A05_019T01_9000002672_17958cztM0_level2.evt | modeM0/AS1A05_019T01_9000002672_17958cztM0_level2_quad_clean.evt |
| Size (bytes) | 510,203,520 | 91,742,400 |
| Size | 486.6 MB | 87.5 MB |
| Events in quadrant A | 3,223,762 | 594,715 |
| Events in quadrant B | 3,346,021 | 598,559 |
| Events in quadrant C | 3,663,010 | 570,656 |
| Events in quadrant D | 4,769,244 | 552,312 |
| Mode M0 | |||
|---|---|---|---|
| Quadrant | BADHDUFLAG | Total packets | Discarded packets |
| A | 0 | 13847 | 2 |
| B | 0 | 14044 | 2 |
| C | 0 | 14926 | 2 |
| D | 0 | 18458 | 2 |
| Mode M9 | |||
|---|---|---|---|
| Quadrant | BADHDUFLAG | Total packets | Discarded packets |
| A | 0 | 17 | 0 |
| B | 0 | 18 | 0 |
| C | 0 | 18 | 0 |
| D | 0 | 18 | 0 |
| Mode SS | |||
|---|---|---|---|
| Quadrant | BADHDUFLAG | Total packets | Discarded packets |
| A | 0 | 136 | 0 |
| B | 0 | 136 | 0 |
| C | 0 | 136 | 0 |
| D | 0 | 136 | 0 |
| Quadrant | Total seconds | Saturated seconds | Saturation percentage |
|---|---|---|---|
| A | 6621 | 65 | 0.981725% |
| B | 6621 | 77 | 1.162966% |
| C | 6621 | 113 | 1.706691% |
| D | 6621 | 348 | 5.256004% |
Noise dominated data is calculated using 1-second bins in cleaned event files. If a bin has >2000 counts, and if more than 50% of those come from <1% of pixels, then it is considered to be noise-dominated and hence unusable.
| Quadrant | # 1 sec bins | Bins with >0 counts | Bins with >2000 counts | High rate bins dominated by noise | Noise dominated (total time) | Noise dominated (detector-on time) | Marked lightcurve |
|---|---|---|---|---|---|---|---|
| A | 7646 | 6622 | 4 | 4 | 0.05% | 0.06% | 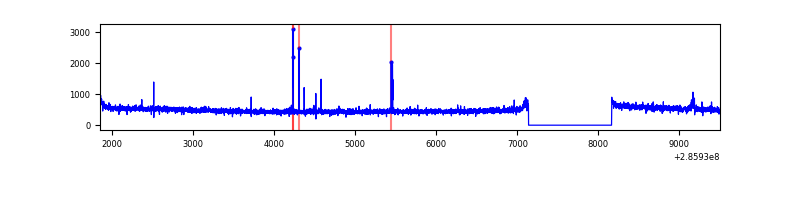 |
| B | 7646 | 6622 | 6 | 6 | 0.08% | 0.09% | 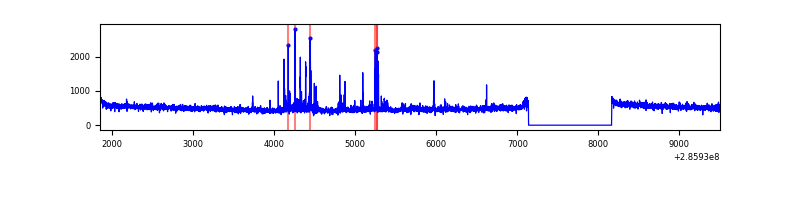 |
| C | 7646 | 6622 | 8 | 8 | 0.10% | 0.12% | 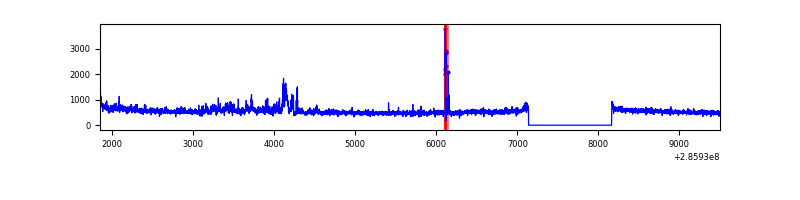 |
| D | 7646 | 6621 | 246 | 246 | 3.22% | 3.72% | 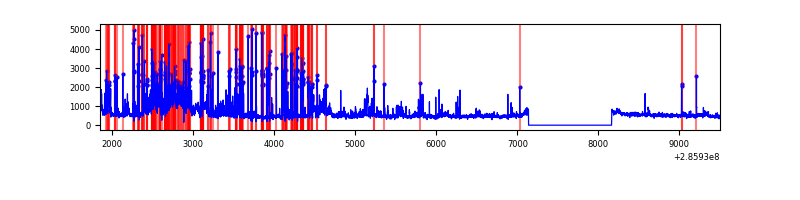 |
Top three noisy pixels from each quadrant. If the there are fewer than three noisy pixels in the level2.evt file, extra rows are filled as -1
| Pixel properties | Quadrant properties | ||||||
|---|---|---|---|---|---|---|---|
| Quadrant | DetID | PixID | Counts | Sigma | Mean | Median | Sigma |
| A | 4 | 2 | 18483 | 104.9 | 828 | 809 | 168.5 |
| A | 15 | 174 | 17289 | 97.81 | 828 | 809 | 168.5 |
| A | 0 | 226 | 7319 | 38.64 | 828 | 809 | 168.5 |
| B | 7 | 220 | 69048 | 435.94 | 820 | 802 | 156.5 |
| B | 0 | 197 | 33629 | 209.69 | 820 | 802 | 156.5 |
| B | 12 | 111 | 18759 | 114.71 | 820 | 802 | 156.5 |
| C | 3 | 233 | 455817 | 2458.06 | 783 | 788 | 185.1 |
| C | 14 | 238 | 119494 | 641.25 | 783 | 788 | 185.1 |
| C | 9 | 160 | 20586 | 106.95 | 783 | 788 | 185.1 |
| D | 5 | 222 | 977858 | 5102.88 | 787 | 763 | 191.5 |
| D | 12 | 110 | 533791 | 2783.74 | 787 | 763 | 191.5 |
| D | 13 | 170 | 127722 | 663.04 | 787 | 763 | 191.5 |
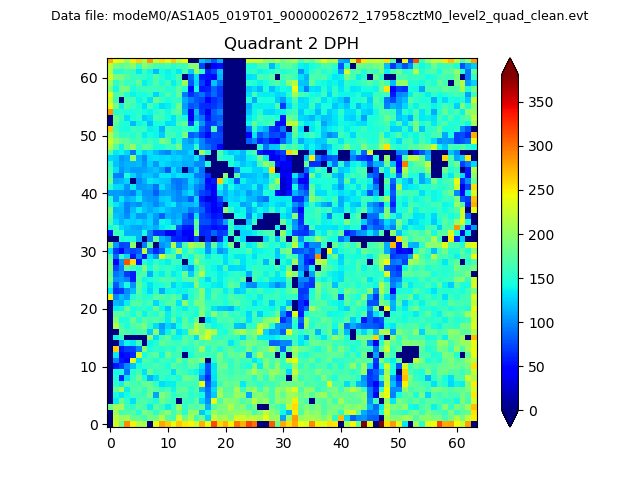
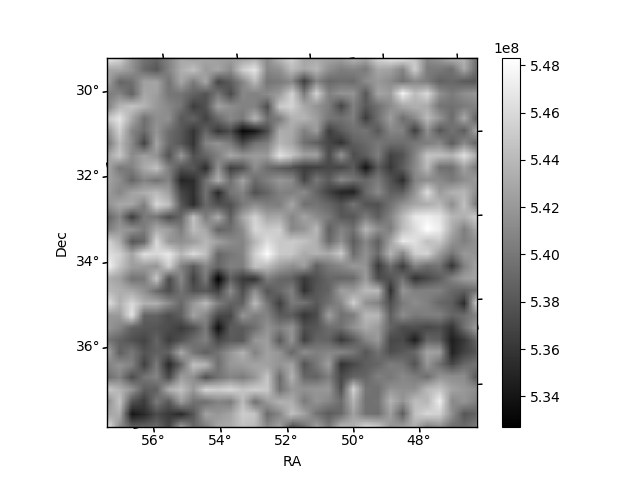
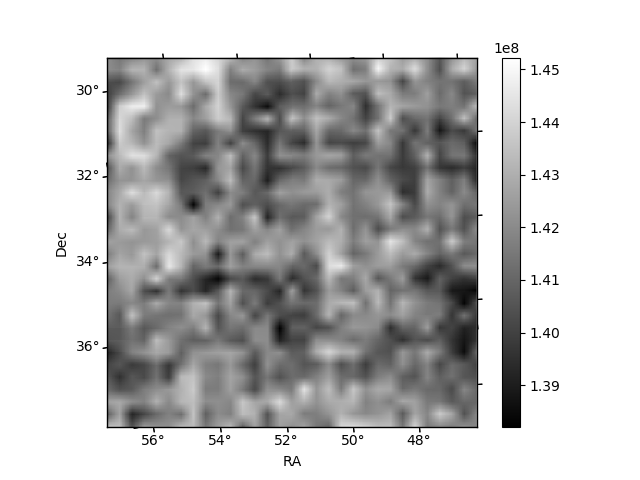
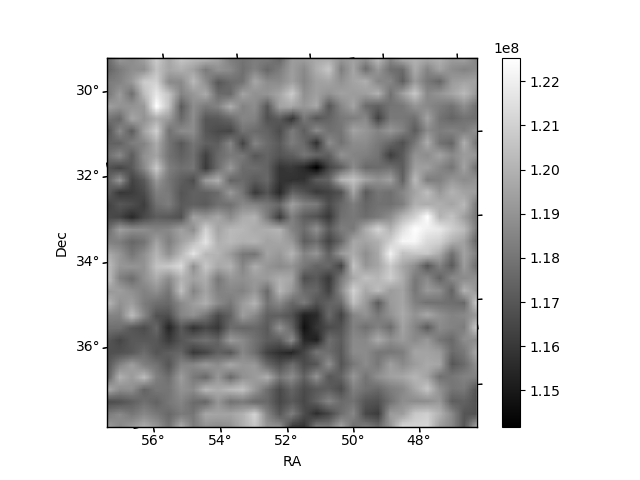
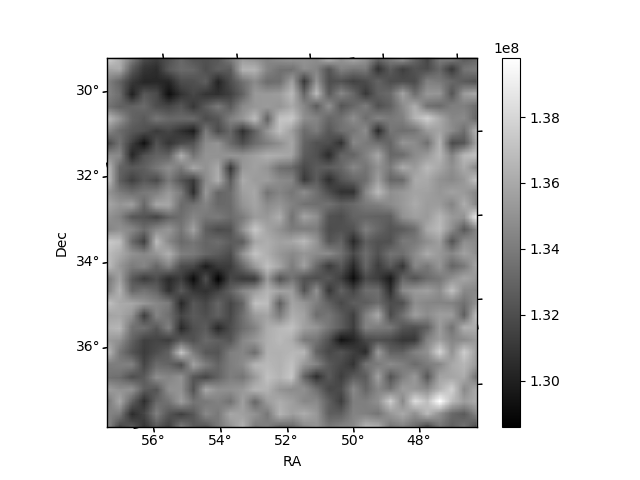
Histogram calculated using DETX and DETY for each event in the final _common_clean file
| Quadrant A | 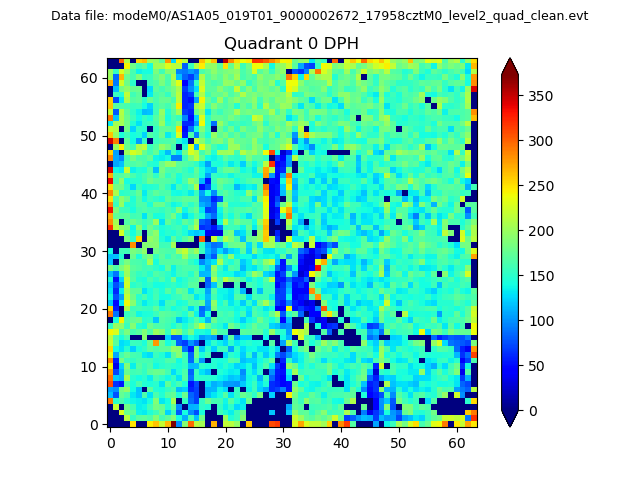 |
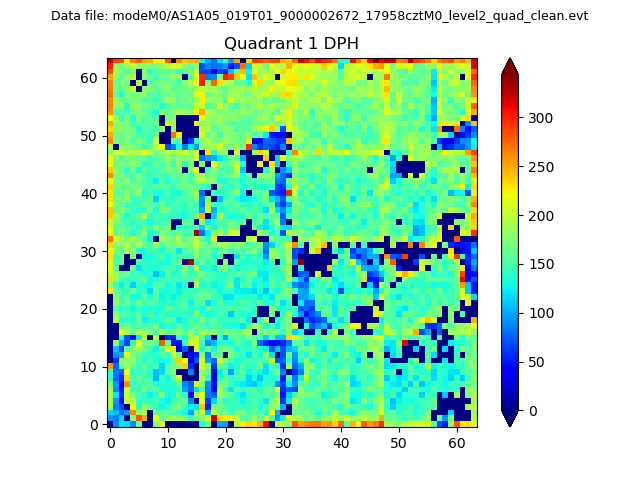 |
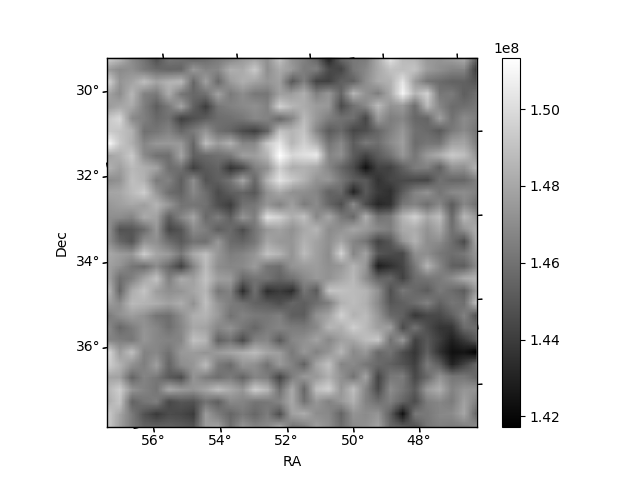
Quadrant B |
|---|---|---|---|
| Quadrant D | 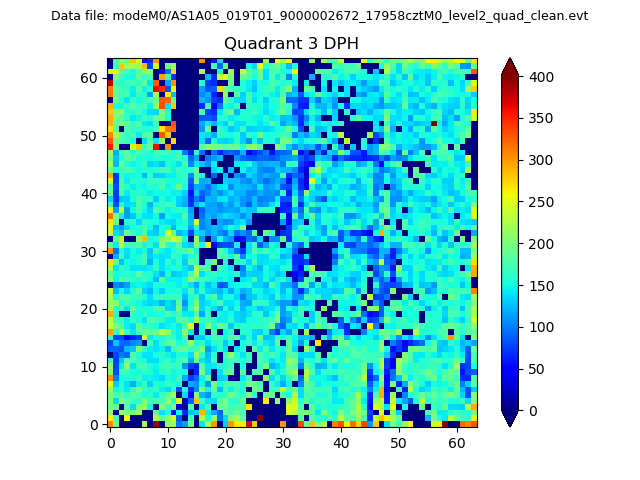 |
 |
Quadrant C |
| Plot type | Count rate plots | Images |
|---|---|---|
| Comparison with Poisson distribution Blue bars denote a histogram of data divided into 1 sec bins. Red curve is a Poisson curve with rate = median count rate of data. |
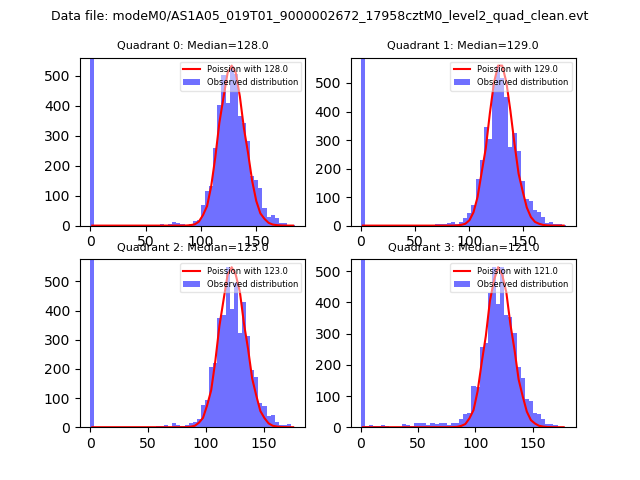 |
 |
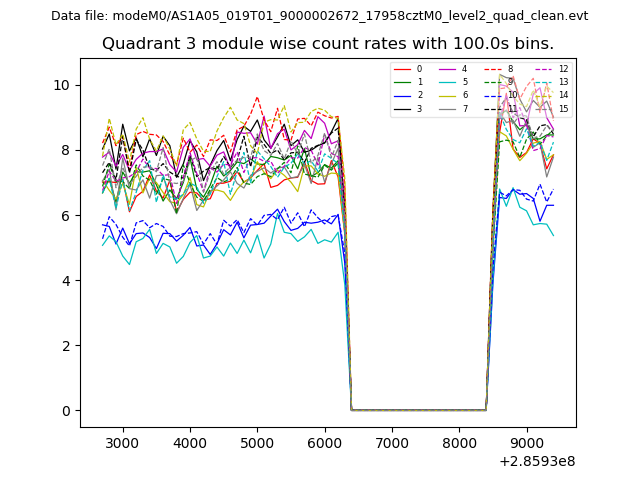
| Quadrant-wise count rates Data is divided into 100 sec bins |
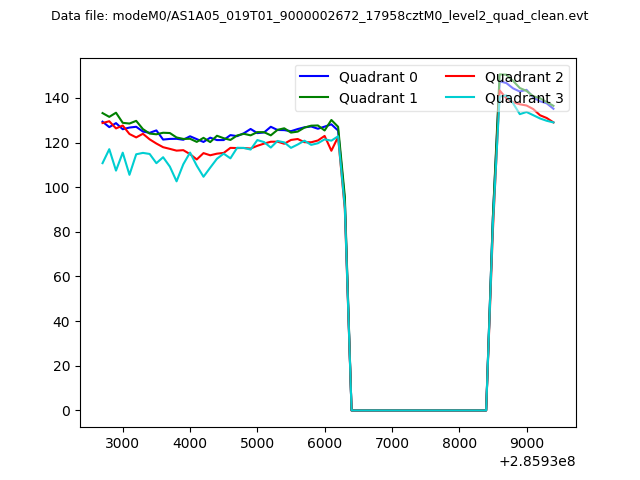 |
|
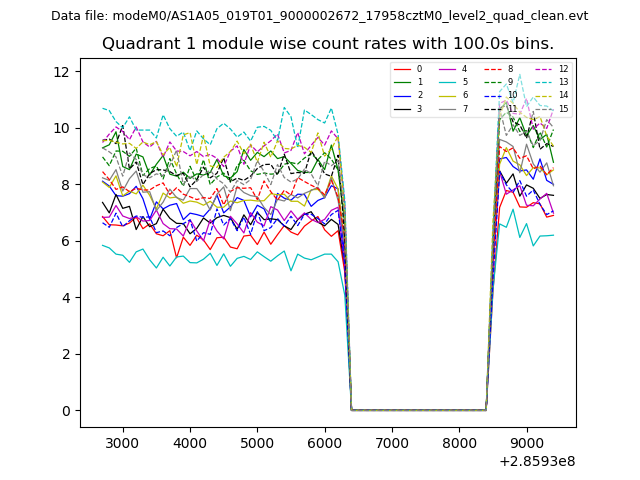
| Module-wise count rates for Quadrant A Data is divided into 100 sec bins |
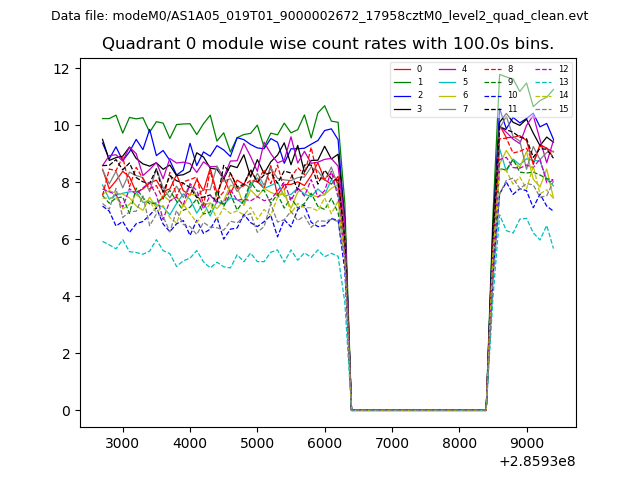 |
 |
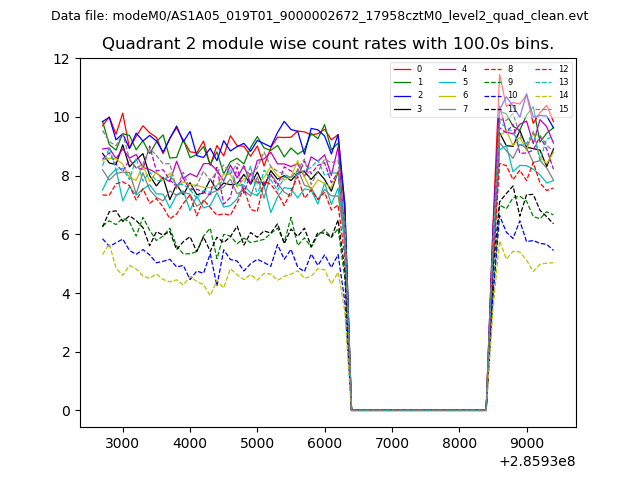
| Module-wise count rates for Quadrant B Data is divided into 100 sec bins |
 |
 |
| Module-wise count rates for Quadrant C Data is divided into 100 sec bins |
 |
 |
| Module-wise count rates for Quadrant D Data is divided into 100 sec bins |
 |
 |
| Parameter | Plot |
|---|---|
| CZT HV Monitor | 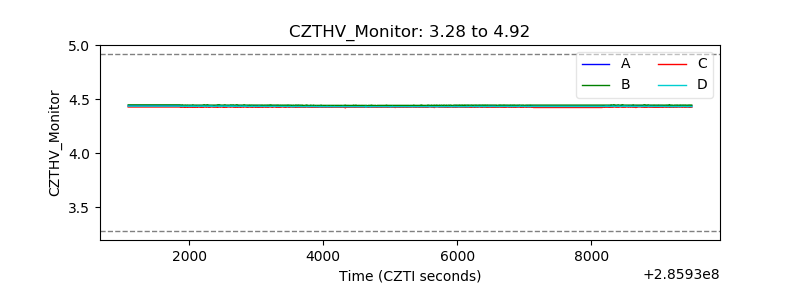 |
| D_VDD | 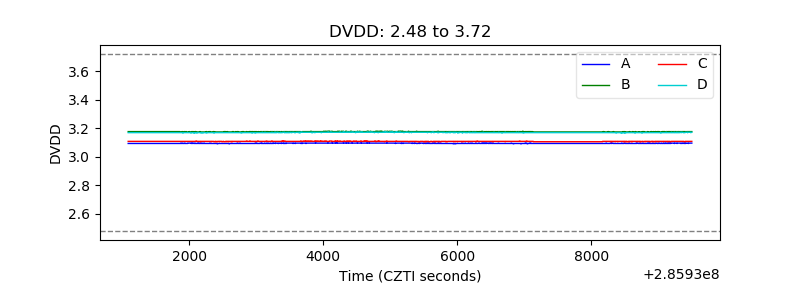 |
| Temperature 1 |  |
| Veto HV Monitor | 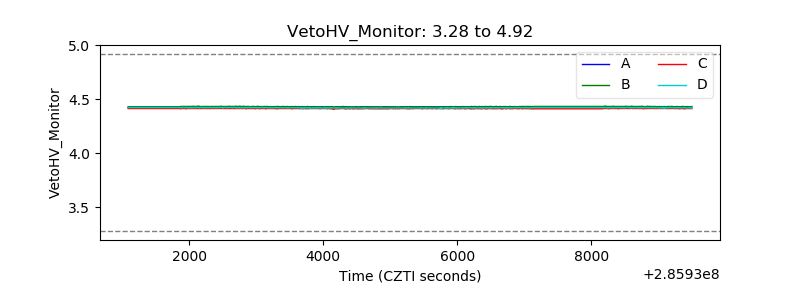 |
| Veto LLD | 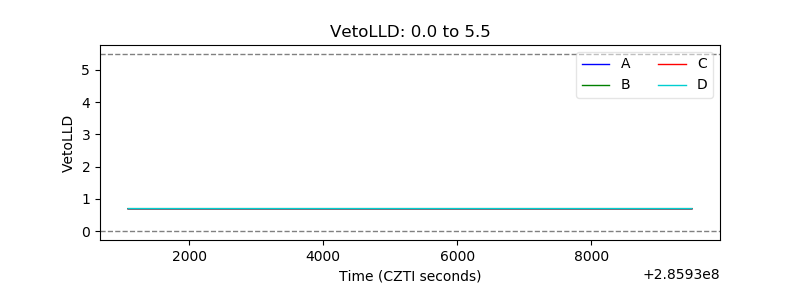 |
| Alpha Counter | 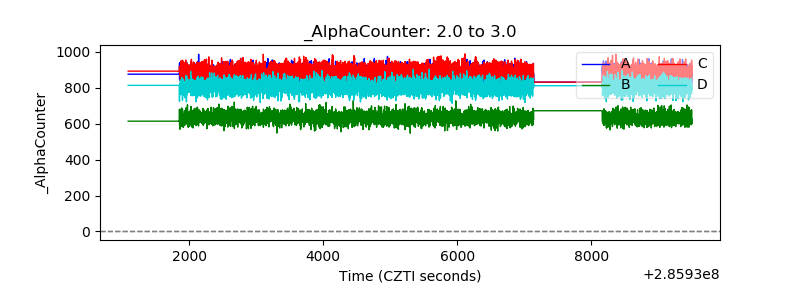 |
| _CPM_Rate | 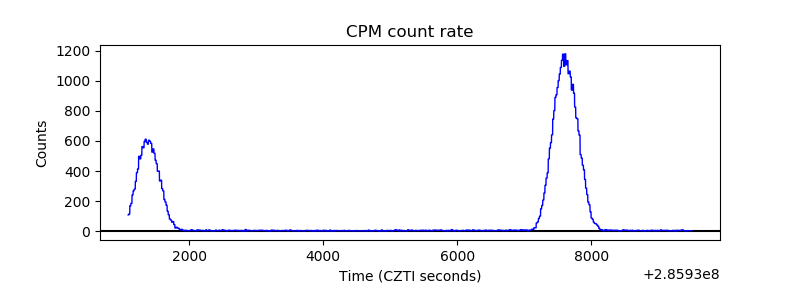 |
| CZT Counter | 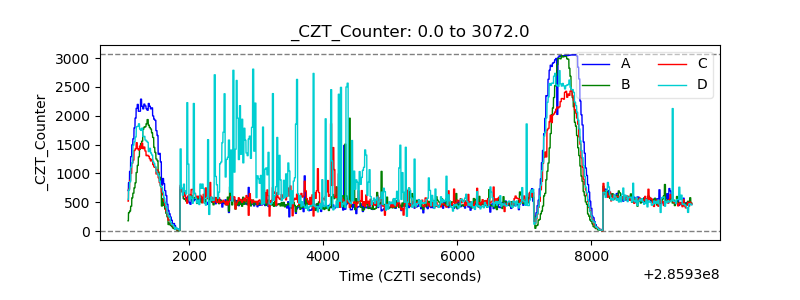 |
| +2.5 Volts monitor |  |
| +5 Volts monitor |  |
| _ROLL_ROT | 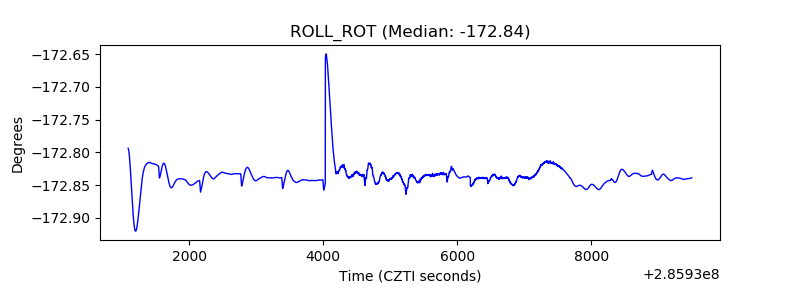 |
| _Roll_DEC |  |
| _Roll_RA | 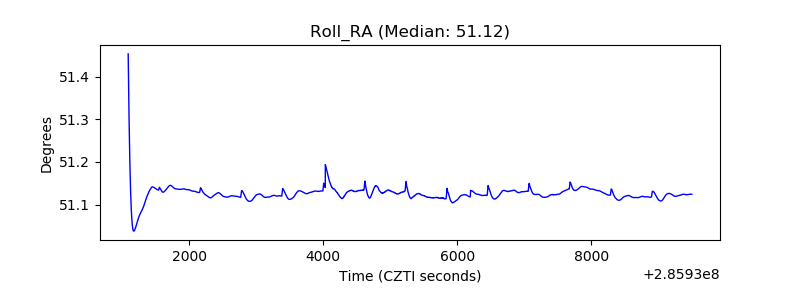 |
| Veto Counter | 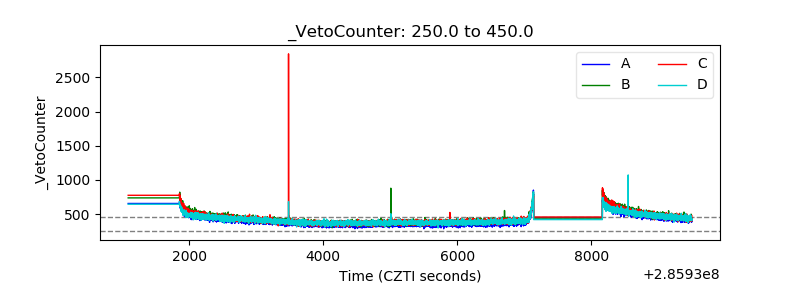 |