| Param | Original file | Final file |
|---|---|---|
| Filename | modeM0/AS1A05_019T01_9000002672_17961cztM0_level2.evt | modeM0/AS1A05_019T01_9000002672_17961cztM0_level2_quad_clean.evt |
| Size (bytes) | 435,182,400 | 102,447,360 |
| Size | 415.0 MB | 97.7 MB |
| Events in quadrant A | 3,068,728 | 692,583 |
| Events in quadrant B | 3,428,536 | 687,259 |
| Events in quadrant C | 3,040,932 | 649,392 |
| Events in quadrant D | 3,230,662 | 651,651 |
| Mode M0 | |||
|---|---|---|---|
| Quadrant | BADHDUFLAG | Total packets | Discarded packets |
| A | 0 | 13015 | 0 |
| B | 0 | 14091 | 0 |
| C | 0 | 12798 | 0 |
| D | 0 | 13504 | 0 |
| Mode M9 | |||
|---|---|---|---|
| Quadrant | BADHDUFLAG | Total packets | Discarded packets |
| A | 0 | 13 | 0 |
| B | 0 | 13 | 0 |
| C | 0 | 13 | 0 |
| D | 0 | 13 | 0 |
| Mode SS | |||
|---|---|---|---|
| Quadrant | BADHDUFLAG | Total packets | Discarded packets |
| A | 0 | 122 | 0 |
| B | 0 | 122 | 0 |
| C | 0 | 122 | 0 |
| D | 0 | 122 | 0 |
| Quadrant | Total seconds | Saturated seconds | Saturation percentage |
|---|---|---|---|
| A | 6044 | 47 | 0.777631% |
| B | 6045 | 91 | 1.505376% |
| C | 6045 | 55 | 0.909843% |
| D | 6045 | 65 | 1.075269% |
Noise dominated data is calculated using 1-second bins in cleaned event files. If a bin has >2000 counts, and if more than 50% of those come from <1% of pixels, then it is considered to be noise-dominated and hence unusable.
| Quadrant | # 1 sec bins | Bins with >0 counts | Bins with >2000 counts | High rate bins dominated by noise | Noise dominated (total time) | Noise dominated (detector-on time) | Marked lightcurve |
|---|---|---|---|---|---|---|---|
| A | 7299 | 6045 | 1 | 1 | 0.01% | 0.02% | 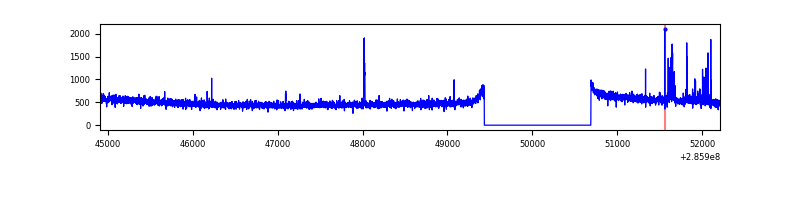 |
| B | 7300 | 6046 | 38 | 38 | 0.52% | 0.63% | 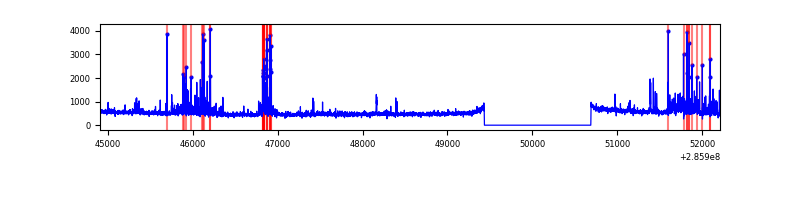 |
| C | 7300 | 6046 | 0 | 0 | 0.00% | 0.00% | 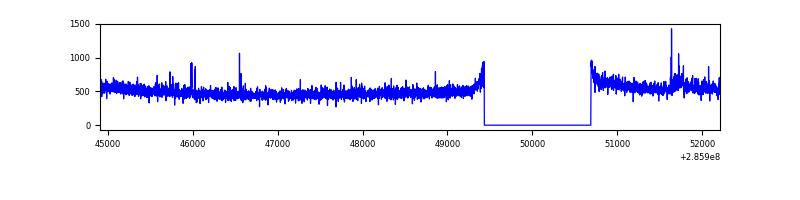 |
| D | 7300 | 6046 | 27 | 27 | 0.37% | 0.45% | 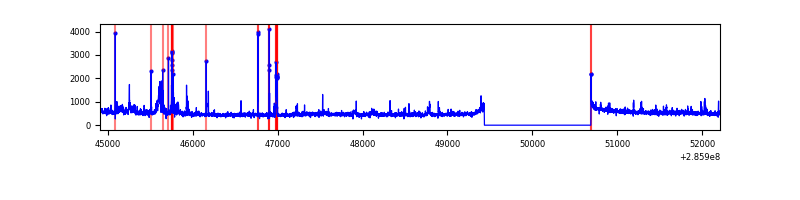 |
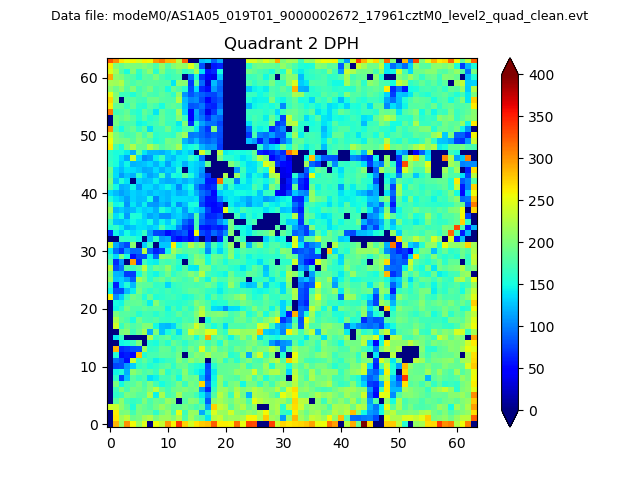
Top three noisy pixels from each quadrant. If the there are fewer than three noisy pixels in the level2.evt file, extra rows are filled as -1
| Pixel properties | Quadrant properties | ||||||
|---|---|---|---|---|---|---|---|
| Quadrant | DetID | PixID | Counts | Sigma | Mean | Median | Sigma |
| A | 14 | 237 | 57080 | 361.74 | 779 | 764 | 155.7 |
| A | 3 | 15 | 12631 | 76.23 | 779 | 764 | 155.7 |
| A | 0 | 226 | 6990 | 39.99 | 779 | 764 | 155.7 |
| B | 7 | 220 | 315671 | 2177.92 | 766 | 749 | 144.6 |
| B | 5 | 172 | 21552 | 143.87 | 766 | 749 | 144.6 |
| B | 3 | 64 | 21083 | 140.62 | 766 | 749 | 144.6 |
| C | 14 | 238 | 114389 | 667.87 | 733 | 738 | 170.2 |
| C | 3 | 233 | 48200 | 278.91 | 733 | 738 | 170.2 |
| C | 0 | 207 | 8569 | 46.02 | 733 | 738 | 170.2 |
| D | 7 | 38 | 102764 | 562.7 | 756 | 738 | 181.3 |
| D | 10 | 70 | 62497 | 340.62 | 756 | 738 | 181.3 |
| D | 5 | 222 | 46517 | 252.48 | 756 | 738 | 181.3 |
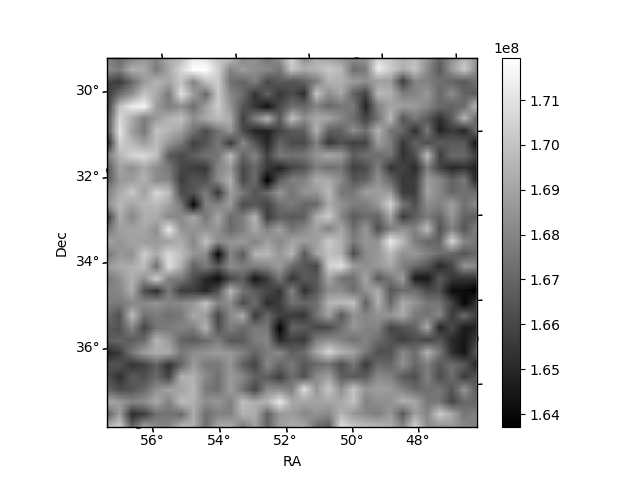
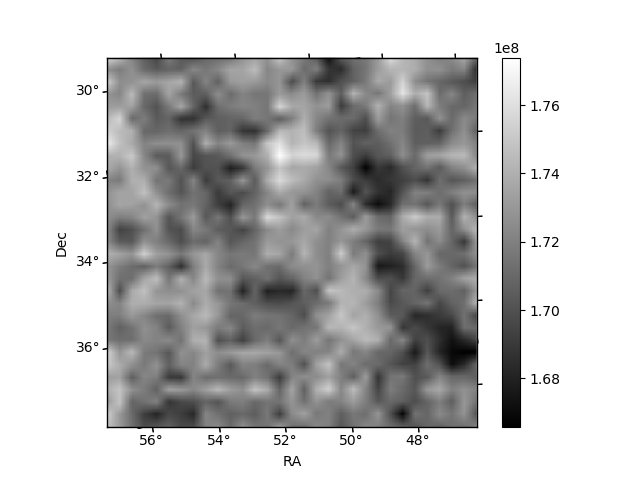
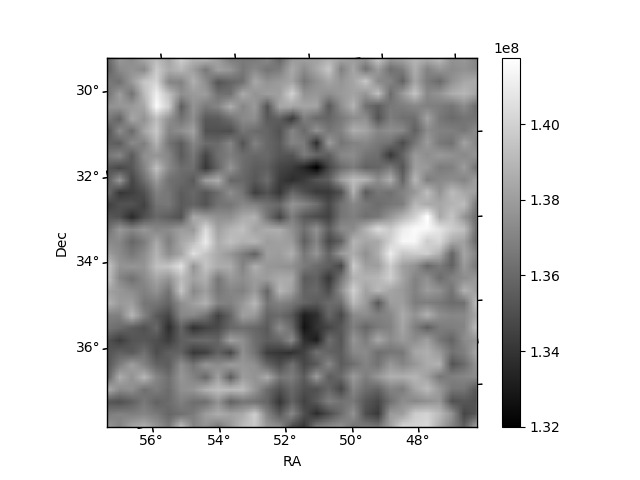
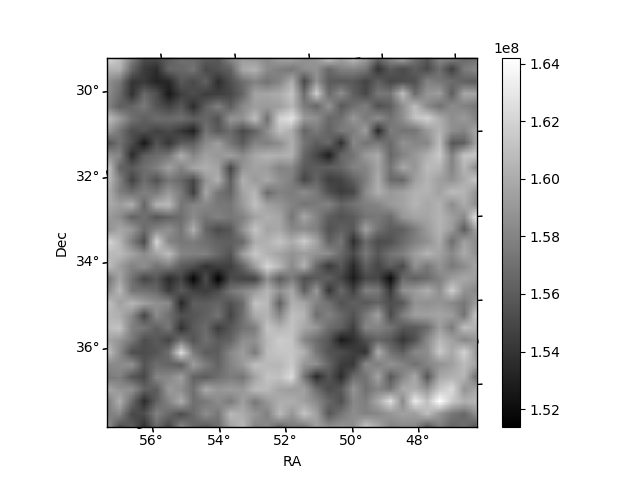
Histogram calculated using DETX and DETY for each event in the final _common_clean file
| Quadrant A | 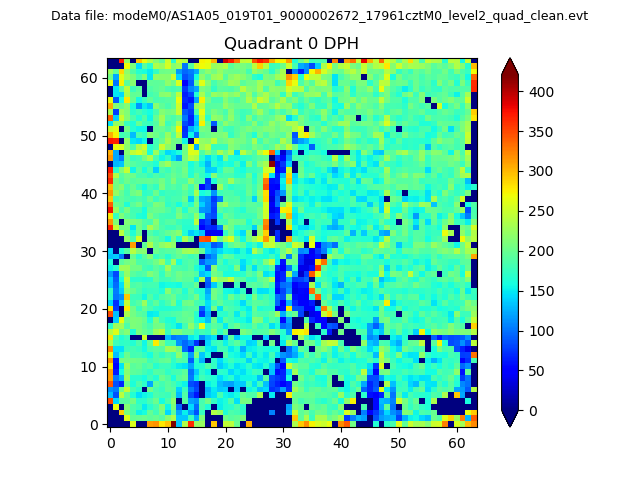 |
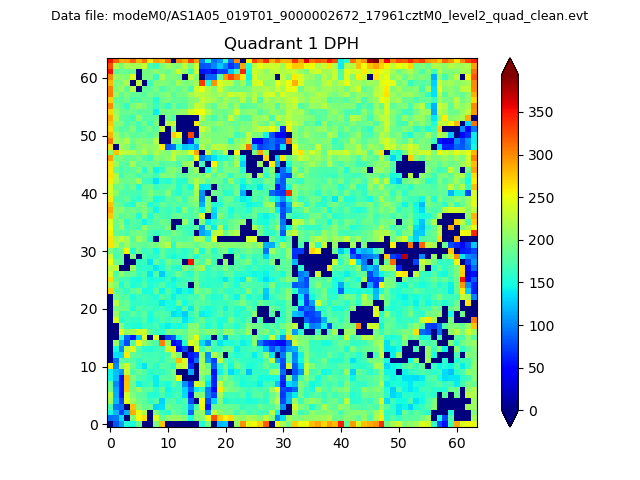 |
Quadrant B |
|---|---|---|---|
| Quadrant D | 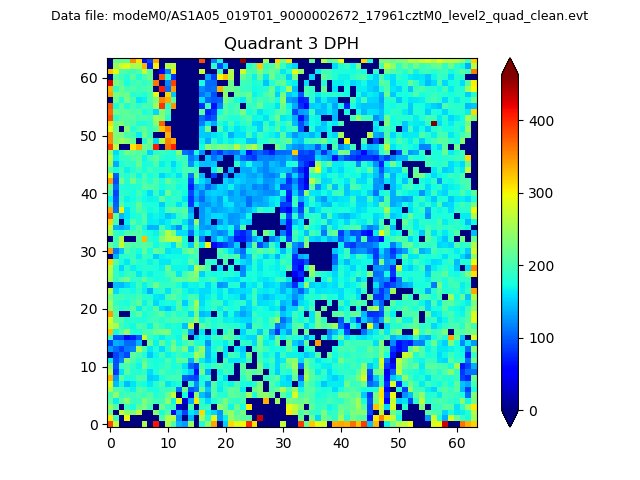 |
 |
Quadrant C |
| Plot type | Count rate plots | Images |
|---|---|---|
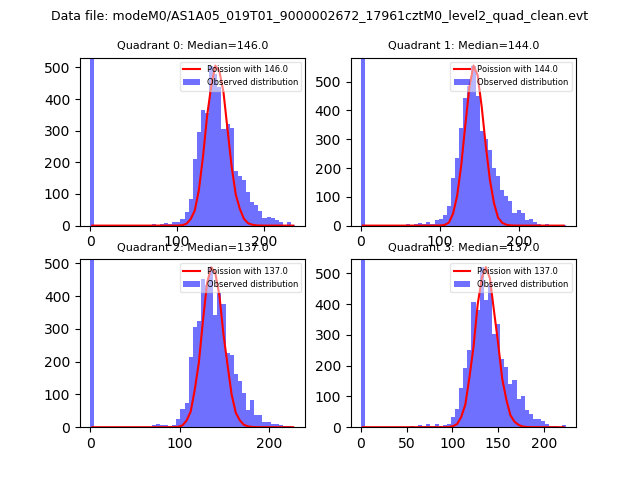
| Comparison with Poisson distribution Blue bars denote a histogram of data divided into 1 sec bins. Red curve is a Poisson curve with rate = median count rate of data. |
 |
 |
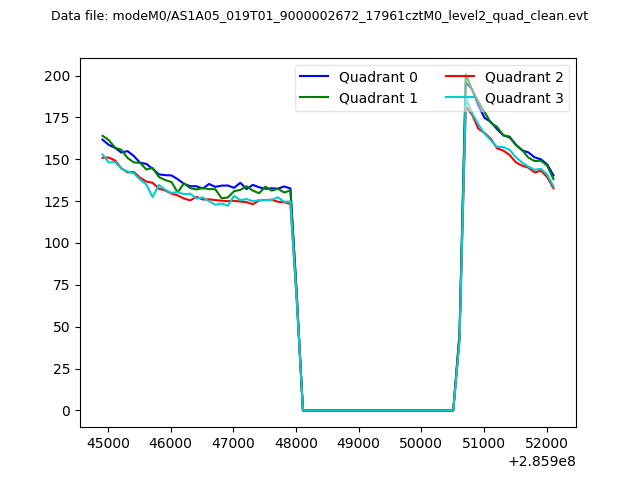
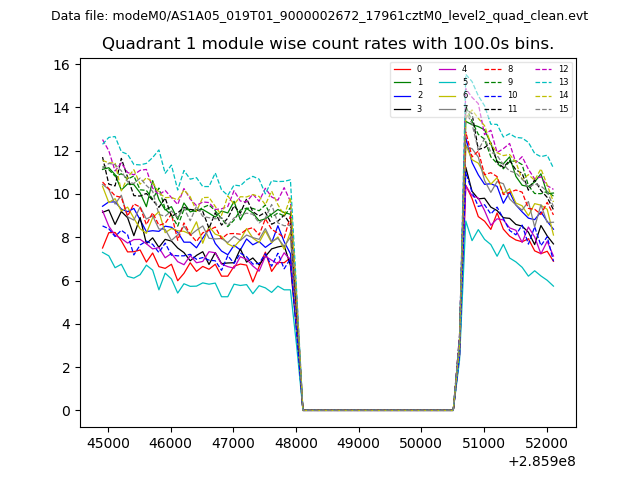
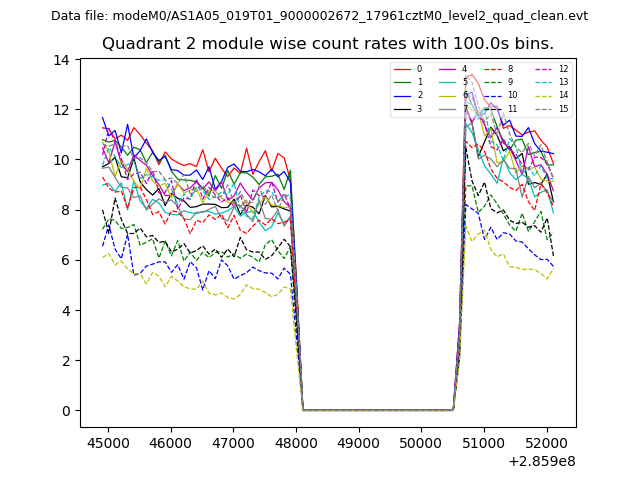
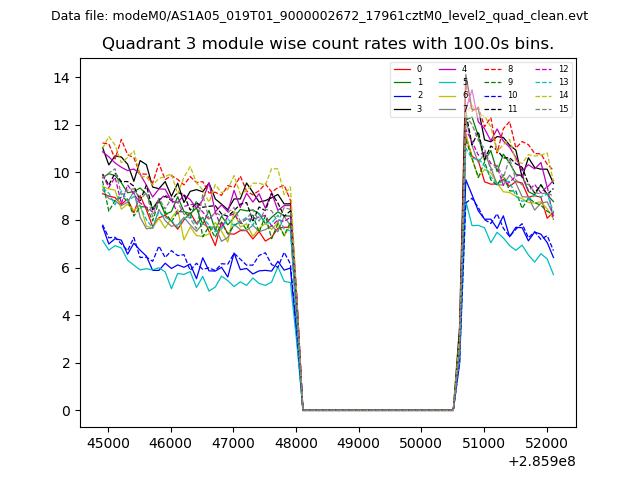
| Quadrant-wise count rates Data is divided into 100 sec bins |
 |
|
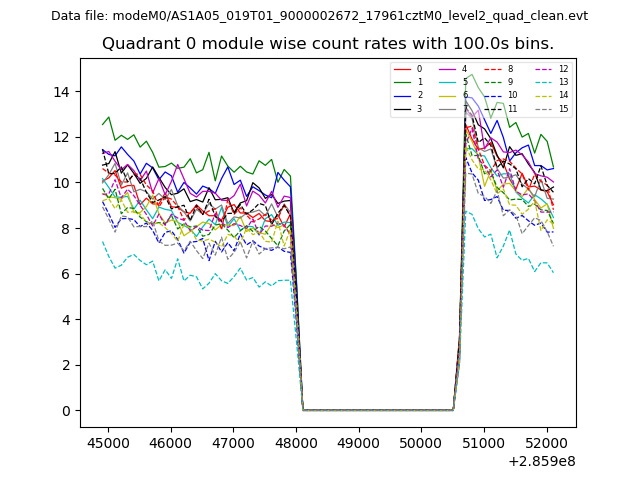
| Module-wise count rates for Quadrant A Data is divided into 100 sec bins |
 |
 |
| Module-wise count rates for Quadrant B Data is divided into 100 sec bins |
 |
 |
| Module-wise count rates for Quadrant C Data is divided into 100 sec bins |
 |
 |
| Module-wise count rates for Quadrant D Data is divided into 100 sec bins |
 |
 |
| Parameter | Plot |
|---|---|
| CZT HV Monitor | 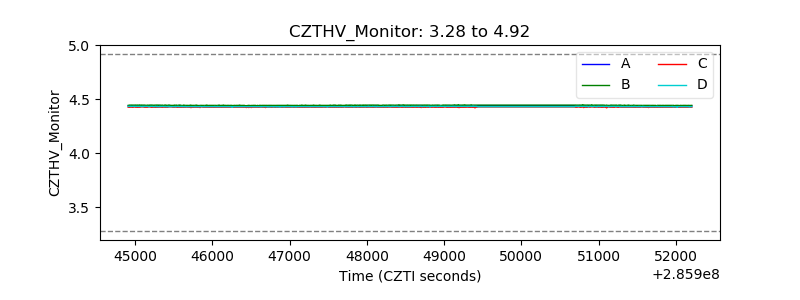 |
| D_VDD | 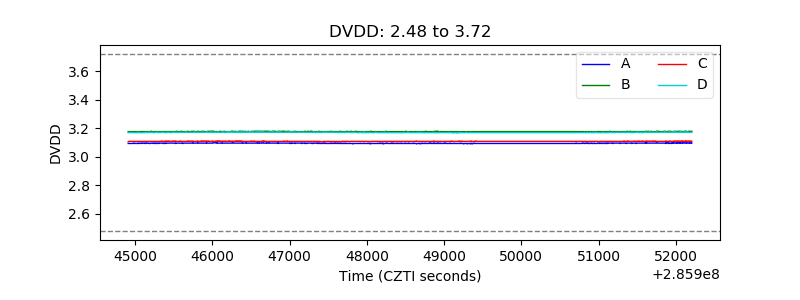 |
| Temperature 1 | 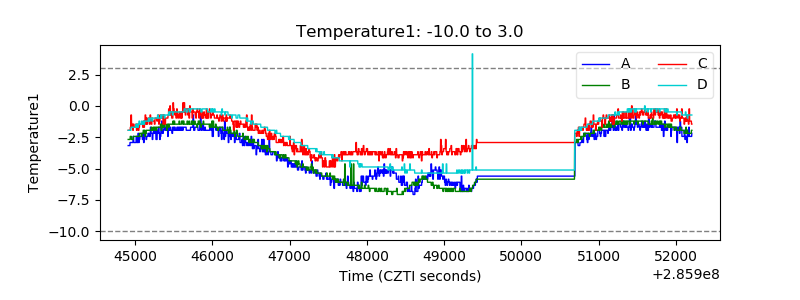 |
| Veto HV Monitor | 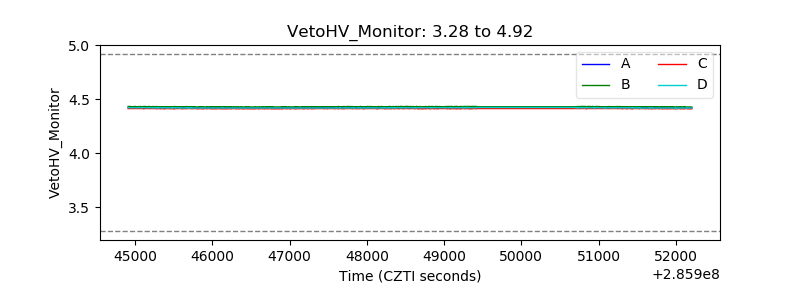 |
| Veto LLD | 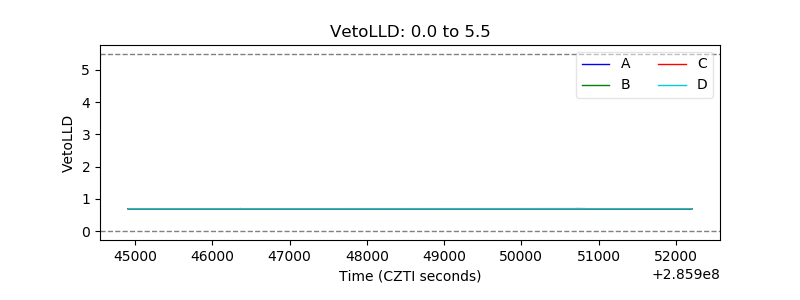 |
| Alpha Counter | 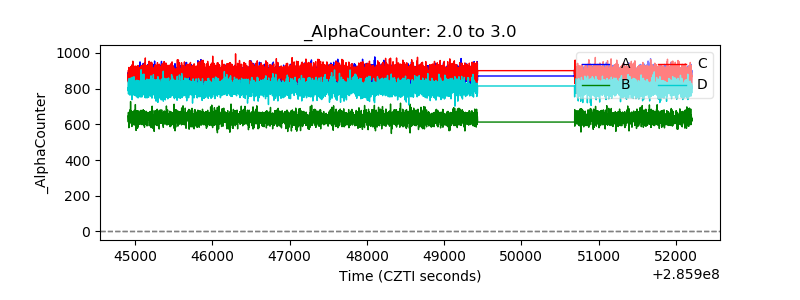 |
| _CPM_Rate | 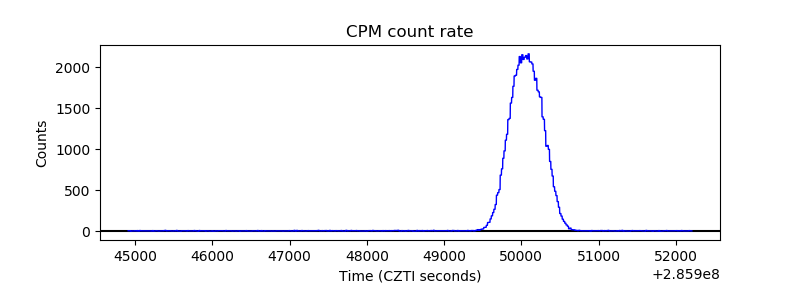 |
| CZT Counter | 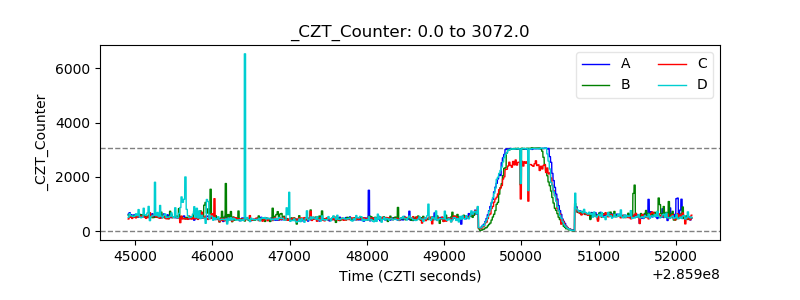 |
| +2.5 Volts monitor |  |
| +5 Volts monitor | 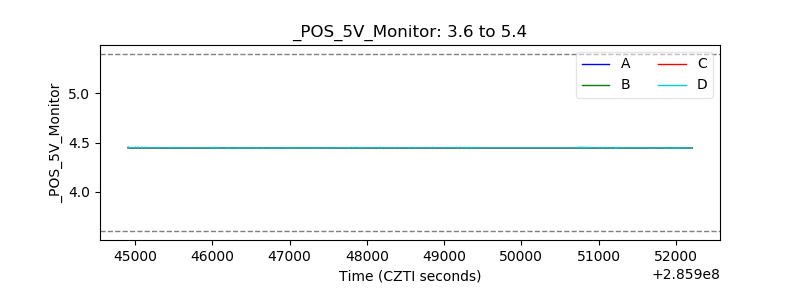 |
| _ROLL_ROT | 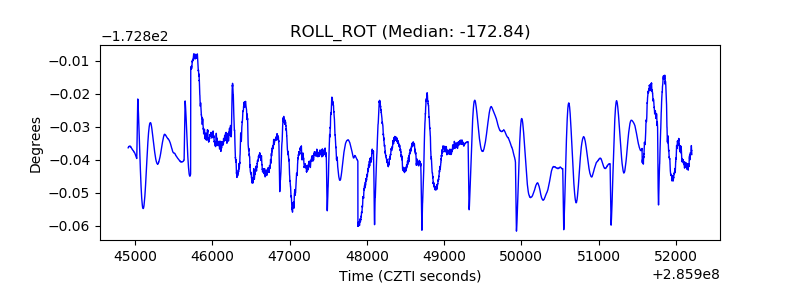 |
| _Roll_DEC | 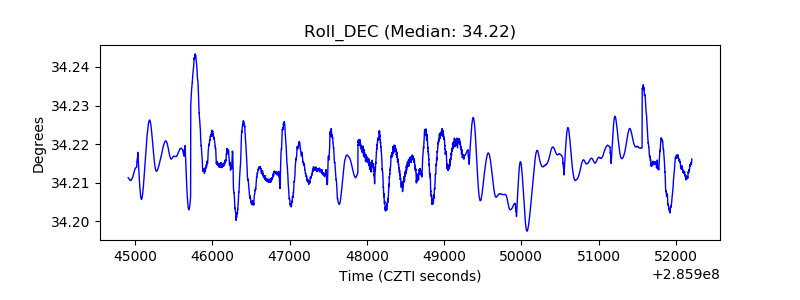 |
| _Roll_RA | 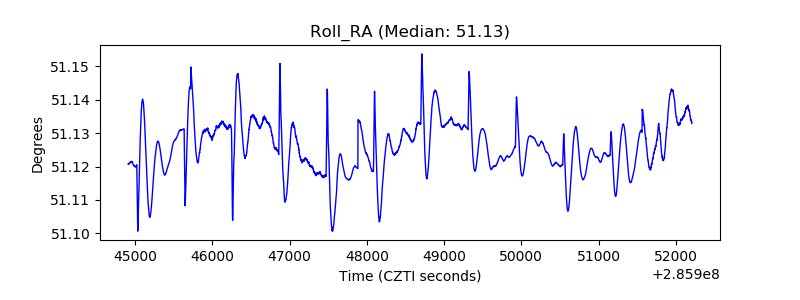 |
| Veto Counter | 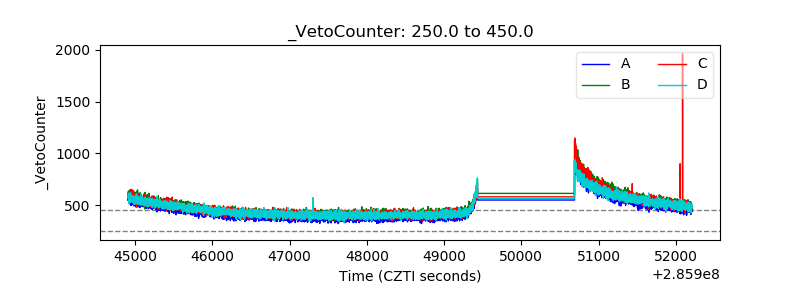 |