| Param | Original file | Final file |
|---|---|---|
| Filename | modeM0/AS1A05_019T01_9000002672_17962cztM0_level2.evt | modeM0/AS1A05_019T01_9000002672_17962cztM0_level2_quad_clean.evt |
| Size (bytes) | 451,362,240 | 97,519,680 |
| Size | 430.5 MB | 93.0 MB |
| Events in quadrant A | 3,337,413 | 649,940 |
| Events in quadrant B | 3,578,296 | 647,945 |
| Events in quadrant C | 3,226,229 | 614,303 |
| Events in quadrant D | 3,116,361 | 618,422 |
| Mode M0 | |||
|---|---|---|---|
| Quadrant | BADHDUFLAG | Total packets | Discarded packets |
| A | 0 | 13744 | 1 |
| B | 0 | 14517 | 1 |
| C | 0 | 13072 | 1 |
| D | 0 | 13037 | 1 |
| Mode M9 | |||
|---|---|---|---|
| Quadrant | BADHDUFLAG | Total packets | Discarded packets |
| A | 0 | 13 | 0 |
| B | 0 | 13 | 0 |
| C | 0 | 13 | 0 |
| D | 0 | 13 | 0 |
| Mode SS | |||
|---|---|---|---|
| Quadrant | BADHDUFLAG | Total packets | Discarded packets |
| A | 0 | 124 | 0 |
| B | 0 | 124 | 0 |
| C | 0 | 124 | 0 |
| D | 0 | 124 | 0 |
| Quadrant | Total seconds | Saturated seconds | Saturation percentage |
|---|---|---|---|
| A | 6050 | 117 | 1.933884% |
| B | 6051 | 146 | 2.412824% |
| C | 6050 | 95 | 1.570248% |
| D | 6050 | 55 | 0.909091% |
Noise dominated data is calculated using 1-second bins in cleaned event files. If a bin has >2000 counts, and if more than 50% of those come from <1% of pixels, then it is considered to be noise-dominated and hence unusable.
| Quadrant | # 1 sec bins | Bins with >0 counts | Bins with >2000 counts | High rate bins dominated by noise | Noise dominated (total time) | Noise dominated (detector-on time) | Marked lightcurve |
|---|---|---|---|---|---|---|---|
| A | 7350 | 6051 | 35 | 35 | 0.48% | 0.58% | 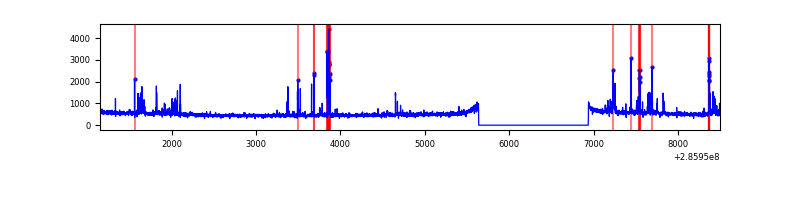 |
| B | 7351 | 6052 | 62 | 62 | 0.84% | 1.02% | 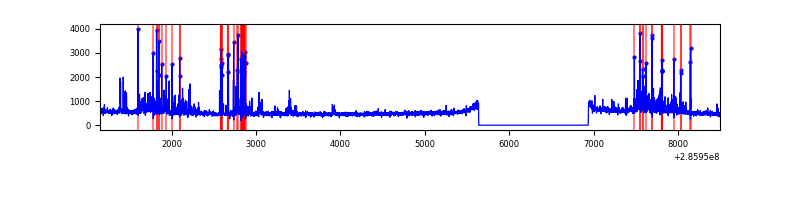 |
| C | 7350 | 6051 | 0 | 0 | 0.00% | 0.00% | 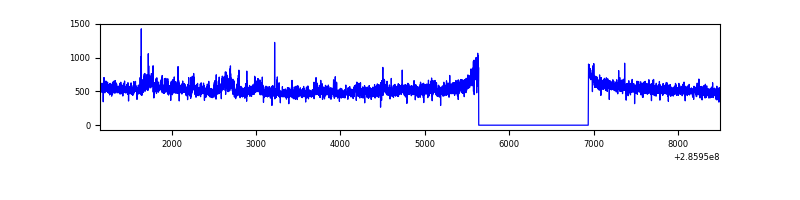 |
| D | 7350 | 6051 | 3 | 3 | 0.04% | 0.05% | 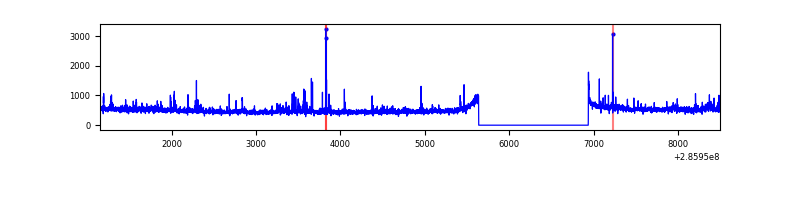 |
Top three noisy pixels from each quadrant. If the there are fewer than three noisy pixels in the level2.evt file, extra rows are filled as -1
| Pixel properties | Quadrant properties | ||||||
|---|---|---|---|---|---|---|---|
| Quadrant | DetID | PixID | Counts | Sigma | Mean | Median | Sigma |
| A | 14 | 237 | 210179 | 1345.67 | 784 | 770 | 155.6 |
| A | 15 | 174 | 113005 | 721.22 | 784 | 770 | 155.6 |
| A | 0 | 226 | 6942 | 39.66 | 784 | 770 | 155.6 |
| B | 7 | 220 | 392643 | 2717.81 | 774 | 758 | 144.2 |
| B | 5 | 172 | 38406 | 261.1 | 774 | 758 | 144.2 |
| B | 4 | 171 | 35778 | 242.87 | 774 | 758 | 144.2 |
| C | 3 | 233 | 193996 | 1121.65 | 745 | 750 | 172.3 |
| C | 14 | 238 | 116796 | 673.56 | 745 | 750 | 172.3 |
| C | 13 | 61 | 5442 | 27.23 | 745 | 750 | 172.3 |
| D | 7 | 238 | 62381 | 331.62 | 768 | 746 | 185.9 |
| D | 5 | 222 | 55910 | 296.81 | 768 | 746 | 185.9 |
| D | 10 | 70 | 29905 | 156.89 | 768 | 746 | 185.9 |
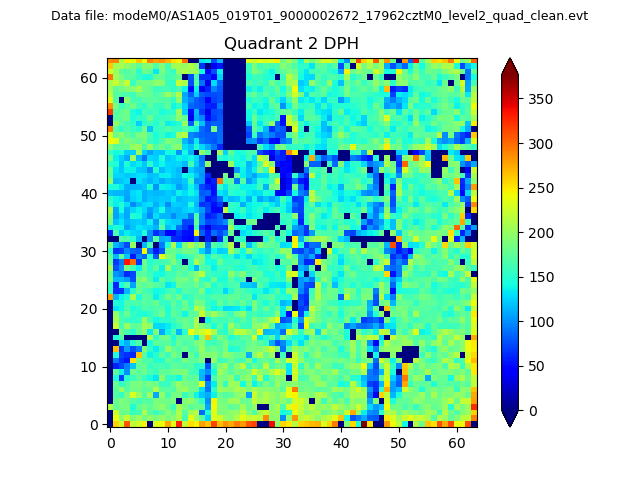
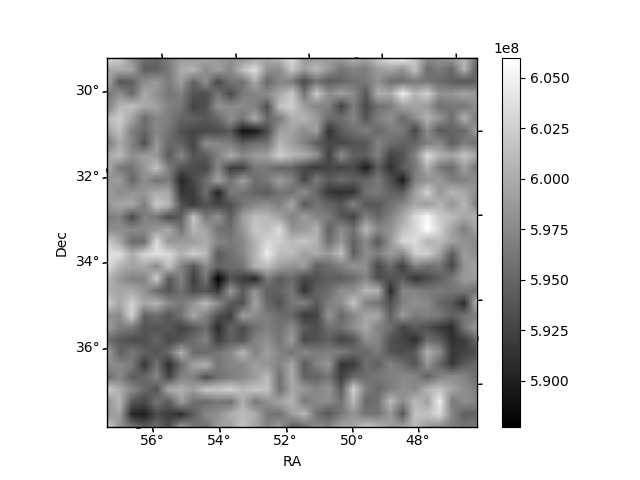
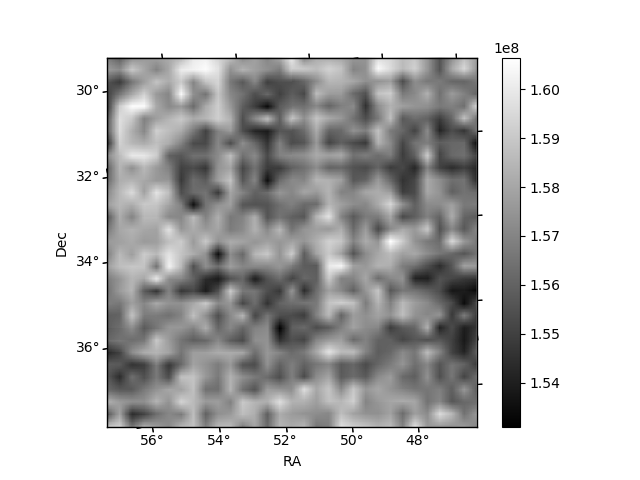
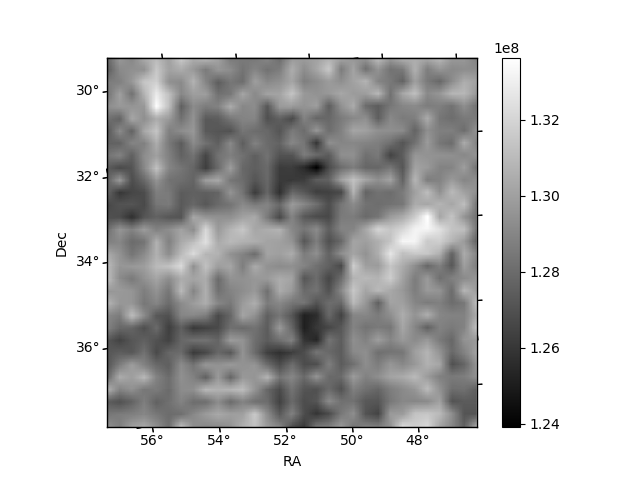
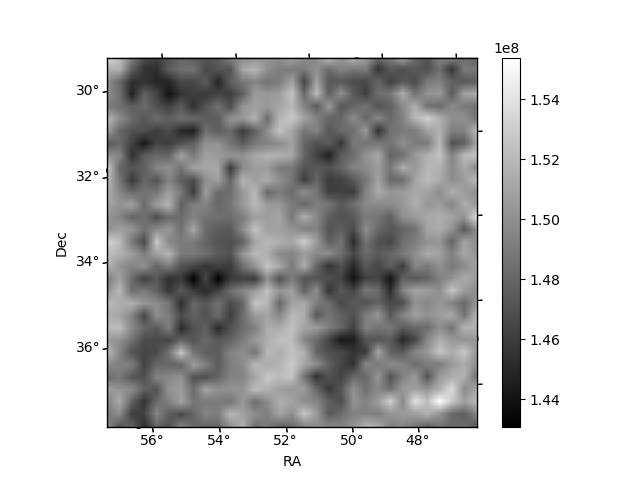
Histogram calculated using DETX and DETY for each event in the final _common_clean file
| Quadrant A | 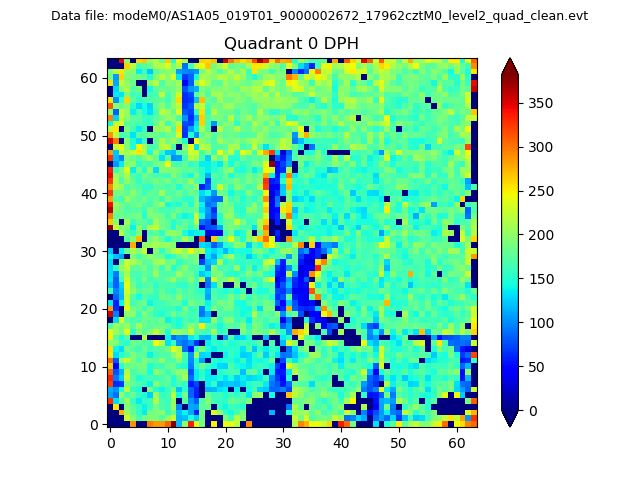 |
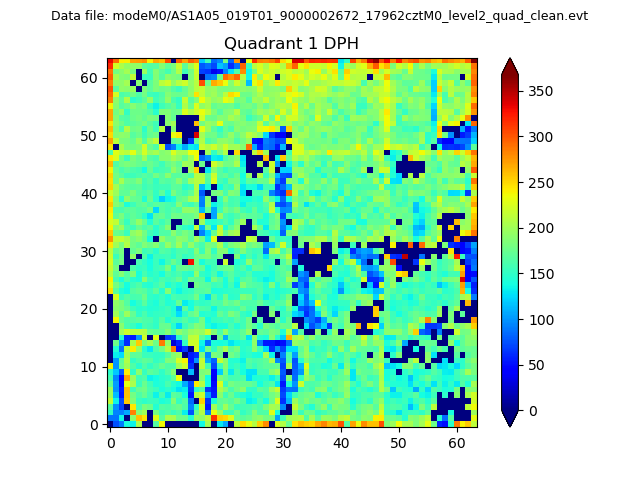 |
Quadrant B |
|---|---|---|---|
| Quadrant D | 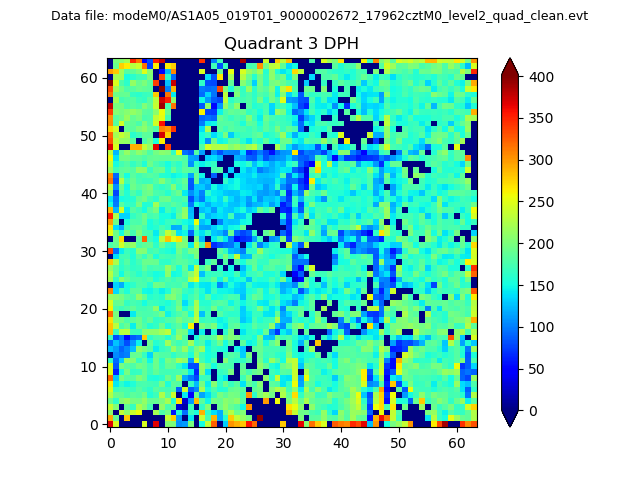 |
 |
Quadrant C |
| Plot type | Count rate plots | Images |
|---|---|---|
| Comparison with Poisson distribution Blue bars denote a histogram of data divided into 1 sec bins. Red curve is a Poisson curve with rate = median count rate of data. |
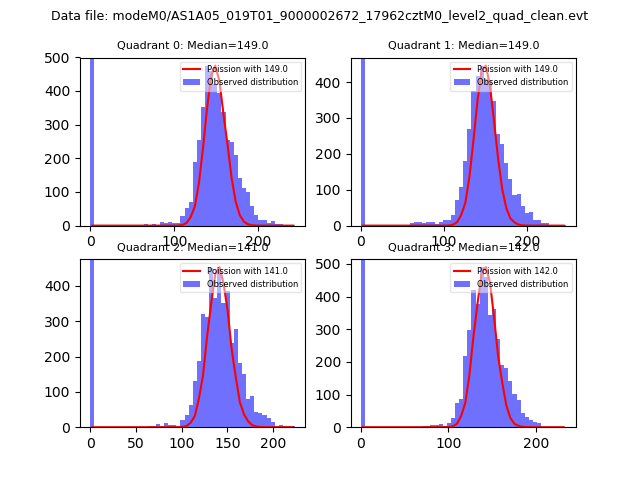 |
 |
| Quadrant-wise count rates Data is divided into 100 sec bins |
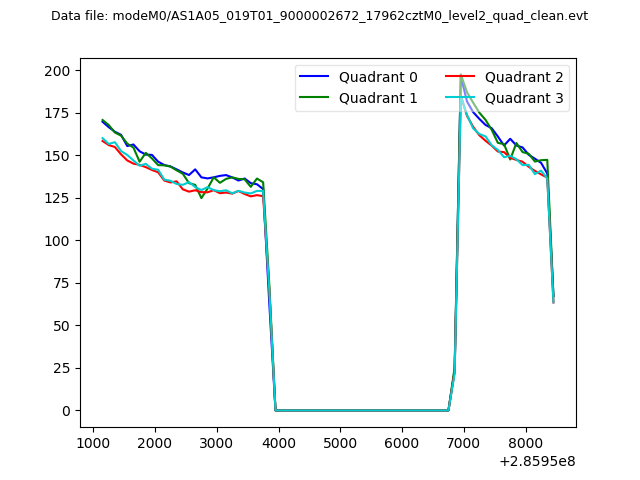 |
|
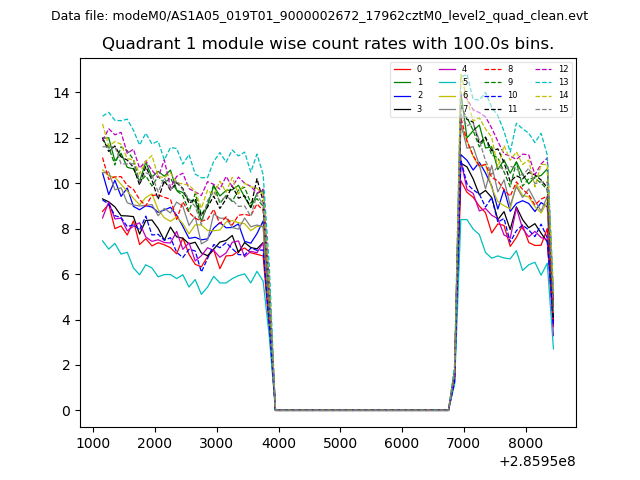
| Module-wise count rates for Quadrant A Data is divided into 100 sec bins |
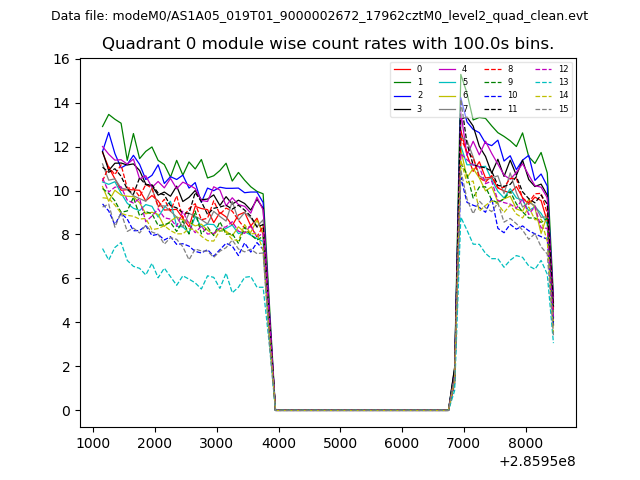 |
 |
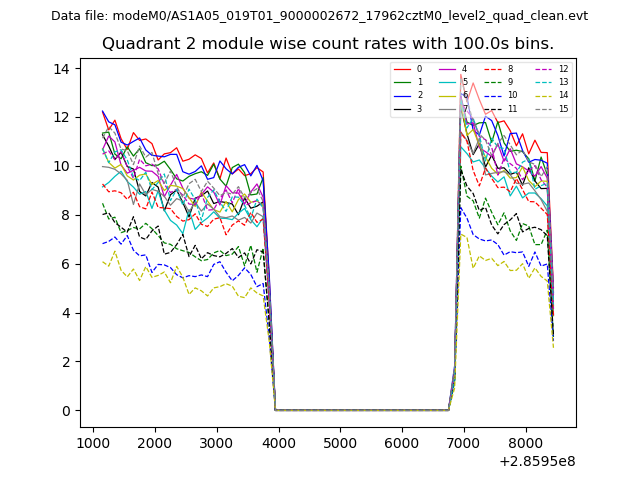
| Module-wise count rates for Quadrant B Data is divided into 100 sec bins |
 |
 |
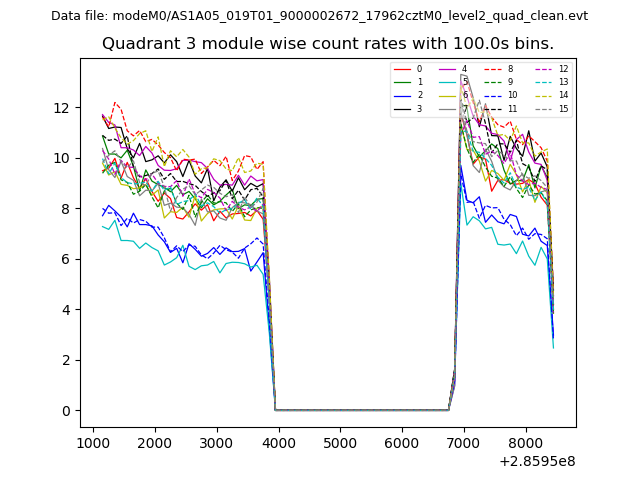
| Module-wise count rates for Quadrant C Data is divided into 100 sec bins |
 |
 |
| Module-wise count rates for Quadrant D Data is divided into 100 sec bins |
 |
 |
| Parameter | Plot |
|---|---|
| CZT HV Monitor | 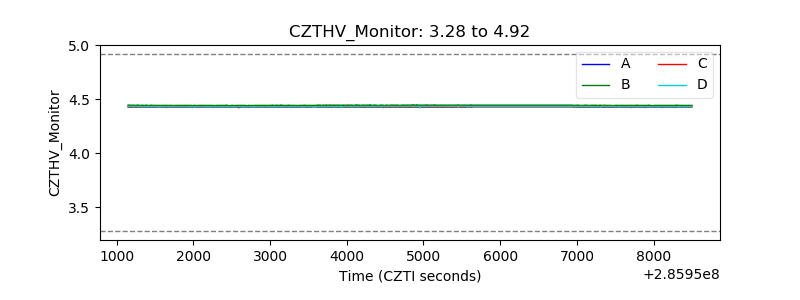 |
| D_VDD | 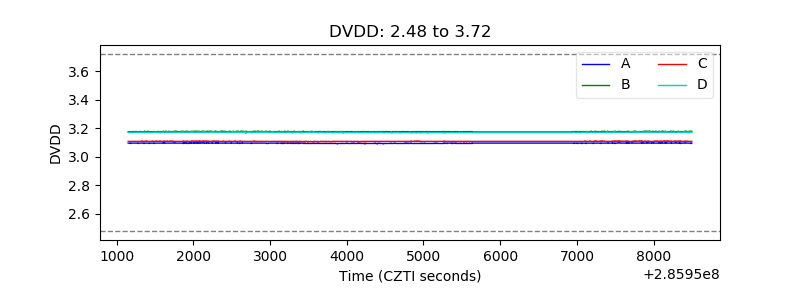 |
| Temperature 1 | 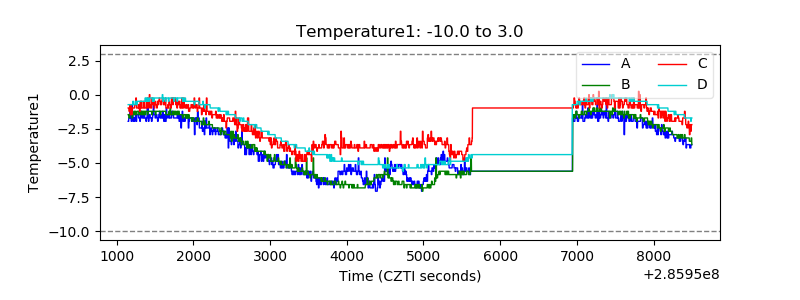 |
| Veto HV Monitor | 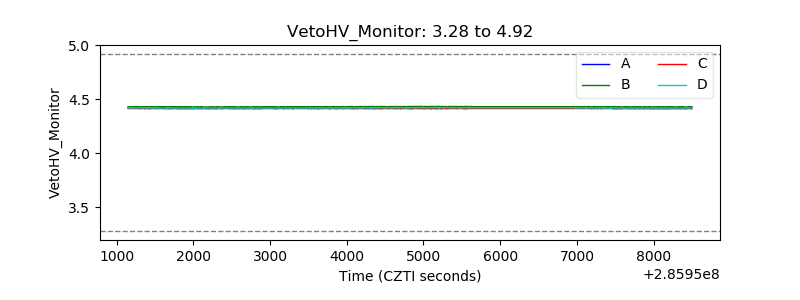 |
| Veto LLD | 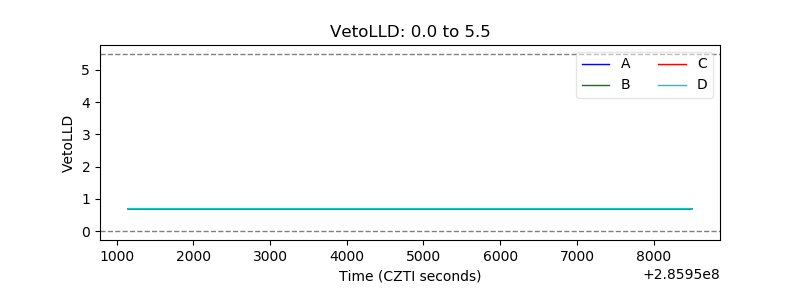 |
| Alpha Counter | 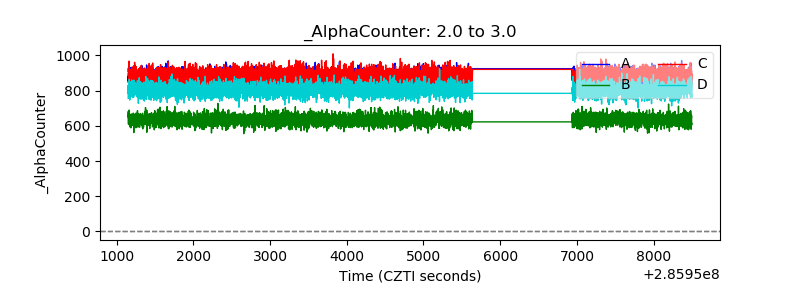 |
| _CPM_Rate | 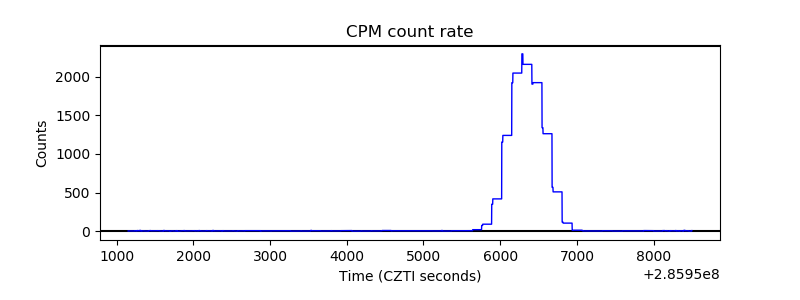 |
| CZT Counter | 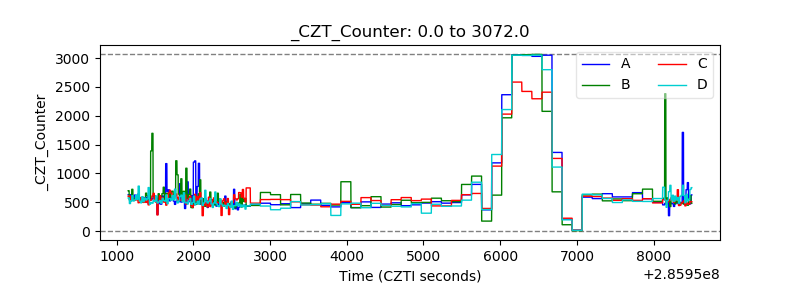 |
| +2.5 Volts monitor |  |
| +5 Volts monitor |  |
| _ROLL_ROT | 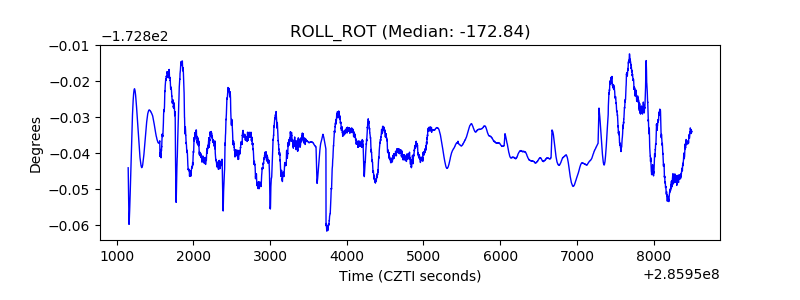 |
| _Roll_DEC | 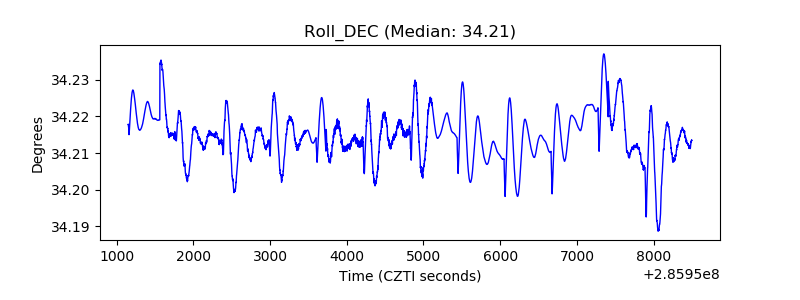 |
| _Roll_RA | 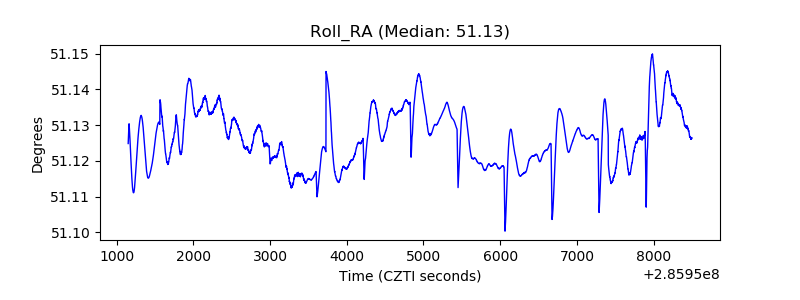 |
| Veto Counter | 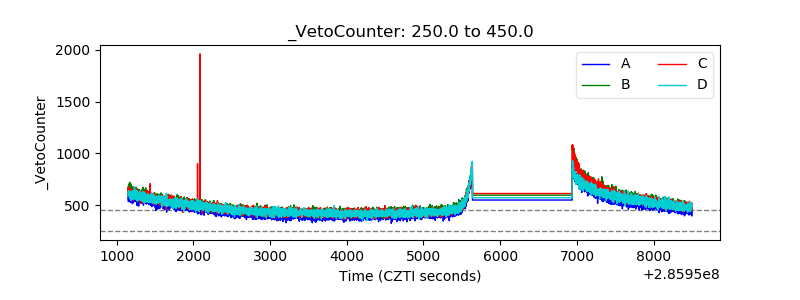 |