| Param | Original file | Final file |
|---|---|---|
| Filename | modeM0/AS1A05_019T01_9000002672_17963cztM0_level2.evt | modeM0/AS1A05_019T01_9000002672_17963cztM0_level2_quad_clean.evt |
| Size (bytes) | 465,609,600 | 98,182,080 |
| Size | 444.0 MB | 93.6 MB |
| Events in quadrant A | 3,646,407 | 646,524 |
| Events in quadrant B | 3,534,787 | 651,295 |
| Events in quadrant C | 3,224,292 | 615,914 |
| Events in quadrant D | 3,263,608 | 615,825 |
| Mode M0 | |||
|---|---|---|---|
| Quadrant | BADHDUFLAG | Total packets | Discarded packets |
| A | 0 | 14919 | 1 |
| B | 0 | 14590 | 1 |
| C | 0 | 13441 | 1 |
| D | 0 | 13764 | 1 |
| Mode M9 | |||
|---|---|---|---|
| Quadrant | BADHDUFLAG | Total packets | Discarded packets |
| A | 0 | 17 | 0 |
| B | 0 | 18 | 0 |
| C | 0 | 18 | 0 |
| D | 0 | 18 | 0 |
| Mode SS | |||
|---|---|---|---|
| Quadrant | BADHDUFLAG | Total packets | Discarded packets |
| A | 0 | 128 | 0 |
| B | 0 | 128 | 0 |
| C | 0 | 128 | 0 |
| D | 0 | 128 | 0 |
| Quadrant | Total seconds | Saturated seconds | Saturation percentage |
|---|---|---|---|
| A | 6365 | 111 | 1.743912% |
| B | 6365 | 71 | 1.115475% |
| C | 6365 | 75 | 1.178319% |
| D | 6365 | 39 | 0.612726% |
Noise dominated data is calculated using 1-second bins in cleaned event files. If a bin has >2000 counts, and if more than 50% of those come from <1% of pixels, then it is considered to be noise-dominated and hence unusable.
| Quadrant | # 1 sec bins | Bins with >0 counts | Bins with >2000 counts | High rate bins dominated by noise | Noise dominated (total time) | Noise dominated (detector-on time) | Marked lightcurve |
|---|---|---|---|---|---|---|---|
| A | 7715 | 6366 | 64 | 64 | 0.83% | 1.01% | 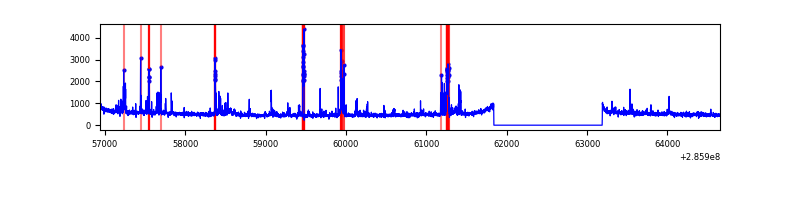 |
| B | 7715 | 6366 | 25 | 25 | 0.32% | 0.39% | 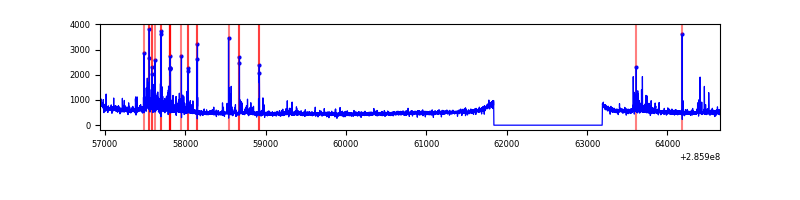 |
| C | 7715 | 6366 | 0 | 0 | 0.00% | 0.00% | 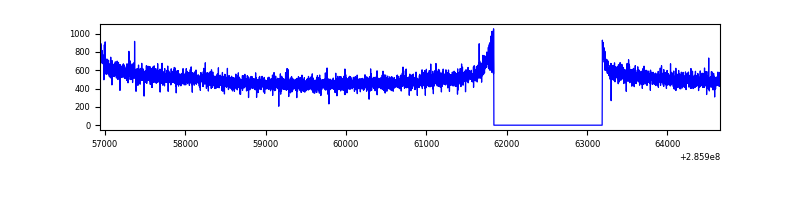 |
| D | 7715 | 6366 | 7 | 7 | 0.09% | 0.11% | 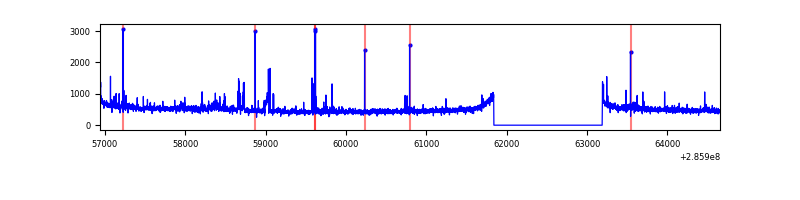 |
Top three noisy pixels from each quadrant. If the there are fewer than three noisy pixels in the level2.evt file, extra rows are filled as -1
| Pixel properties | Quadrant properties | ||||||
|---|---|---|---|---|---|---|---|
| Quadrant | DetID | PixID | Counts | Sigma | Mean | Median | Sigma |
| A | 15 | 174 | 263553 | 1589.9 | 823 | 807 | 165.3 |
| A | 14 | 237 | 216243 | 1303.63 | 823 | 807 | 165.3 |
| A | 0 | 226 | 7151 | 38.39 | 823 | 807 | 165.3 |
| B | 7 | 220 | 223506 | 1452.26 | 821 | 802 | 153.4 |
| B | 0 | 197 | 28373 | 179.79 | 821 | 802 | 153.4 |
| B | 4 | 171 | 27683 | 175.29 | 821 | 802 | 153.4 |
| C | 14 | 238 | 123239 | 669.11 | 790 | 798 | 183.0 |
| C | 3 | 233 | 18117 | 94.64 | 790 | 798 | 183.0 |
| C | 13 | 61 | 5773 | 27.19 | 790 | 798 | 183.0 |
| D | 5 | 222 | 72927 | 364.59 | 810 | 787 | 197.9 |
| D | 7 | 238 | 60210 | 300.32 | 810 | 787 | 197.9 |
| D | 2 | 234 | 27295 | 133.97 | 810 | 787 | 197.9 |
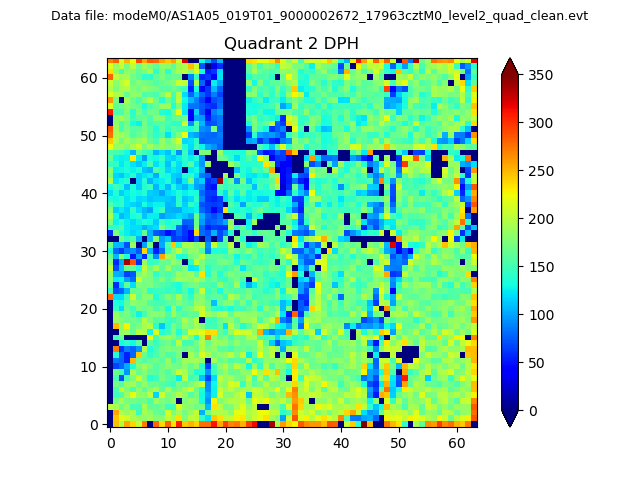
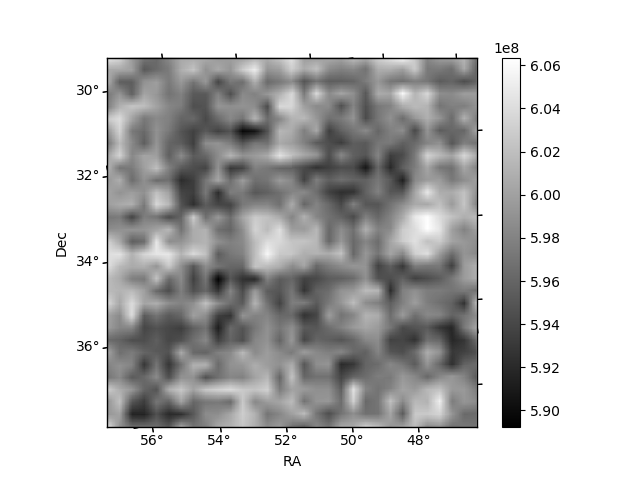
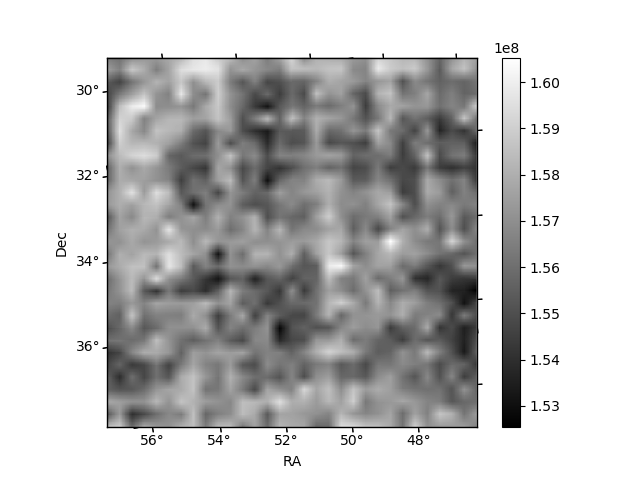
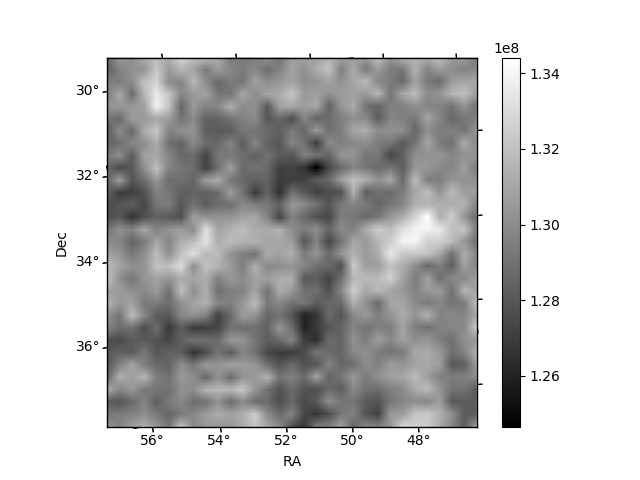
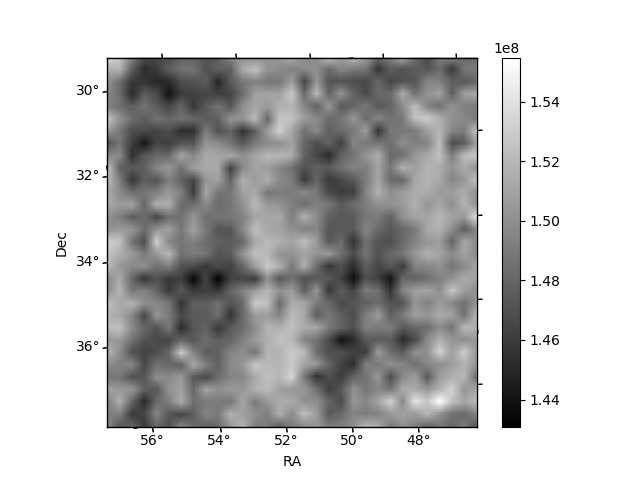
Histogram calculated using DETX and DETY for each event in the final _common_clean file
| Quadrant A | 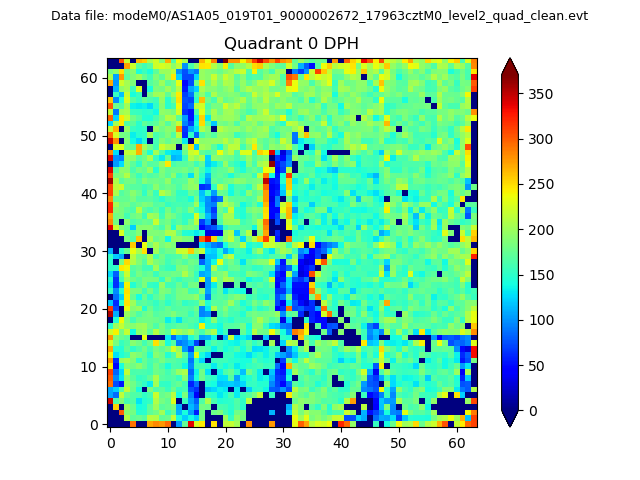 |
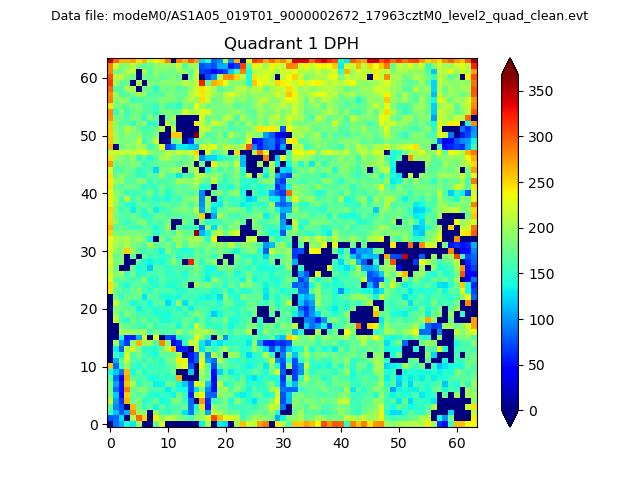 |
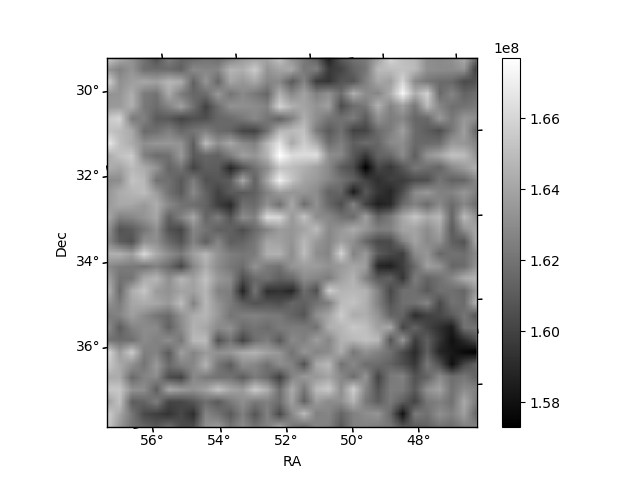
Quadrant B |
|---|---|---|---|
| Quadrant D | 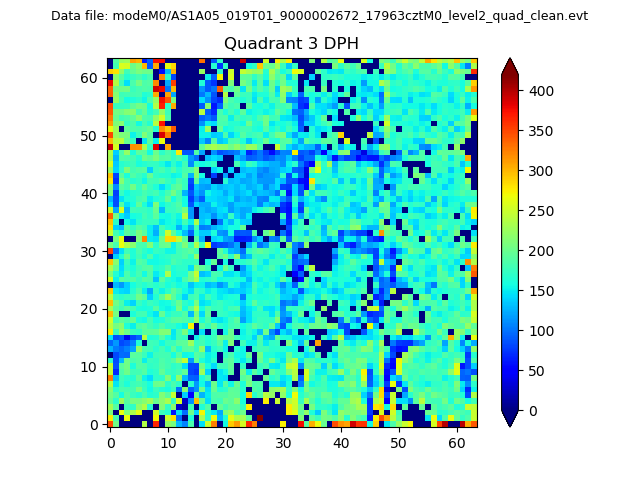 |
 |
Quadrant C |
| Plot type | Count rate plots | Images |
|---|---|---|
| Comparison with Poisson distribution Blue bars denote a histogram of data divided into 1 sec bins. Red curve is a Poisson curve with rate = median count rate of data. |
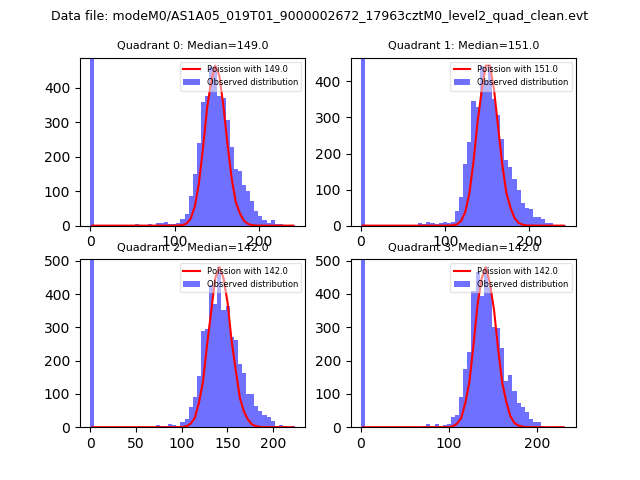 |
 |
| Quadrant-wise count rates Data is divided into 100 sec bins |
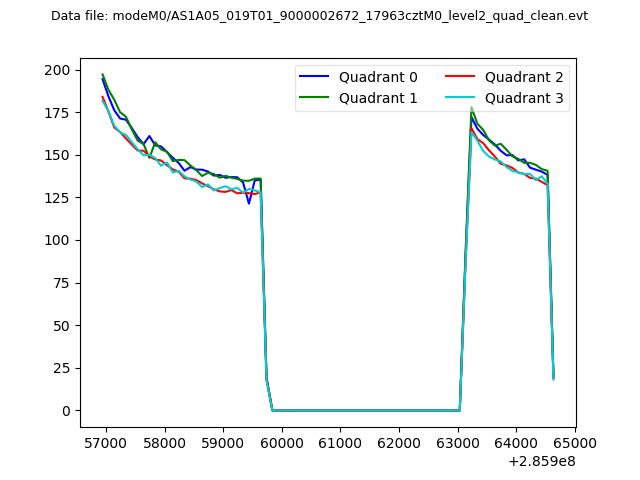 |
|
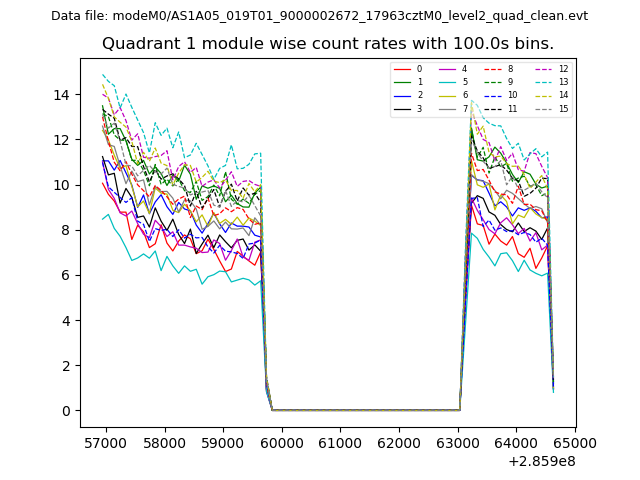
| Module-wise count rates for Quadrant A Data is divided into 100 sec bins |
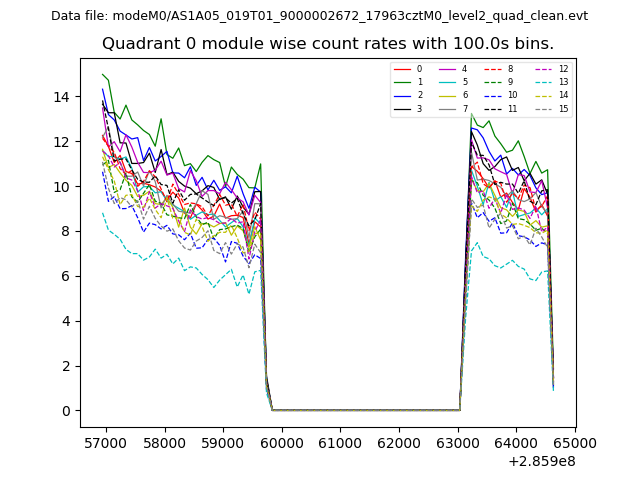 |
 |
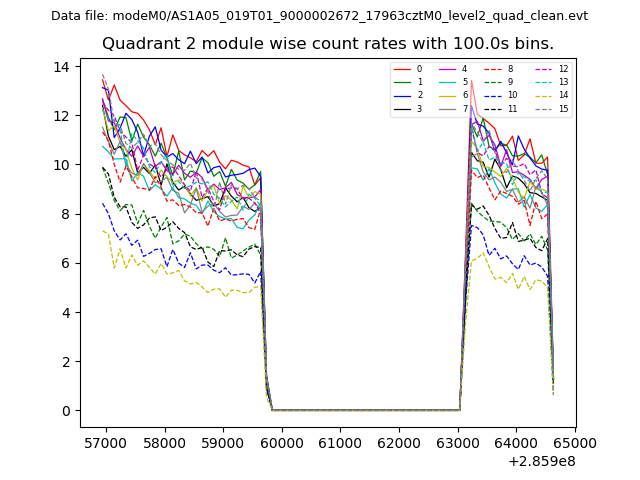
| Module-wise count rates for Quadrant B Data is divided into 100 sec bins |
 |
 |
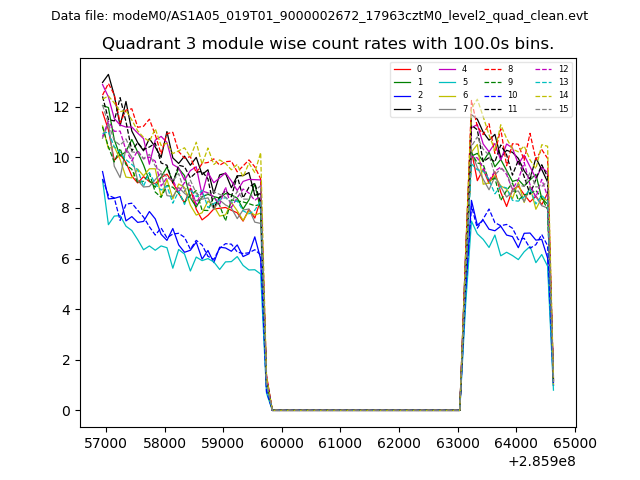
| Module-wise count rates for Quadrant C Data is divided into 100 sec bins |
 |
 |
| Module-wise count rates for Quadrant D Data is divided into 100 sec bins |
 |
 |
| Parameter | Plot |
|---|---|
| CZT HV Monitor | 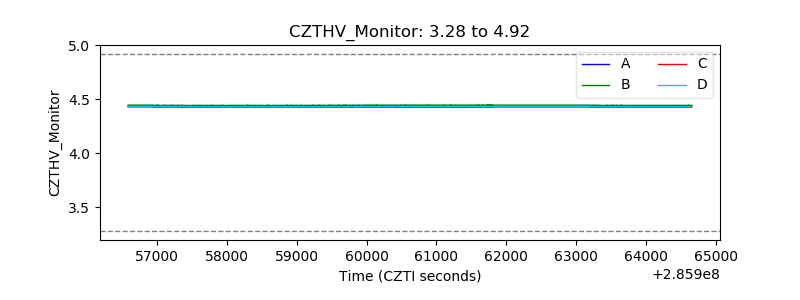 |
| D_VDD | 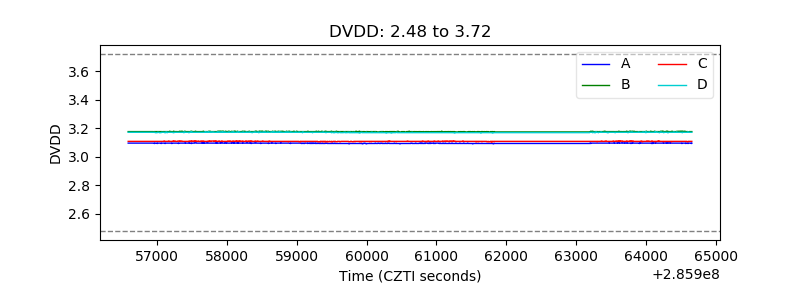 |
| Temperature 1 | 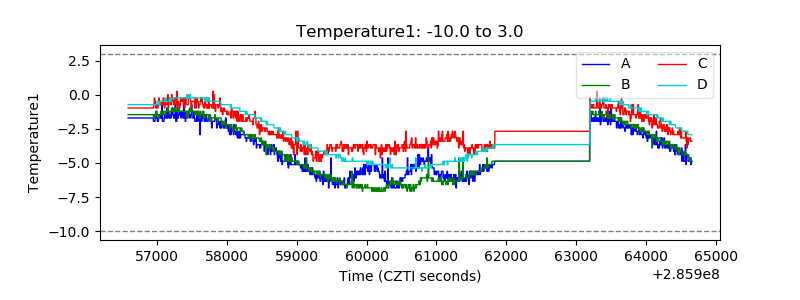 |
| Veto HV Monitor | 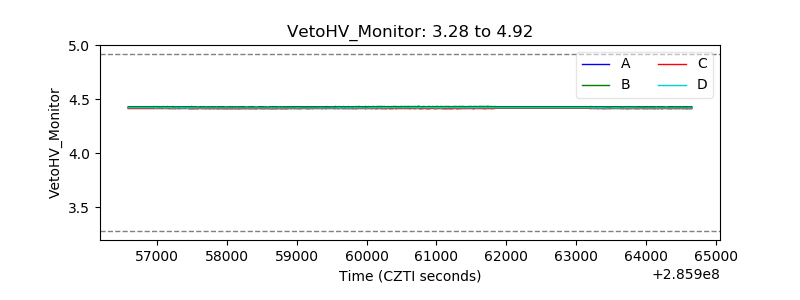 |
| Veto LLD | 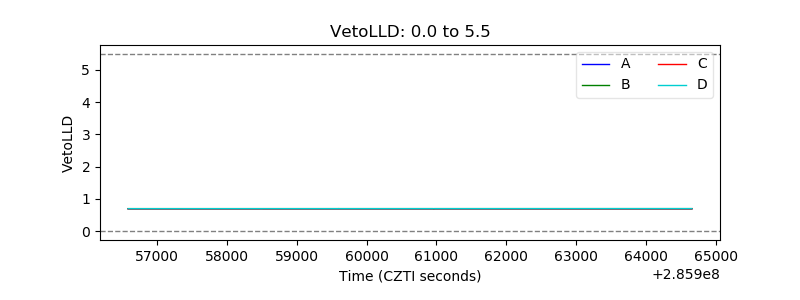 |
| Alpha Counter |  |
| _CPM_Rate | 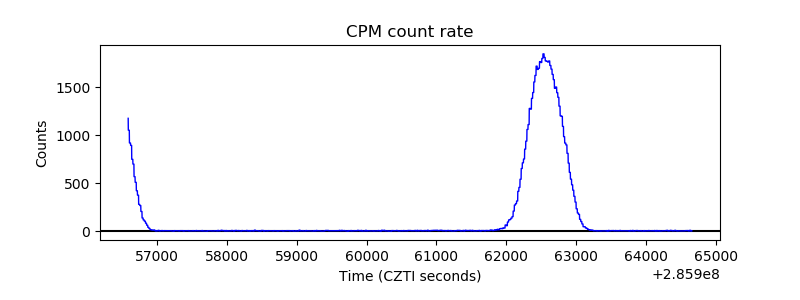 |
| CZT Counter | 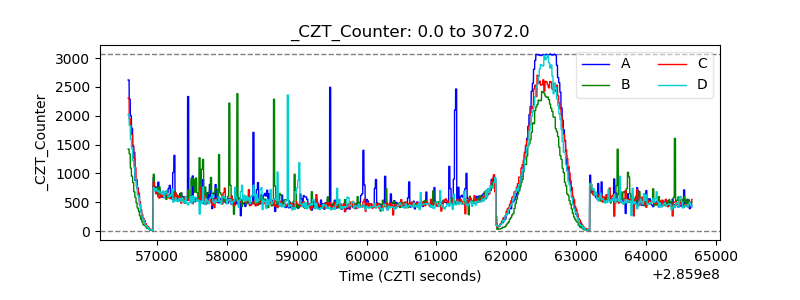 |
| +2.5 Volts monitor | 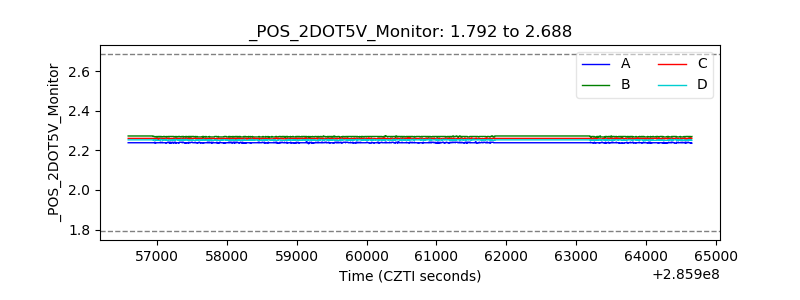 |
| +5 Volts monitor |  |
| _ROLL_ROT | 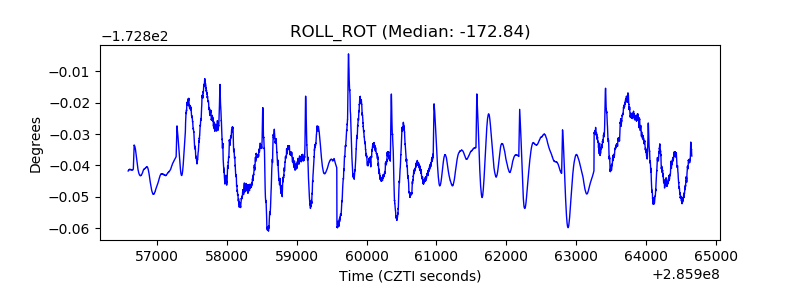 |
| _Roll_DEC | 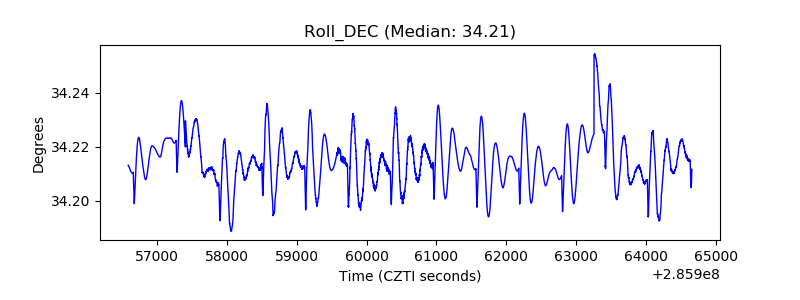 |
| _Roll_RA | 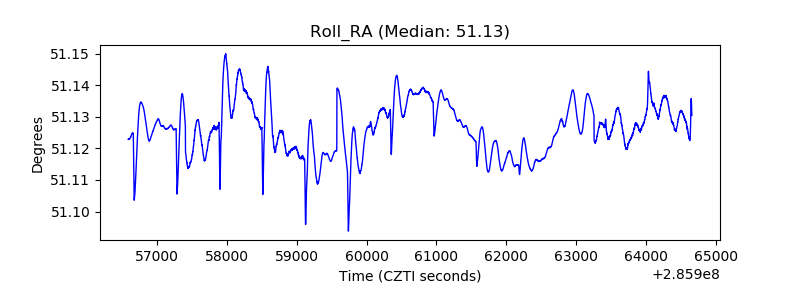 |
| Veto Counter | 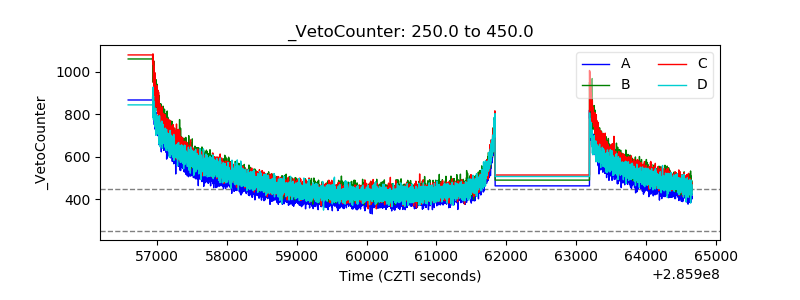 |