| Param | Original file | Final file |
|---|---|---|
| Filename | modeM0/AS1A05_019T01_9000002672_17967cztM0_level2.evt | modeM0/AS1A05_019T01_9000002672_17967cztM0_level2_quad_clean.evt |
| Size (bytes) | 559,509,120 | 110,712,960 |
| Size | 533.6 MB | 105.6 MB |
| Events in quadrant A | 4,005,224 | 706,798 |
| Events in quadrant B | 4,194,512 | 708,957 |
| Events in quadrant C | 4,020,077 | 683,556 |
| Events in quadrant D | 4,163,829 | 679,323 |
| Mode M0 | |||
|---|---|---|---|
| Quadrant | BADHDUFLAG | Total packets | Discarded packets |
| A | 0 | 17360 | 2 |
| B | 0 | 17898 | 2 |
| C | 0 | 17305 | 2 |
| D | 0 | 18083 | 3 |
| Mode M9 | |||
|---|---|---|---|
| Quadrant | BADHDUFLAG | Total packets | Discarded packets |
| A | 0 | 10 | 0 |
| B | 0 | 10 | 0 |
| C | 0 | 10 | 0 |
| D | 0 | 10 | 0 |
| Mode SS | |||
|---|---|---|---|
| Quadrant | BADHDUFLAG | Total packets | Discarded packets |
| A | 0 | 168 | 0 |
| B | 0 | 168 | 0 |
| C | 0 | 168 | 0 |
| D | 0 | 168 | 0 |
| Quadrant | Total seconds | Saturated seconds | Saturation percentage |
|---|---|---|---|
| A | 8270 | 76 | 0.918984% |
| B | 8271 | 154 | 1.861927% |
| C | 8271 | 111 | 1.342038% |
| D | 8270 | 62 | 0.749698% |
Noise dominated data is calculated using 1-second bins in cleaned event files. If a bin has >2000 counts, and if more than 50% of those come from <1% of pixels, then it is considered to be noise-dominated and hence unusable.
| Quadrant | # 1 sec bins | Bins with >0 counts | Bins with >2000 counts | High rate bins dominated by noise | Noise dominated (total time) | Noise dominated (detector-on time) | Marked lightcurve |
|---|---|---|---|---|---|---|---|
| A | 9230 | 8272 | 0 | 0 | 0.00% | 0.00% | 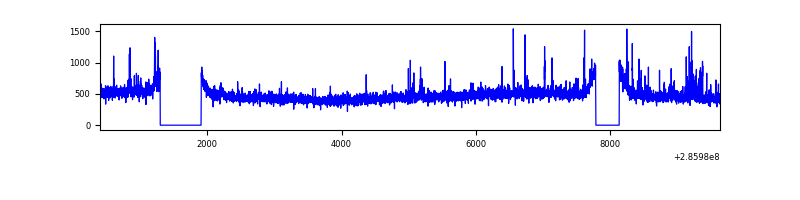 |
| B | 9231 | 8273 | 8 | 8 | 0.09% | 0.10% | 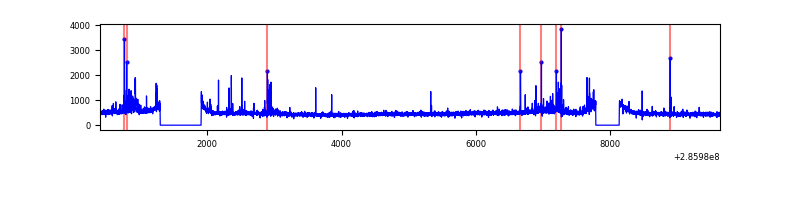 |
| C | 9231 | 8273 | 0 | 0 | 0.00% | 0.00% | 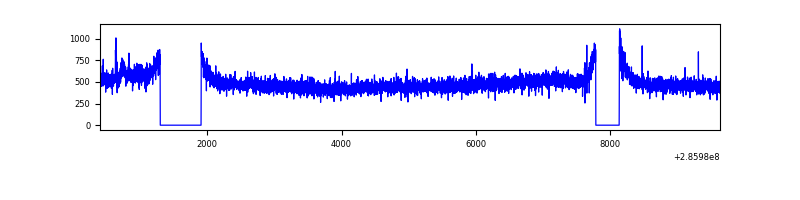 |
| D | 9230 | 8272 | 26 | 26 | 0.28% | 0.31% | 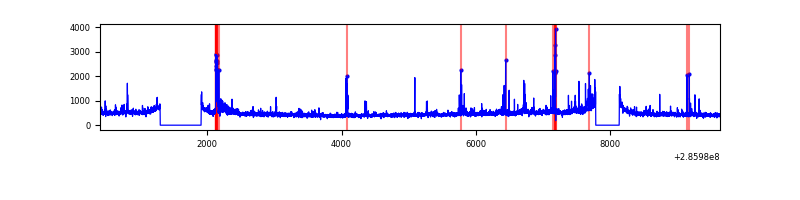 |
Top three noisy pixels from each quadrant. If the there are fewer than three noisy pixels in the level2.evt file, extra rows are filled as -1
| Pixel properties | Quadrant properties | ||||||
|---|---|---|---|---|---|---|---|
| Quadrant | DetID | PixID | Counts | Sigma | Mean | Median | Sigma |
| A | 14 | 237 | 109477 | 529.88 | 1004 | 982 | 204.8 |
| A | 15 | 174 | 32200 | 152.47 | 1004 | 982 | 204.8 |
| A | 0 | 226 | 8724 | 37.81 | 1004 | 982 | 204.8 |
| B | 7 | 220 | 80519 | 406.26 | 1004 | 973 | 195.8 |
| B | 0 | 197 | 51134 | 256.18 | 1004 | 973 | 195.8 |
| B | 4 | 80 | 27451 | 135.23 | 1004 | 973 | 195.8 |
| C | 14 | 238 | 147624 | 640.69 | 970 | 975 | 228.9 |
| C | 3 | 233 | 84734 | 365.93 | 970 | 975 | 228.9 |
| C | 13 | 61 | 6951 | 26.11 | 970 | 975 | 228.9 |
| D | 5 | 222 | 154775 | 631.37 | 985 | 954 | 243.6 |
| D | 12 | 233 | 84363 | 342.36 | 985 | 954 | 243.6 |
| D | 7 | 38 | 63178 | 255.4 | 985 | 954 | 243.6 |
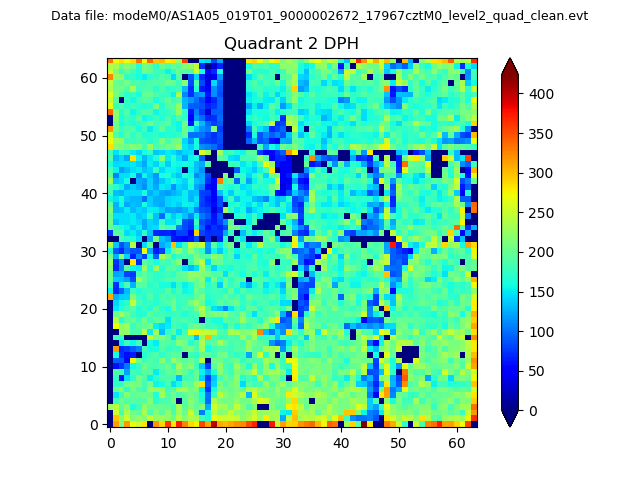
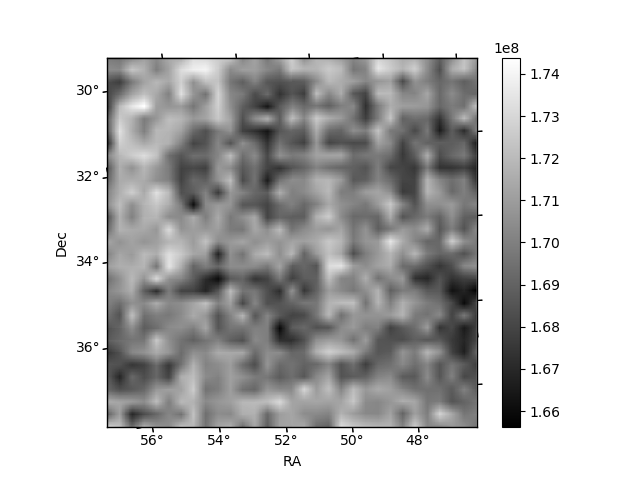
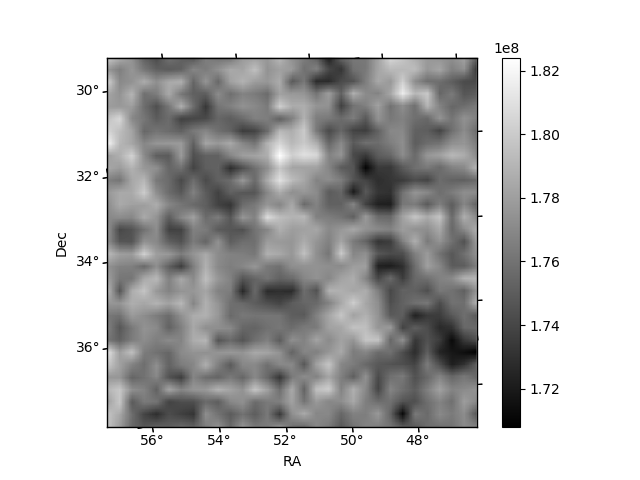
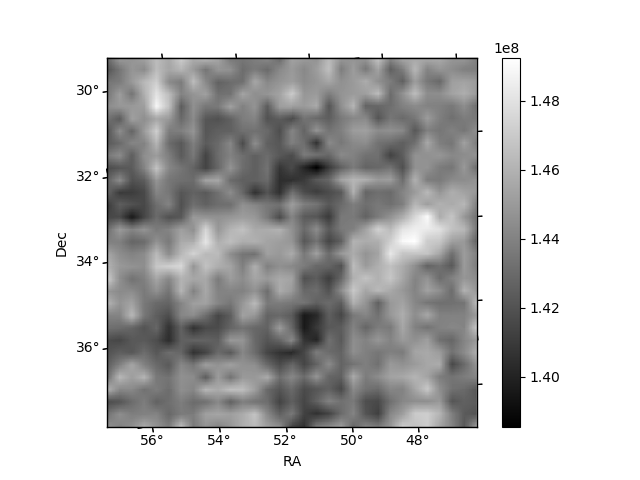
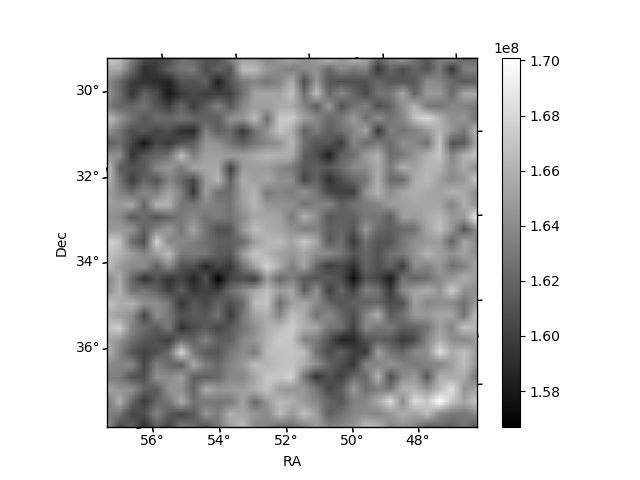
Histogram calculated using DETX and DETY for each event in the final _common_clean file
| Quadrant A | 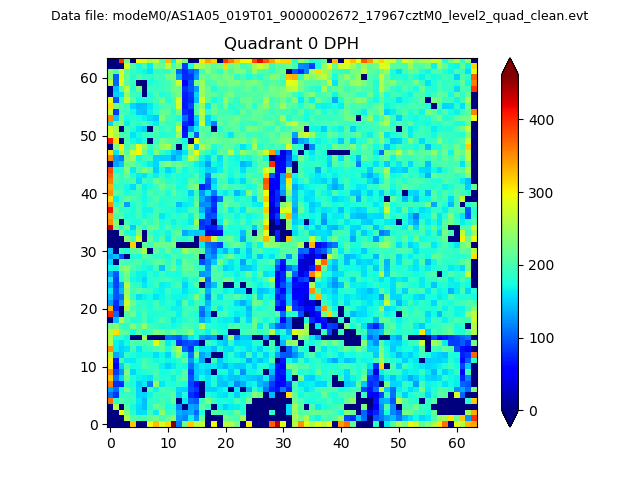 |
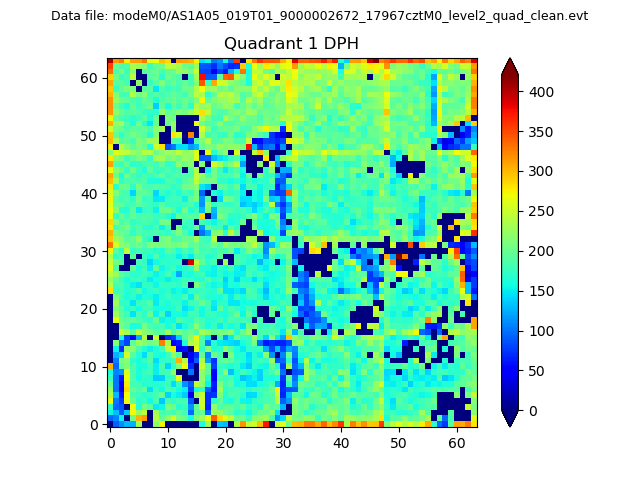 |
Quadrant B |
|---|---|---|---|
| Quadrant D | 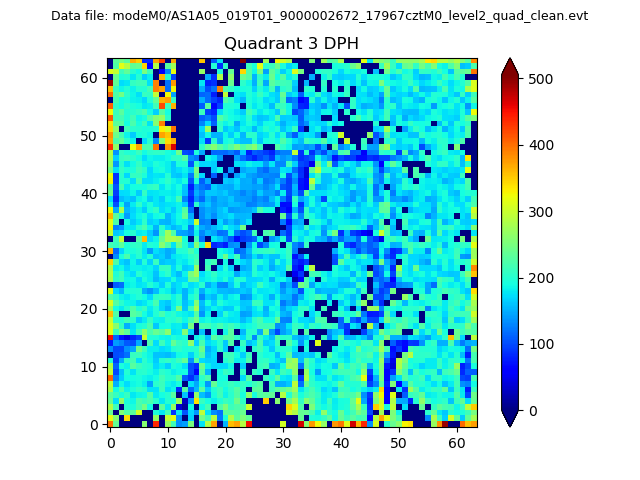 |
 |
Quadrant C |
| Plot type | Count rate plots | Images |
|---|---|---|
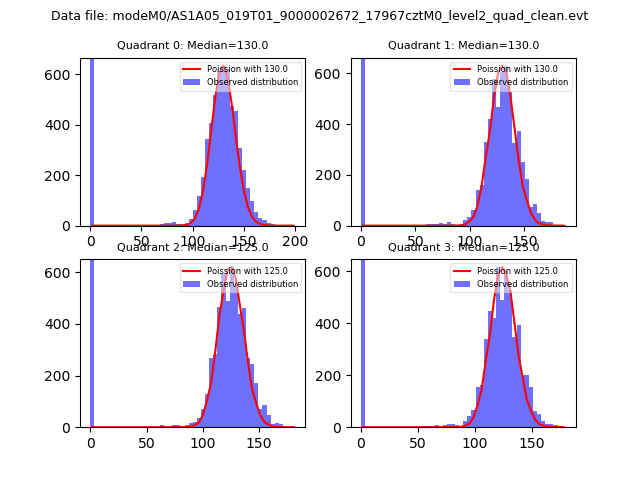
| Comparison with Poisson distribution Blue bars denote a histogram of data divided into 1 sec bins. Red curve is a Poisson curve with rate = median count rate of data. |
 |
 |
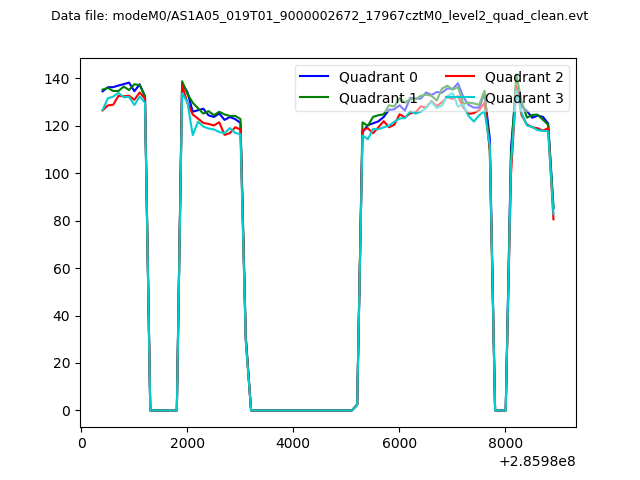
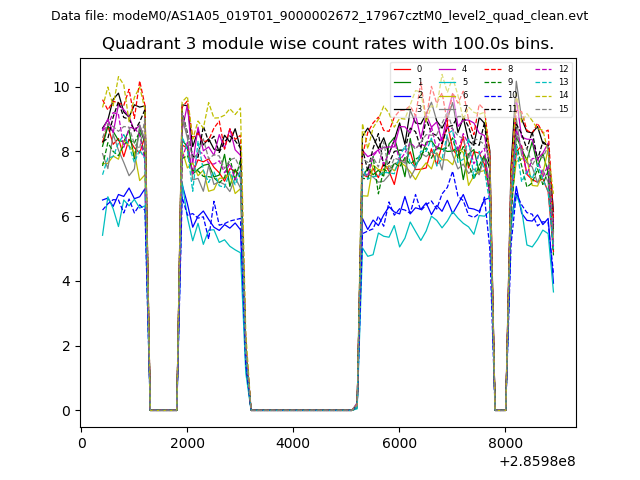
| Quadrant-wise count rates Data is divided into 100 sec bins |
 |
|
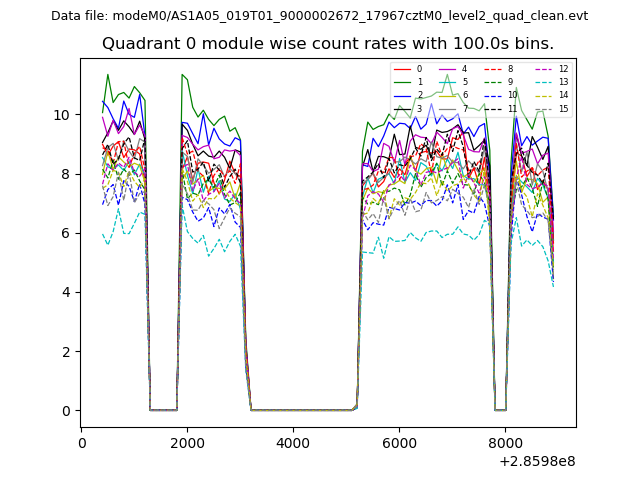
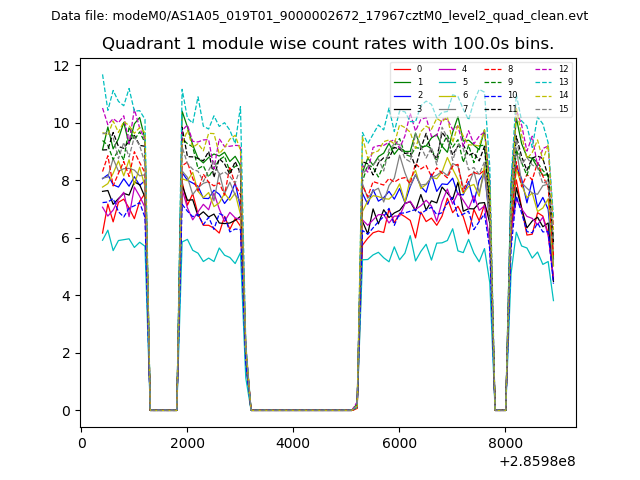
| Module-wise count rates for Quadrant A Data is divided into 100 sec bins |
 |
 |
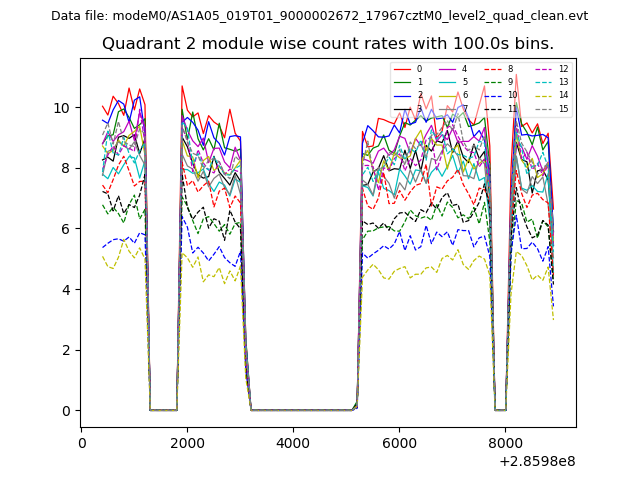
| Module-wise count rates for Quadrant B Data is divided into 100 sec bins |
 |
 |
| Module-wise count rates for Quadrant C Data is divided into 100 sec bins |
 |
 |
| Module-wise count rates for Quadrant D Data is divided into 100 sec bins |
 |
 |
| Parameter | Plot |
|---|---|
| CZT HV Monitor | 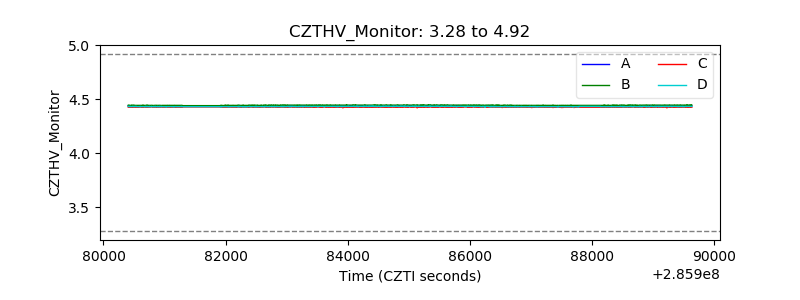 |
| D_VDD | 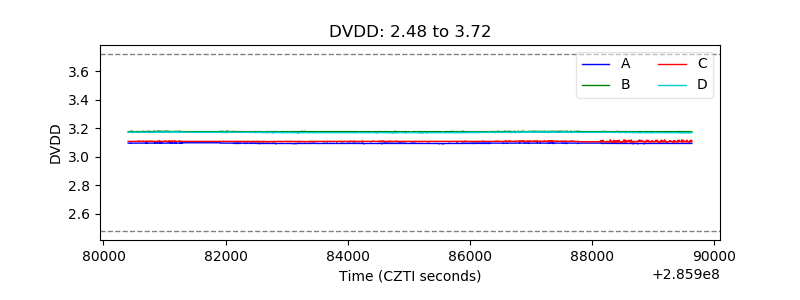 |
| Temperature 1 | 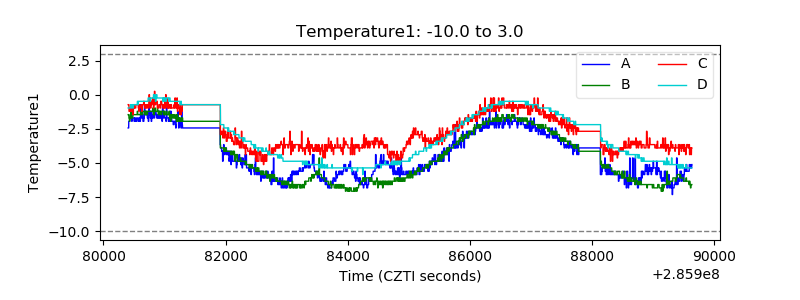 |
| Veto HV Monitor | 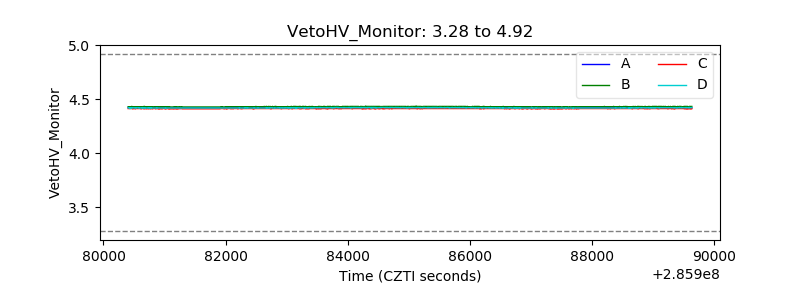 |
| Veto LLD |  |
| Alpha Counter | 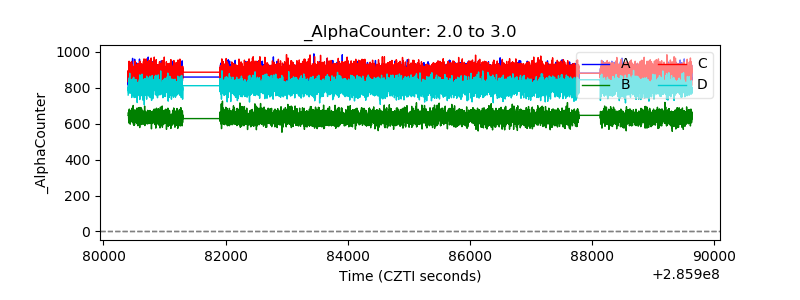 |
| _CPM_Rate | 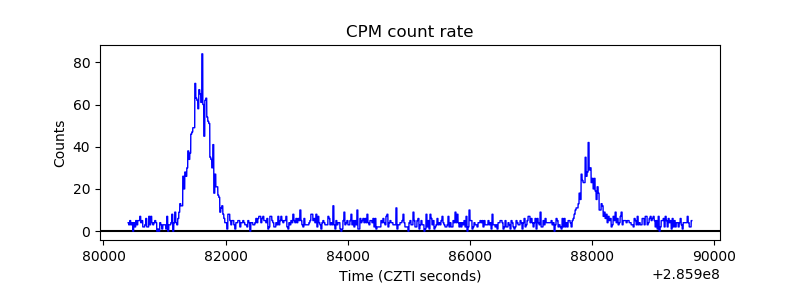 |
| CZT Counter | 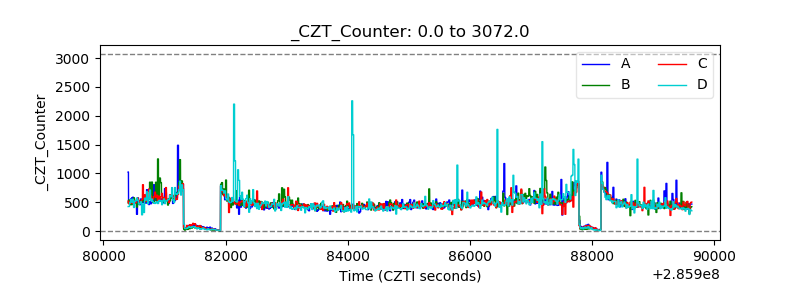 |
| +2.5 Volts monitor |  |
| +5 Volts monitor |  |
| _ROLL_ROT | 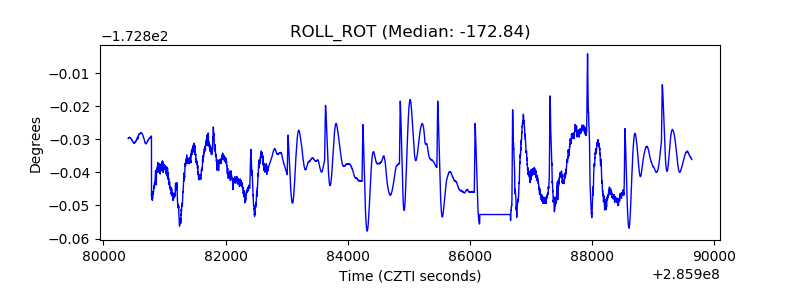 |
| _Roll_DEC | 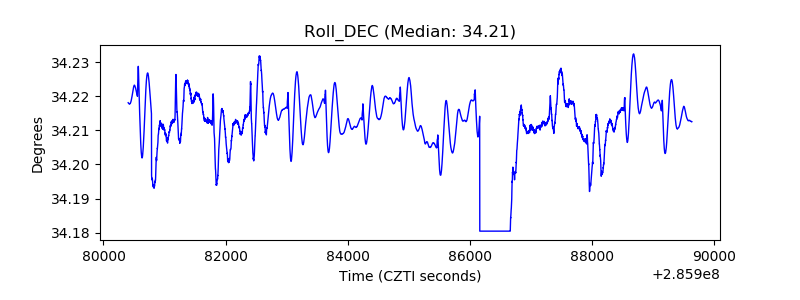 |
| _Roll_RA | 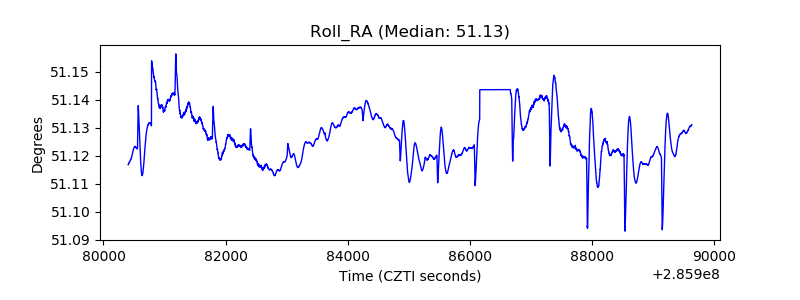 |
| Veto Counter | 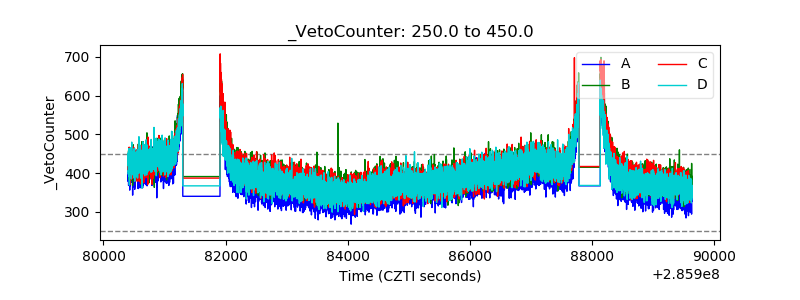 |