| Param | Original file | Final file |
|---|---|---|
| Filename | modeM0/AS1A05_019T01_9000002672_17968cztM0_level2.evt | modeM0/AS1A05_019T01_9000002672_17968cztM0_level2_quad_clean.evt |
| Size (bytes) | 598,426,560 | 107,919,360 |
| Size | 570.7 MB | 102.9 MB |
| Events in quadrant A | 4,578,837 | 673,919 |
| Events in quadrant B | 4,348,475 | 678,567 |
| Events in quadrant C | 4,302,715 | 655,936 |
| Events in quadrant D | 4,300,913 | 653,448 |
| Mode M0 | |||
|---|---|---|---|
| Quadrant | BADHDUFLAG | Total packets | Discarded packets |
| A | 0 | 19328 | 3 |
| B | 0 | 18647 | 3 |
| C | 0 | 18161 | 3 |
| D | 0 | 18864 | 3 |
| Mode M9 | |||
|---|---|---|---|
| Quadrant | BADHDUFLAG | Total packets | Discarded packets |
| A | 0 | 7 | 0 |
| B | 0 | 7 | 0 |
| C | 0 | 7 | 0 |
| D | 0 | 7 | 0 |
| Mode SS | |||
|---|---|---|---|
| Quadrant | BADHDUFLAG | Total packets | Discarded packets |
| A | 0 | 180 | 0 |
| B | 0 | 180 | 0 |
| C | 0 | 180 | 0 |
| D | 0 | 180 | 0 |
| Quadrant | Total seconds | Saturated seconds | Saturation percentage |
|---|---|---|---|
| A | 8727 | 187 | 2.142775% |
| B | 8727 | 170 | 1.947978% |
| C | 8727 | 142 | 1.627134% |
| D | 8728 | 87 | 0.996792% |
Noise dominated data is calculated using 1-second bins in cleaned event files. If a bin has >2000 counts, and if more than 50% of those come from <1% of pixels, then it is considered to be noise-dominated and hence unusable.
| Quadrant | # 1 sec bins | Bins with >0 counts | Bins with >2000 counts | High rate bins dominated by noise | Noise dominated (total time) | Noise dominated (detector-on time) | Marked lightcurve |
|---|---|---|---|---|---|---|---|
| A | 9457 | 8730 | 58 | 58 | 0.61% | 0.66% | 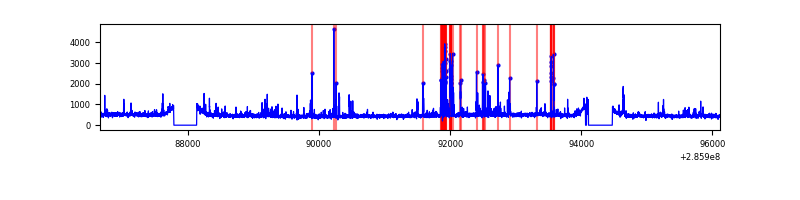 |
| B | 9457 | 8730 | 16 | 16 | 0.17% | 0.18% | 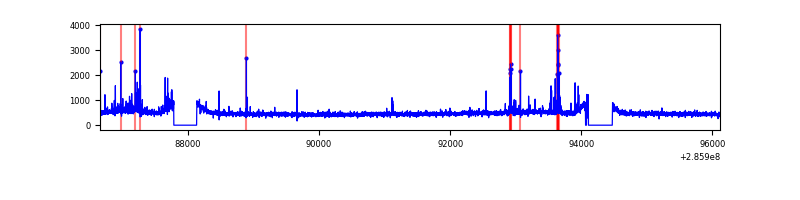 |
| C | 9457 | 8730 | 0 | 0 | 0.00% | 0.00% | 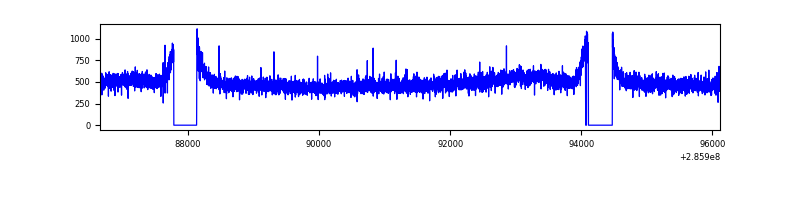 |
| D | 9458 | 8731 | 26 | 26 | 0.27% | 0.30% | 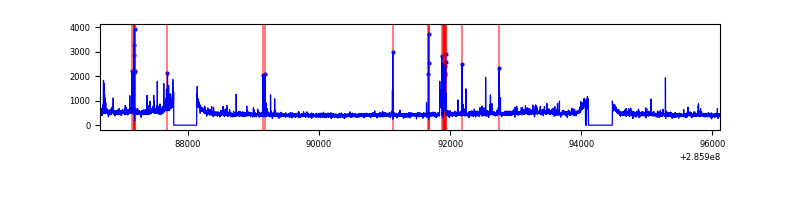 |
Top three noisy pixels from each quadrant. If the there are fewer than three noisy pixels in the level2.evt file, extra rows are filled as -1
| Pixel properties | Quadrant properties | ||||||
|---|---|---|---|---|---|---|---|
| Quadrant | DetID | PixID | Counts | Sigma | Mean | Median | Sigma |
| A | 14 | 237 | 430673 | 2003.4 | 1055 | 1029 | 214.5 |
| A | 15 | 174 | 90911 | 419.11 | 1055 | 1029 | 214.5 |
| A | 0 | 226 | 9271 | 38.43 | 1055 | 1029 | 214.5 |
| B | 0 | 197 | 90005 | 432.16 | 1056 | 1025 | 205.9 |
| B | 7 | 220 | 78793 | 377.7 | 1056 | 1025 | 205.9 |
| B | 12 | 111 | 24630 | 114.64 | 1056 | 1025 | 205.9 |
| C | 14 | 238 | 154412 | 634.09 | 1023 | 1030 | 241.9 |
| C | 3 | 233 | 135785 | 557.08 | 1023 | 1030 | 241.9 |
| C | 8 | 128 | 12842 | 48.83 | 1023 | 1030 | 241.9 |
| D | 12 | 233 | 86174 | 334.55 | 1039 | 1009 | 254.6 |
| D | 5 | 222 | 71864 | 278.33 | 1039 | 1009 | 254.6 |
| D | 2 | 33 | 71434 | 276.65 | 1039 | 1009 | 254.6 |
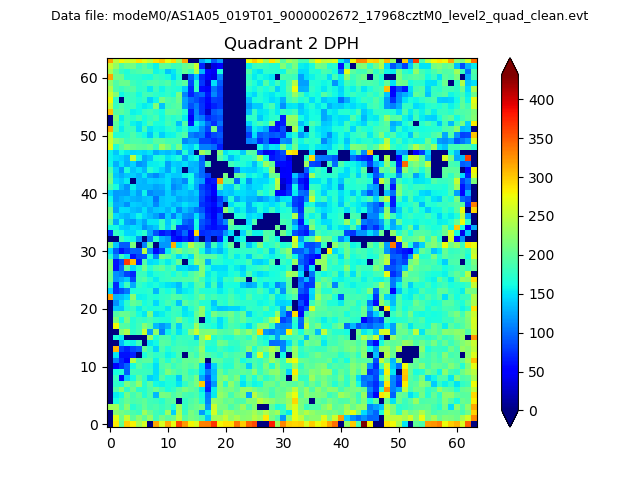
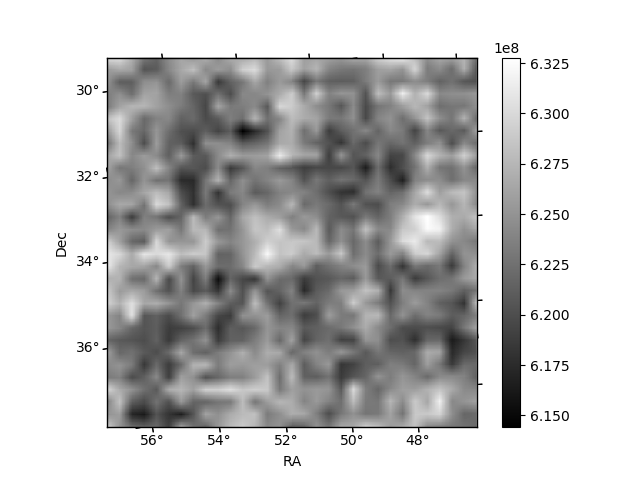
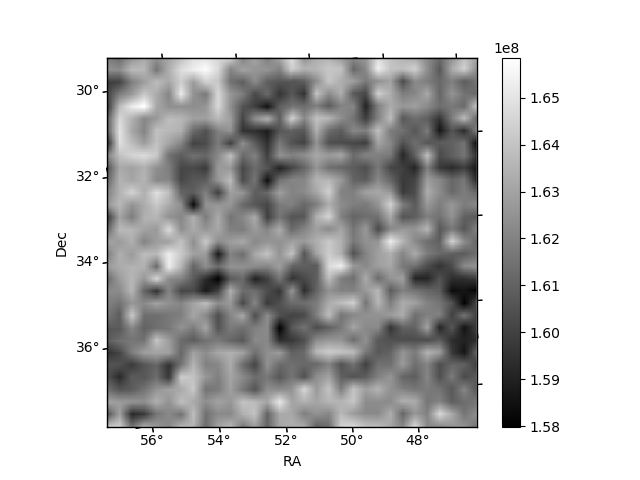
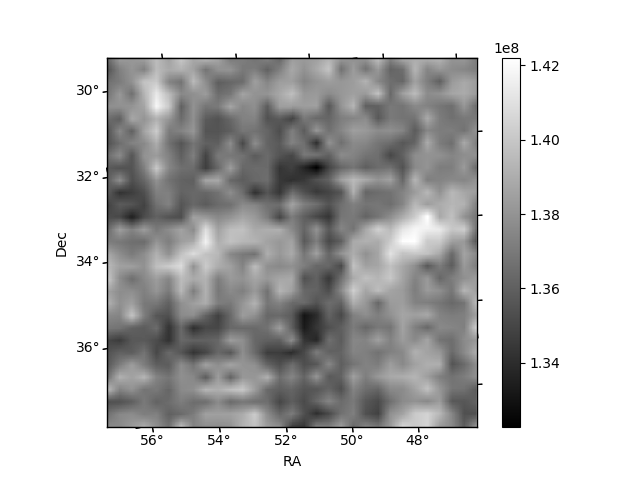
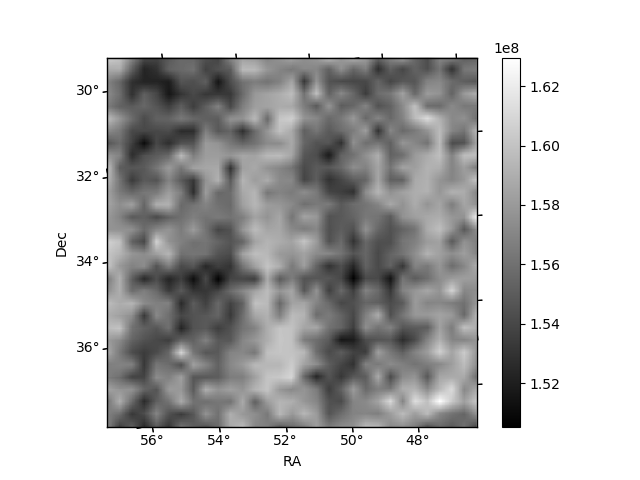
Histogram calculated using DETX and DETY for each event in the final _common_clean file
| Quadrant A | 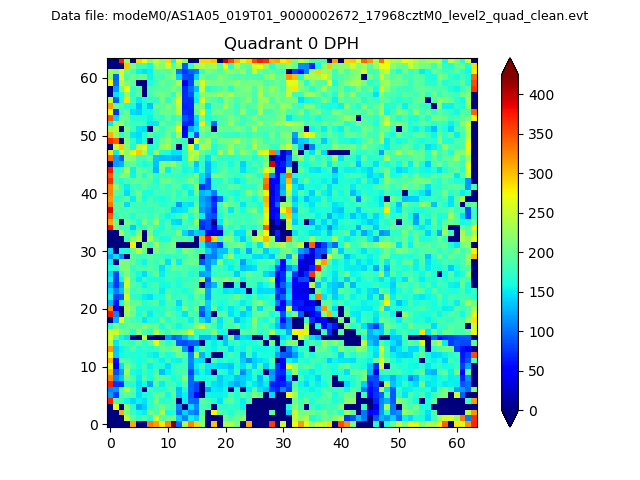 |
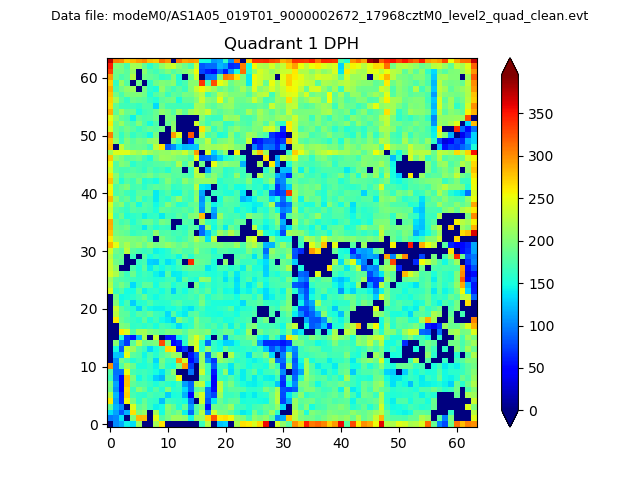 |
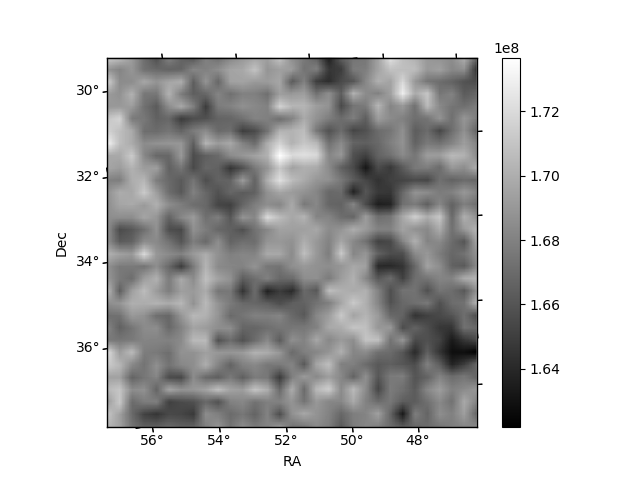
Quadrant B |
|---|---|---|---|
| Quadrant D | 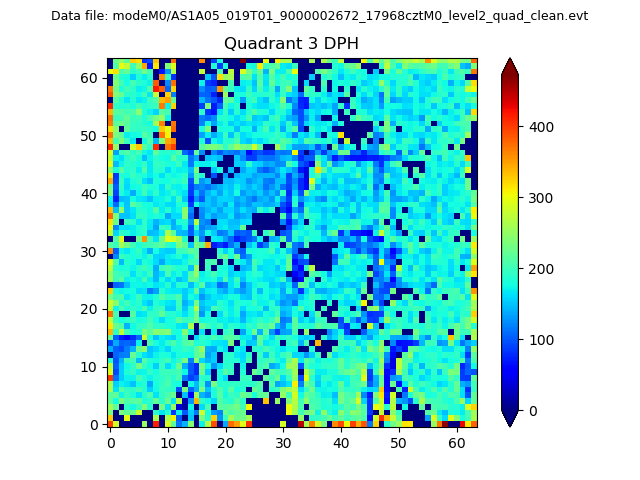 |
 |
Quadrant C |
| Plot type | Count rate plots | Images |
|---|---|---|
| Comparison with Poisson distribution Blue bars denote a histogram of data divided into 1 sec bins. Red curve is a Poisson curve with rate = median count rate of data. |
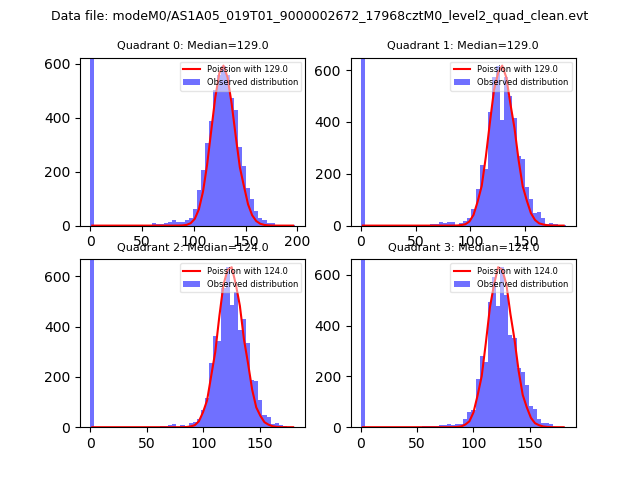 |
 |
| Quadrant-wise count rates Data is divided into 100 sec bins |
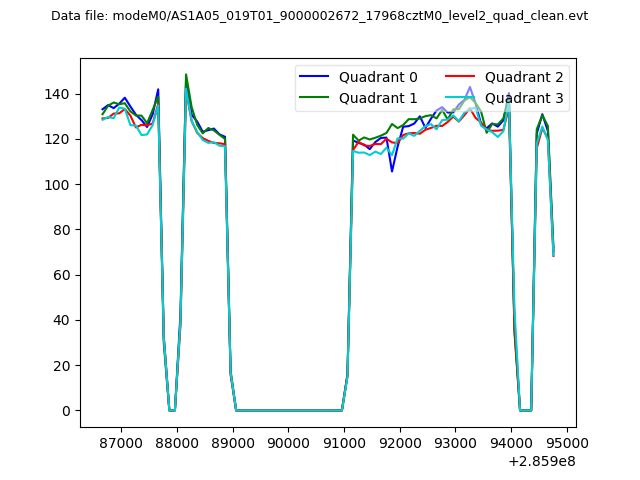 |
|
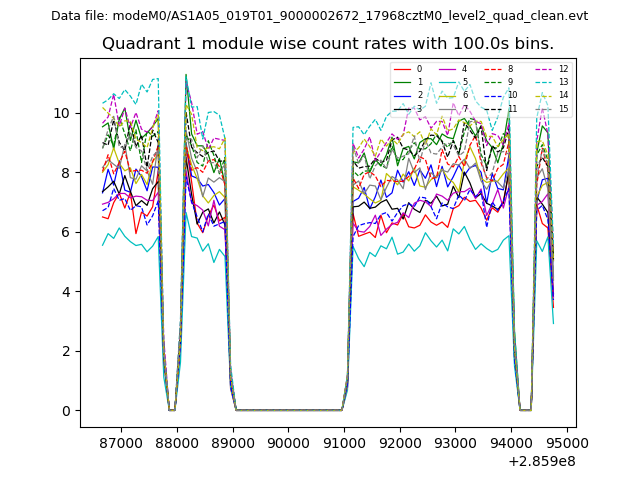
| Module-wise count rates for Quadrant A Data is divided into 100 sec bins |
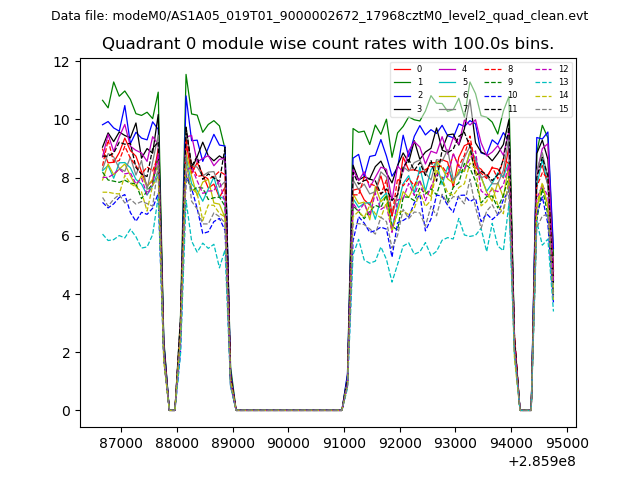 |
 |
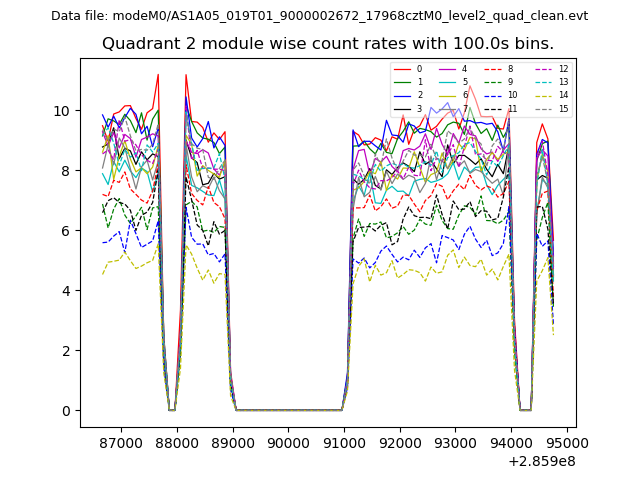
| Module-wise count rates for Quadrant B Data is divided into 100 sec bins |
 |
 |
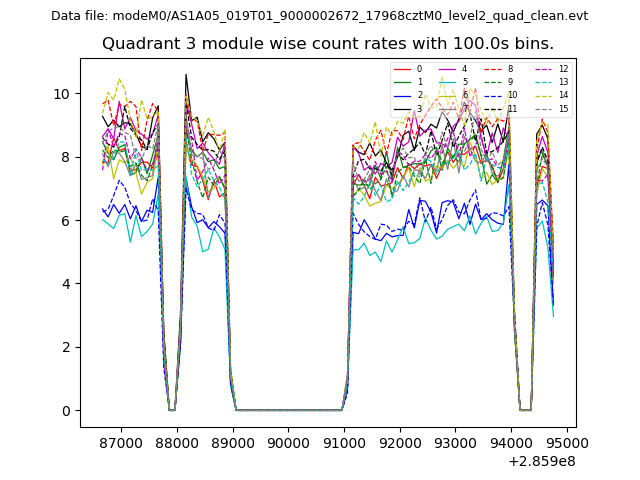
| Module-wise count rates for Quadrant C Data is divided into 100 sec bins |
 |
 |
| Module-wise count rates for Quadrant D Data is divided into 100 sec bins |
 |
 |
| Parameter | Plot |
|---|---|
| CZT HV Monitor | 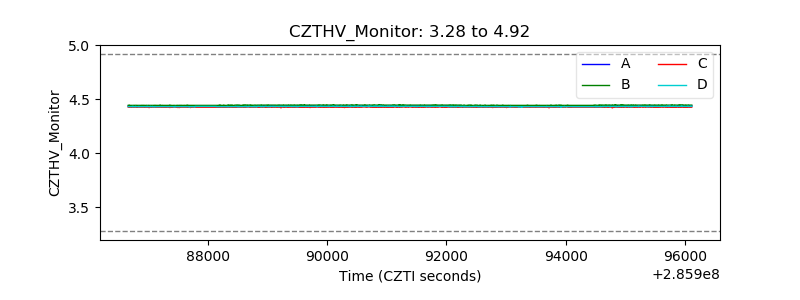 |
| D_VDD |  |
| Temperature 1 | 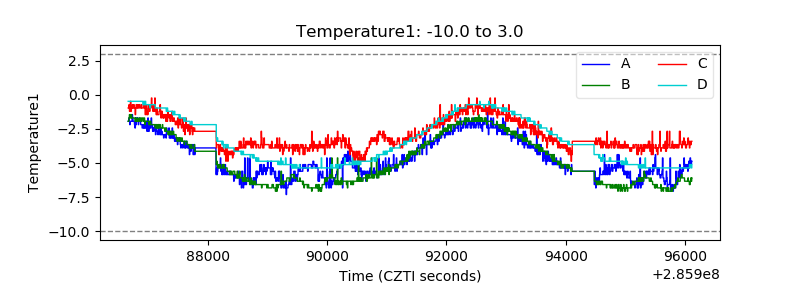 |
| Veto HV Monitor | 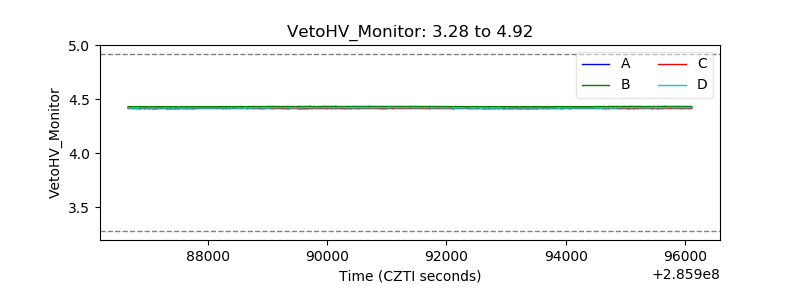 |
| Veto LLD | 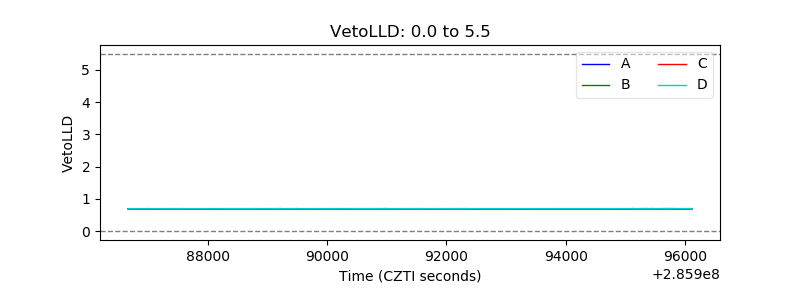 |
| Alpha Counter | 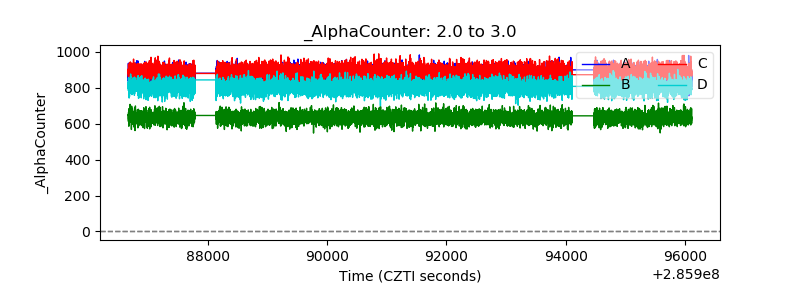 |
| _CPM_Rate | 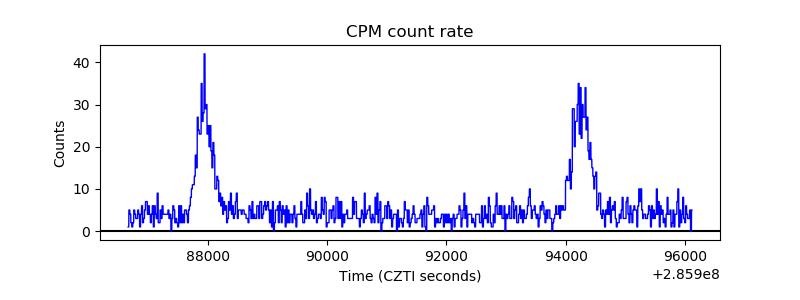 |
| CZT Counter | 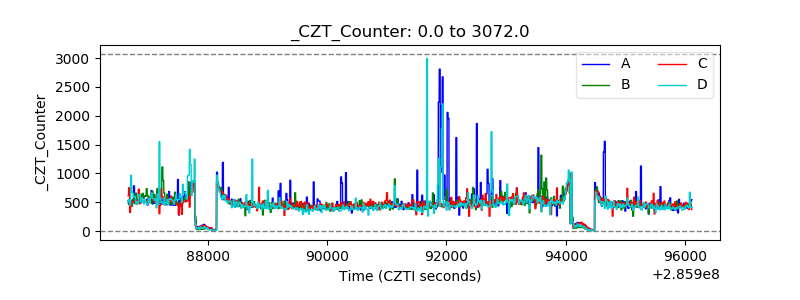 |
| +2.5 Volts monitor |  |
| +5 Volts monitor |  |
| _ROLL_ROT | 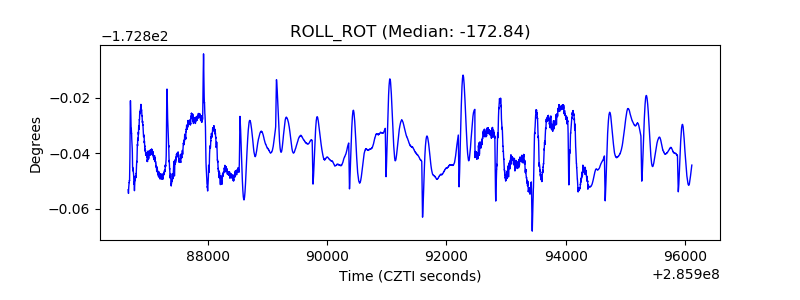 |
| _Roll_DEC | 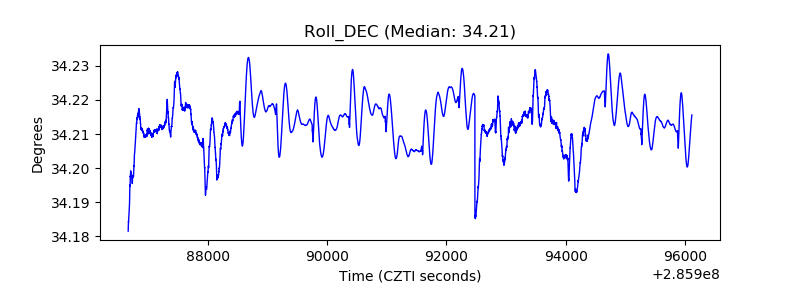 |
| _Roll_RA | 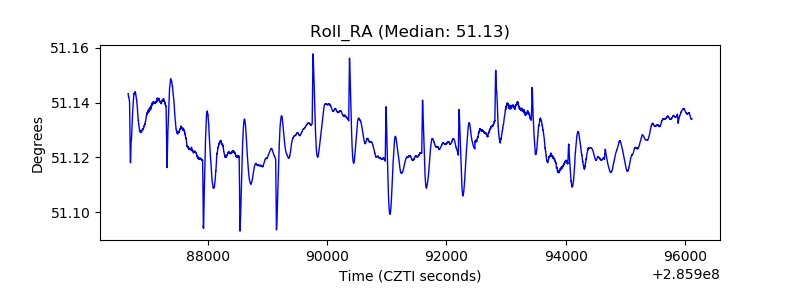 |
| Veto Counter | 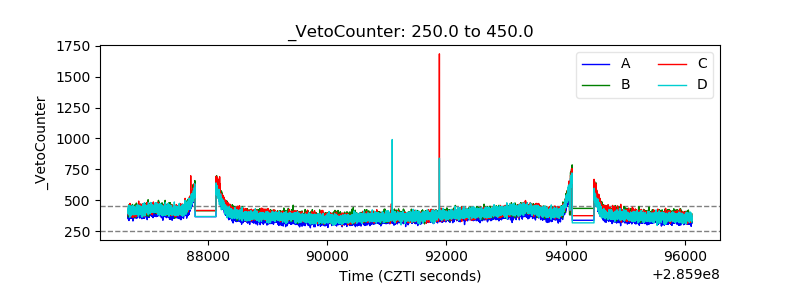 |