| Param | Original file | Final file |
|---|---|---|
| Filename | modeM0/AS1A05_019T01_9000002672_17971cztM0_level2.evt | modeM0/AS1A05_019T01_9000002672_17971cztM0_level2_quad_clean.evt |
| Size (bytes) | 1,366,038,720 | 217,327,680 |
| Size | 1.3 GB | 207.3 MB |
| Events in quadrant A | 10,773,016 | 1,347,830 |
| Events in quadrant B | 8,824,621 | 1,374,179 |
| Events in quadrant C | 9,059,186 | 1,319,518 |
| Events in quadrant D | 11,478,319 | 1,280,245 |
| Mode M0 | |||
|---|---|---|---|
| Quadrant | BADHDUFLAG | Total packets | Discarded packets |
| A | 0 | 43965 | 3 |
| B | 0 | 37911 | 3 |
| C | 0 | 37829 | 3 |
| D | 0 | 46969 | 3 |
| Mode M9 | |||
|---|---|---|---|
| Quadrant | BADHDUFLAG | Total packets | Discarded packets |
| A | 0 | 19 | 0 |
| B | 0 | 19 | 0 |
| C | 0 | 19 | 0 |
| D | 0 | 19 | 0 |
| Mode SS | |||
|---|---|---|---|
| Quadrant | BADHDUFLAG | Total packets | Discarded packets |
| A | 0 | 372 | 0 |
| B | 0 | 372 | 0 |
| C | 0 | 372 | 0 |
| D | 0 | 372 | 0 |
| Quadrant | Total seconds | Saturated seconds | Saturation percentage |
|---|---|---|---|
| A | 18281 | 743 | 4.064329% |
| B | 18282 | 229 | 1.252598% |
| C | 18282 | 238 | 1.301827% |
| D | 18282 | 880 | 4.813478% |
Noise dominated data is calculated using 1-second bins in cleaned event files. If a bin has >2000 counts, and if more than 50% of those come from <1% of pixels, then it is considered to be noise-dominated and hence unusable.
| Quadrant | # 1 sec bins | Bins with >0 counts | Bins with >2000 counts | High rate bins dominated by noise | Noise dominated (total time) | Noise dominated (detector-on time) | Marked lightcurve |
|---|---|---|---|---|---|---|---|
| A | 20176 | 18283 | 420 | 420 | 2.08% | 2.30% | 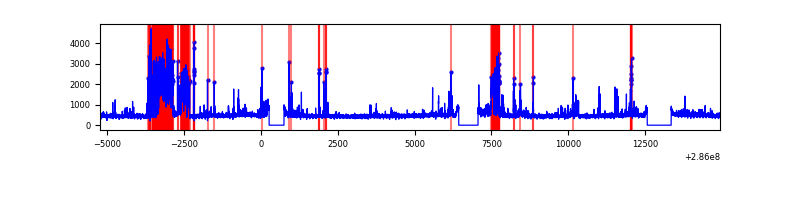 |
| B | 20177 | 18284 | 8 | 8 | 0.04% | 0.04% |  |
| C | 20177 | 18284 | 0 | 0 | 0.00% | 0.00% | 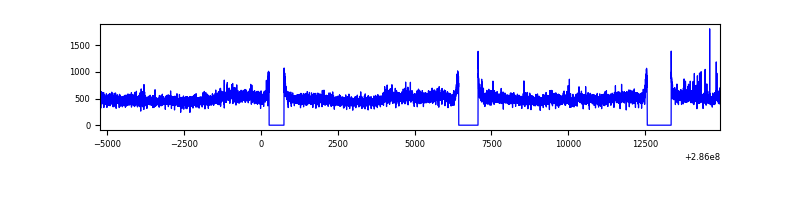 |
| D | 20177 | 18285 | 588 | 588 | 2.91% | 3.22% | 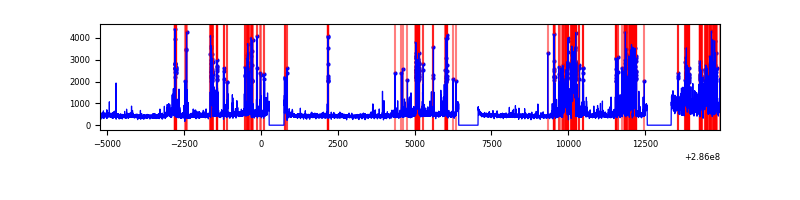 |
Top three noisy pixels from each quadrant. If the there are fewer than three noisy pixels in the level2.evt file, extra rows are filled as -1
| Pixel properties | Quadrant properties | ||||||
|---|---|---|---|---|---|---|---|
| Quadrant | DetID | PixID | Counts | Sigma | Mean | Median | Sigma |
| A | 15 | 174 | 2111053 | 4820.63 | 2163 | 2111 | 437.5 |
| A | 14 | 237 | 354455 | 805.39 | 2163 | 2111 | 437.5 |
| A | 0 | 226 | 18883 | 38.34 | 2163 | 2111 | 437.5 |
| B | 0 | 85 | 91253 | 214.97 | 2181 | 2119 | 414.6 |
| B | 0 | 197 | 85023 | 199.94 | 2181 | 2119 | 414.6 |
| B | 12 | 111 | 51188 | 118.34 | 2181 | 2119 | 414.6 |
| C | 3 | 233 | 501084 | 1017.2 | 2097 | 2108 | 490.5 |
| C | 14 | 238 | 321372 | 650.85 | 2097 | 2108 | 490.5 |
| C | 9 | 160 | 19384 | 35.22 | 2097 | 2108 | 490.5 |
| D | 5 | 222 | 1334481 | 2603.55 | 2101 | 2036 | 511.8 |
| D | 7 | 238 | 1141662 | 2226.79 | 2101 | 2036 | 511.8 |
| D | 7 | 38 | 461622 | 898.01 | 2101 | 2036 | 511.8 |
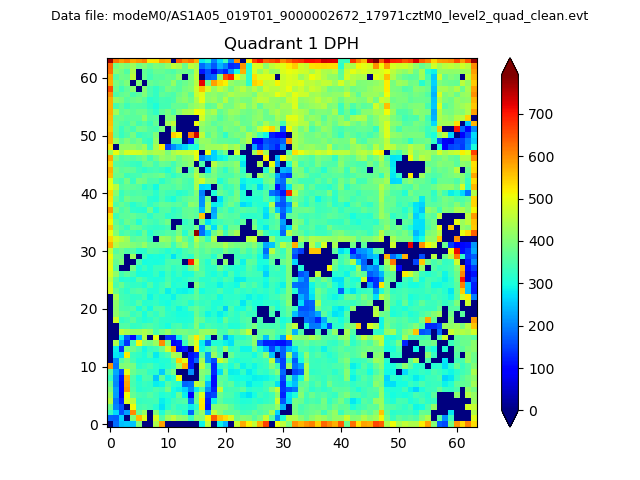
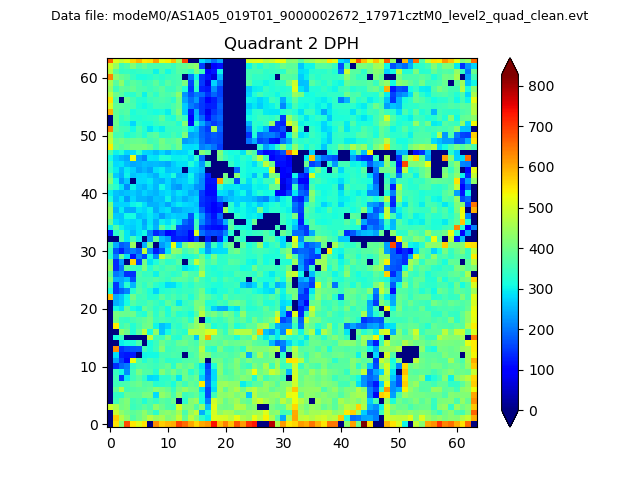
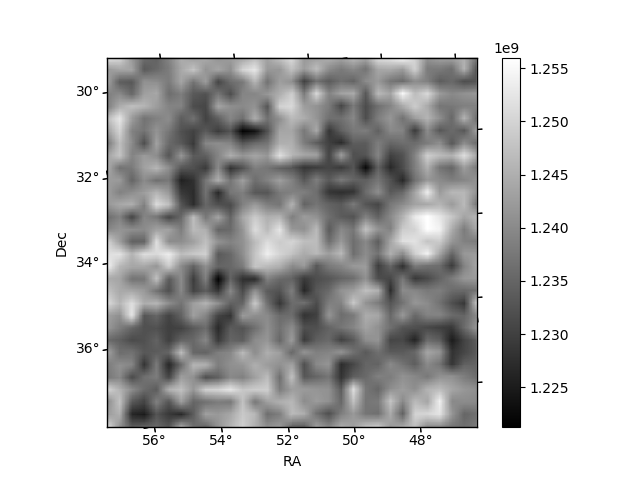
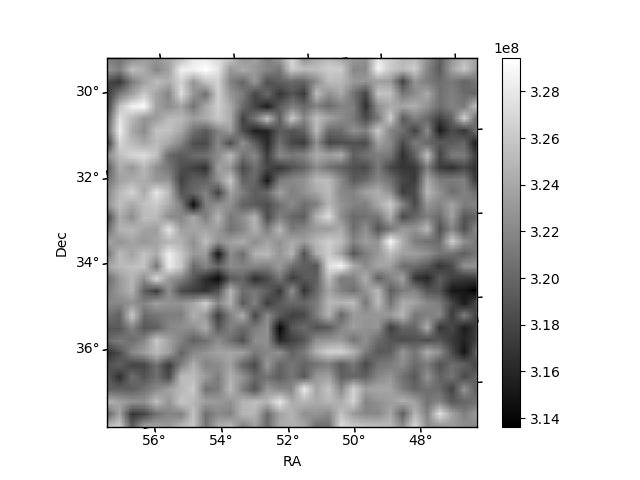
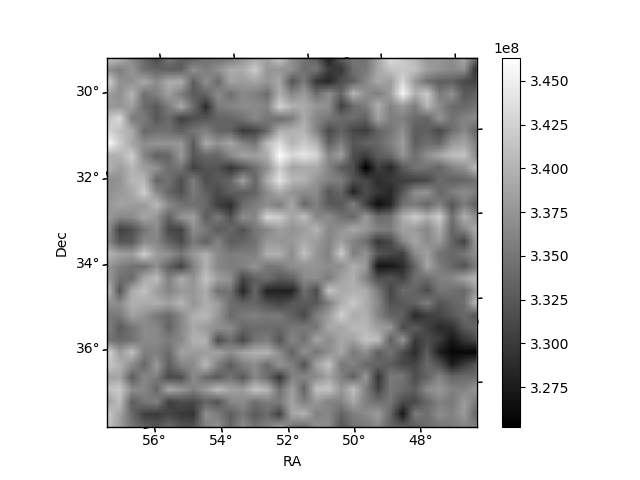
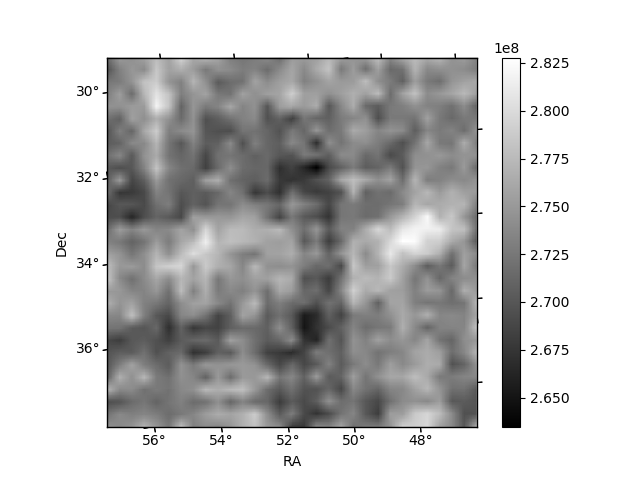
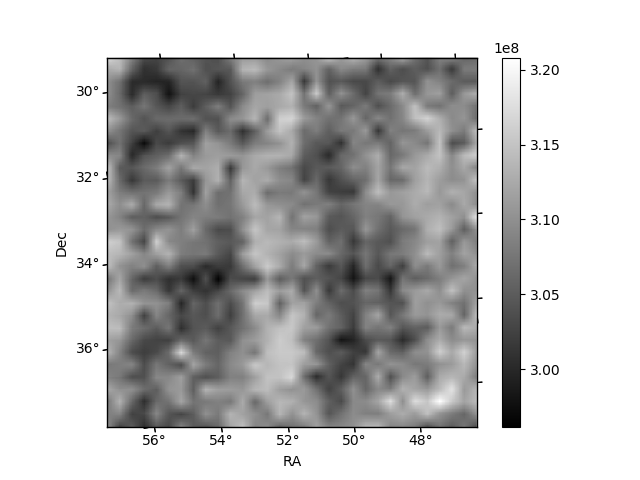
Histogram calculated using DETX and DETY for each event in the final _common_clean file
| Quadrant A | 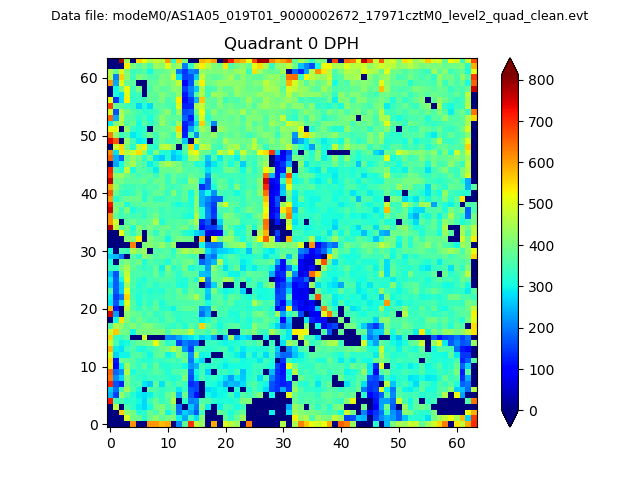 |
 |
Quadrant B |
|---|---|---|---|
| Quadrant D | 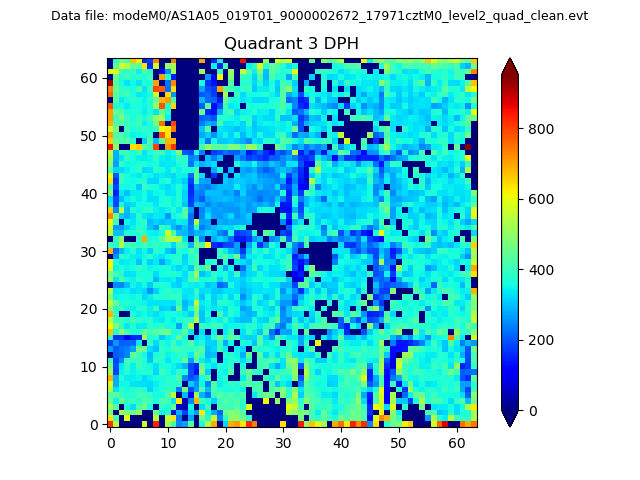 |
 |
Quadrant C |
| Plot type | Count rate plots | Images |
|---|---|---|
| Comparison with Poisson distribution Blue bars denote a histogram of data divided into 1 sec bins. Red curve is a Poisson curve with rate = median count rate of data. |
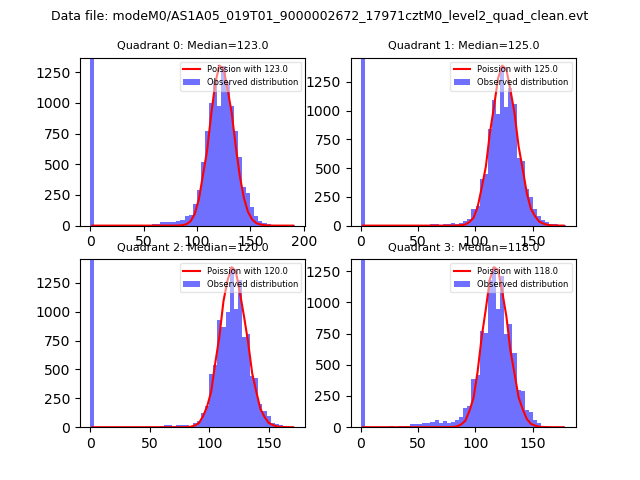 |
 |
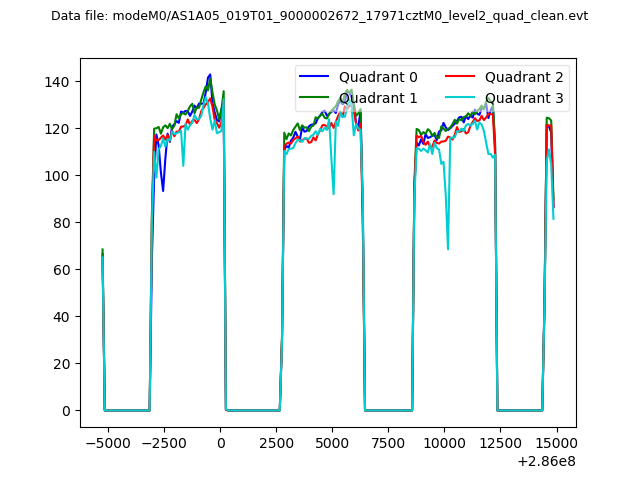
| Quadrant-wise count rates Data is divided into 100 sec bins |
 |
|
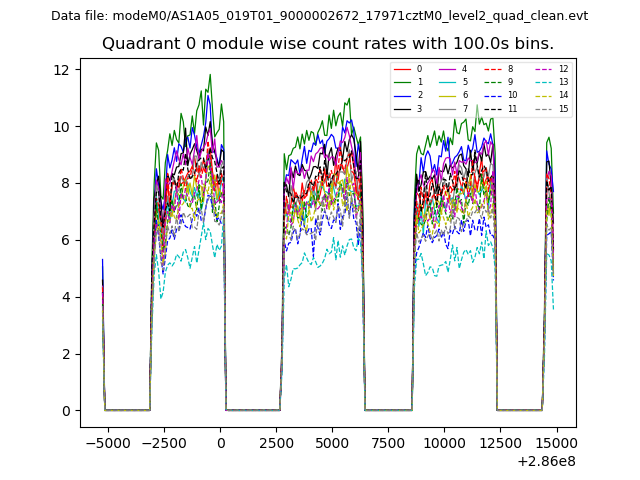
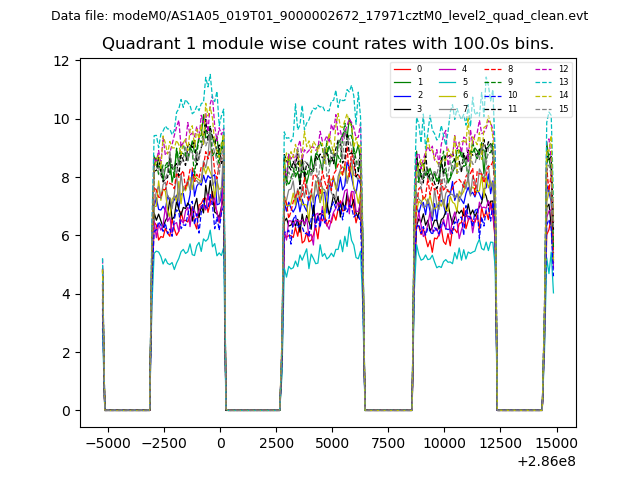
| Module-wise count rates for Quadrant A Data is divided into 100 sec bins |
 |
 |
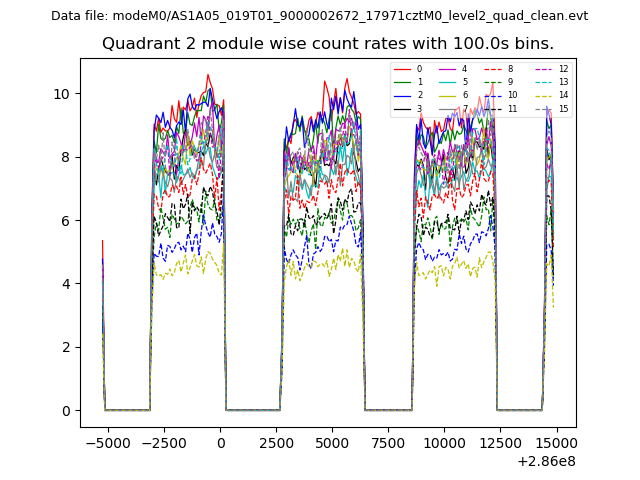
| Module-wise count rates for Quadrant B Data is divided into 100 sec bins |
 |
 |
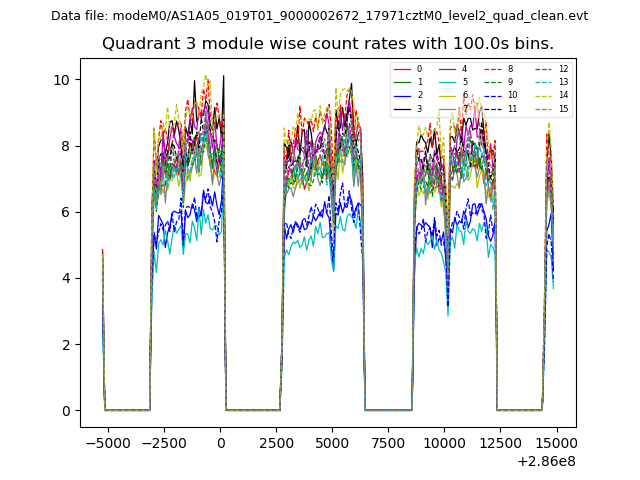
| Module-wise count rates for Quadrant C Data is divided into 100 sec bins |
 |
 |
| Module-wise count rates for Quadrant D Data is divided into 100 sec bins |
 |
 |
| Parameter | Plot |
|---|---|
| CZT HV Monitor | 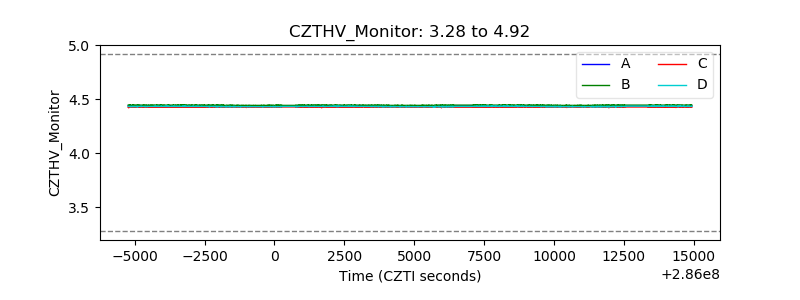 |
| D_VDD | 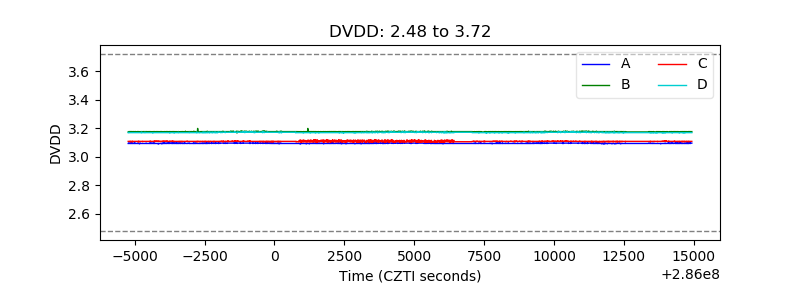 |
| Temperature 1 | 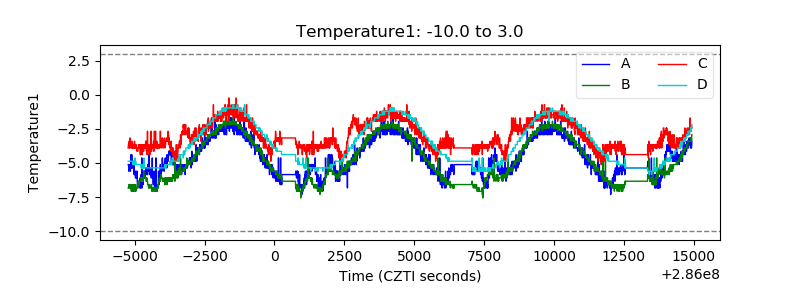 |
| Veto HV Monitor |  |
| Veto LLD | 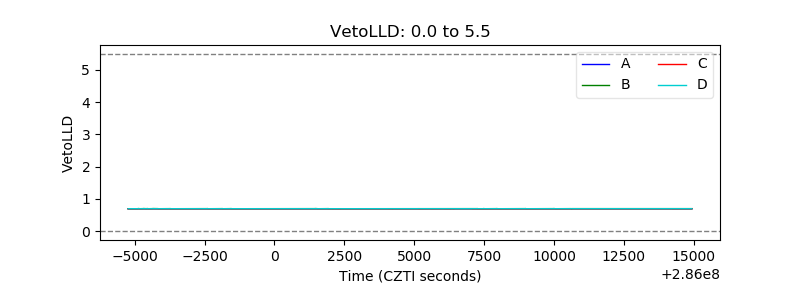 |
| Alpha Counter | 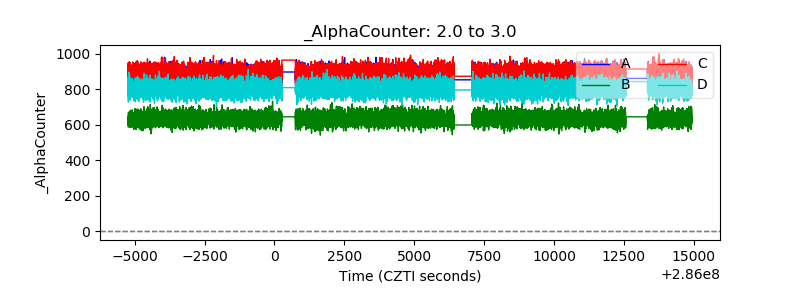 |
| _CPM_Rate | 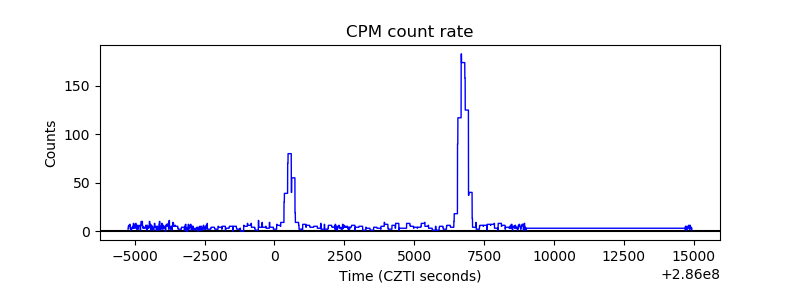 |
| CZT Counter | 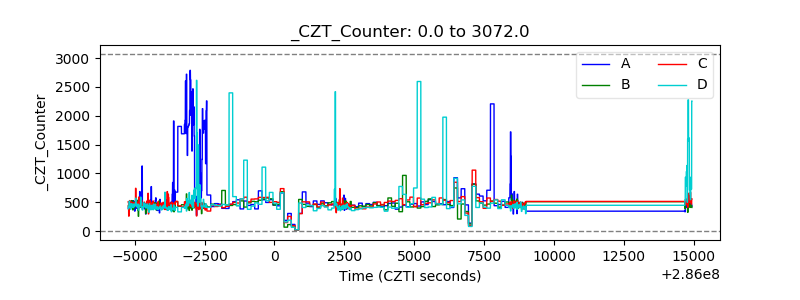 |
| +2.5 Volts monitor |  |
| +5 Volts monitor | 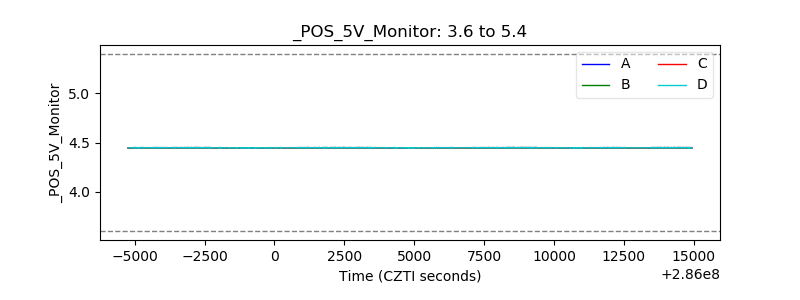 |
| _ROLL_ROT | 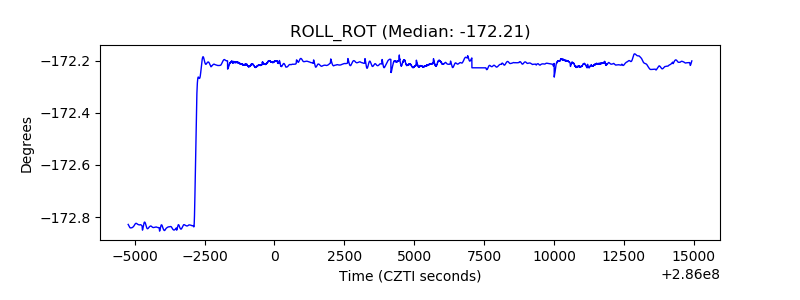 |
| _Roll_DEC |  |
| _Roll_RA | 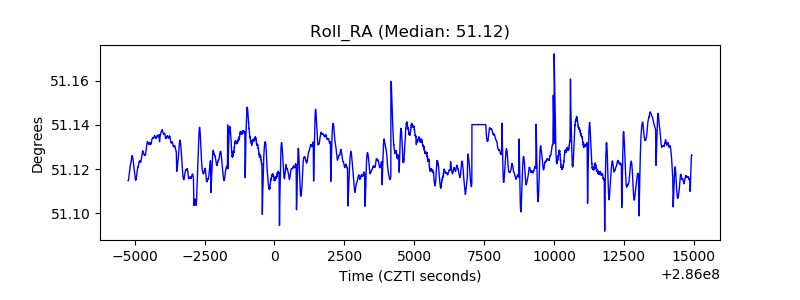 |
| Veto Counter | 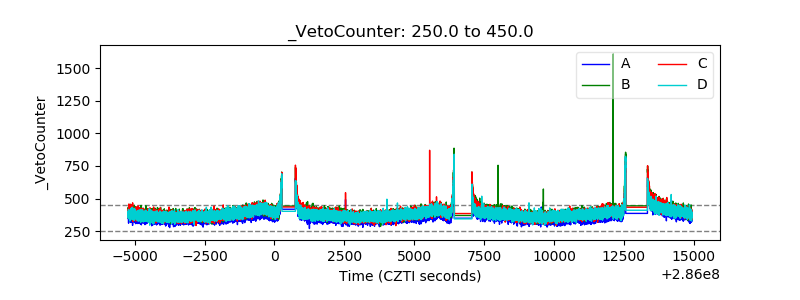 |