| Param | Original file | Final file |
|---|---|---|
| Filename | modeM0/AS1A05_019T01_9000002672_17975cztM0_level2.evt | modeM0/AS1A05_019T01_9000002672_17975cztM0_level2_quad_clean.evt |
| Size (bytes) | 474,675,840 | 105,894,720 |
| Size | 452.7 MB | 101.0 MB |
| Events in quadrant A | 3,238,209 | 713,610 |
| Events in quadrant B | 3,393,074 | 716,243 |
| Events in quadrant C | 3,288,588 | 669,310 |
| Events in quadrant D | 4,027,560 | 667,913 |
| Mode M0 | |||
|---|---|---|---|
| Quadrant | BADHDUFLAG | Total packets | Discarded packets |
| A | 0 | 13819 | 2 |
| B | 0 | 14134 | 2 |
| C | 0 | 13732 | 2 |
| D | 0 | 16170 | 2 |
| Mode M9 | |||
|---|---|---|---|
| Quadrant | BADHDUFLAG | Total packets | Discarded packets |
| A | 0 | 13 | 0 |
| B | 0 | 14 | 0 |
| C | 0 | 14 | 0 |
| D | 0 | 14 | 0 |
| Mode SS | |||
|---|---|---|---|
| Quadrant | BADHDUFLAG | Total packets | Discarded packets |
| A | 0 | 128 | 0 |
| B | 0 | 128 | 0 |
| C | 0 | 128 | 0 |
| D | 0 | 128 | 0 |
| Quadrant | Total seconds | Saturated seconds | Saturation percentage |
|---|---|---|---|
| A | 6307 | 62 | 0.983035% |
| B | 6307 | 78 | 1.236721% |
| C | 6307 | 115 | 1.823371% |
| D | 6307 | 199 | 3.155224% |
Noise dominated data is calculated using 1-second bins in cleaned event files. If a bin has >2000 counts, and if more than 50% of those come from <1% of pixels, then it is considered to be noise-dominated and hence unusable.
| Quadrant | # 1 sec bins | Bins with >0 counts | Bins with >2000 counts | High rate bins dominated by noise | Noise dominated (total time) | Noise dominated (detector-on time) | Marked lightcurve |
|---|---|---|---|---|---|---|---|
| A | 7502 | 6308 | 0 | 0 | 0.00% | 0.00% | 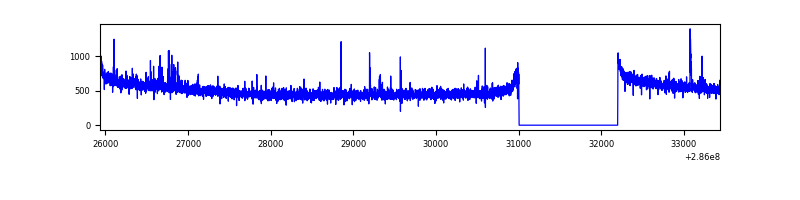 |
| B | 7502 | 6308 | 17 | 17 | 0.23% | 0.27% | 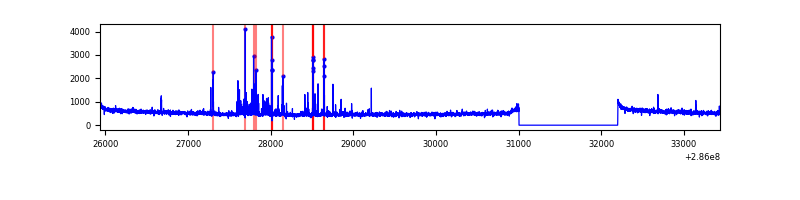 |
| C | 7502 | 6308 | 15 | 15 | 0.20% | 0.24% | 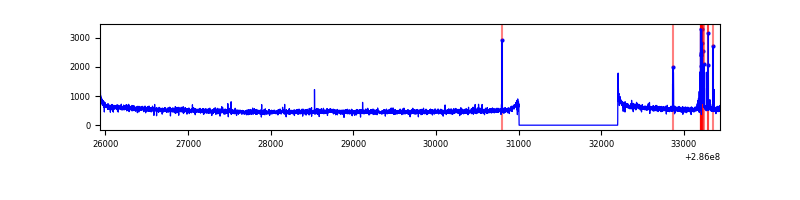 |
| D | 7502 | 6308 | 121 | 121 | 1.61% | 1.92% | 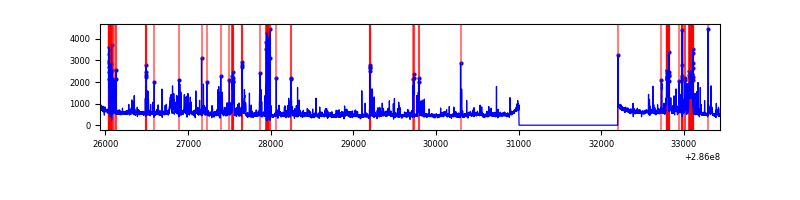 |
Top three noisy pixels from each quadrant. If the there are fewer than three noisy pixels in the level2.evt file, extra rows are filled as -1
| Pixel properties | Quadrant properties | ||||||
|---|---|---|---|---|---|---|---|
| Quadrant | DetID | PixID | Counts | Sigma | Mean | Median | Sigma |
| A | 15 | 174 | 29107 | 169.91 | 827 | 811 | 166.5 |
| A | 14 | 237 | 17688 | 101.34 | 827 | 811 | 166.5 |
| A | 0 | 226 | 7294 | 38.93 | 827 | 811 | 166.5 |
| B | 7 | 220 | 133446 | 865.04 | 815 | 796 | 153.3 |
| B | 4 | 216 | 18619 | 116.23 | 815 | 796 | 153.3 |
| B | 12 | 111 | 17694 | 110.2 | 815 | 796 | 153.3 |
| C | 14 | 238 | 121145 | 671.41 | 772 | 777 | 179.3 |
| C | 0 | 207 | 77421 | 427.52 | 772 | 777 | 179.3 |
| C | 3 | 233 | 63543 | 350.11 | 772 | 777 | 179.3 |
| D | 11 | 176 | 498052 | 2374.11 | 788 | 770 | 209.5 |
| D | 5 | 222 | 269185 | 1281.46 | 788 | 770 | 209.5 |
| D | 7 | 38 | 81869 | 387.18 | 788 | 770 | 209.5 |
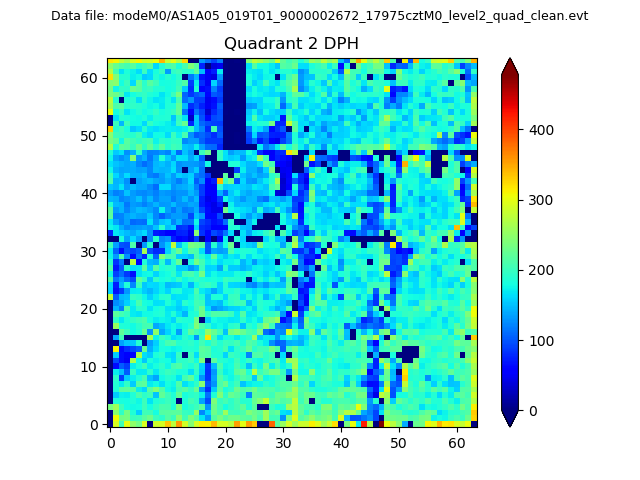
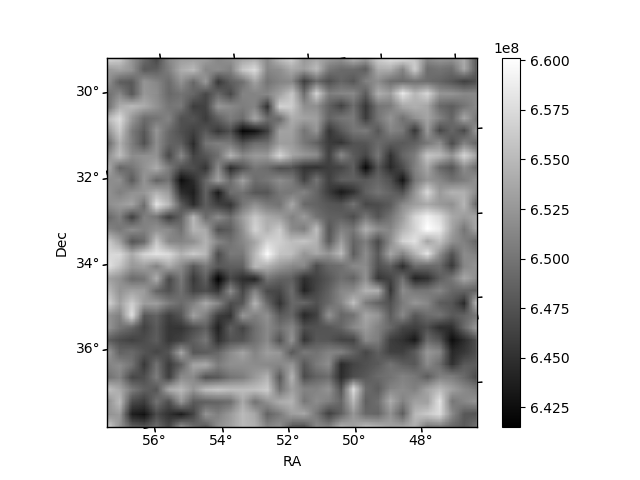
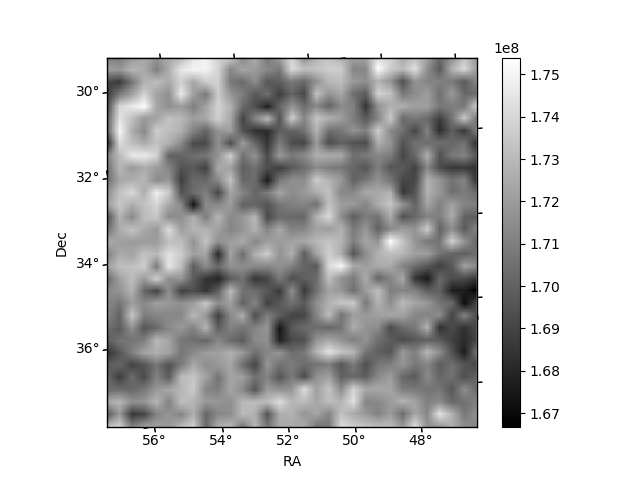
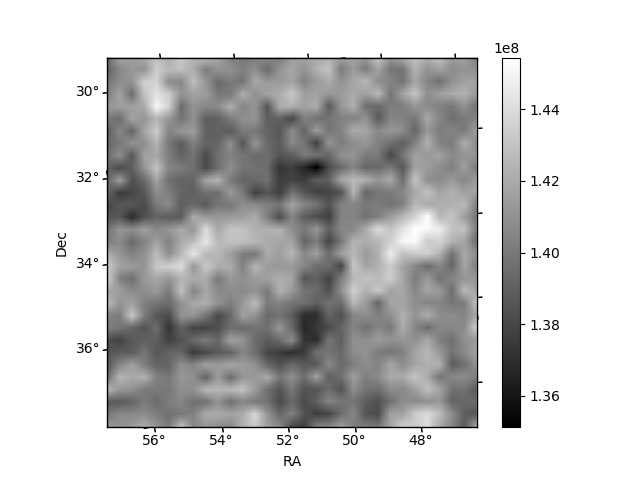
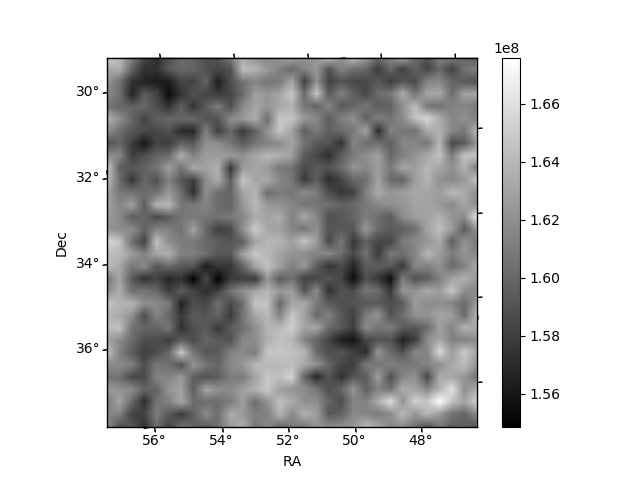
Histogram calculated using DETX and DETY for each event in the final _common_clean file
| Quadrant A | 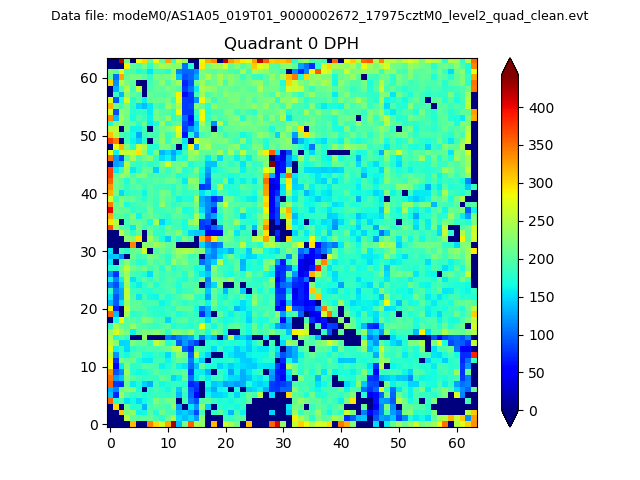 |
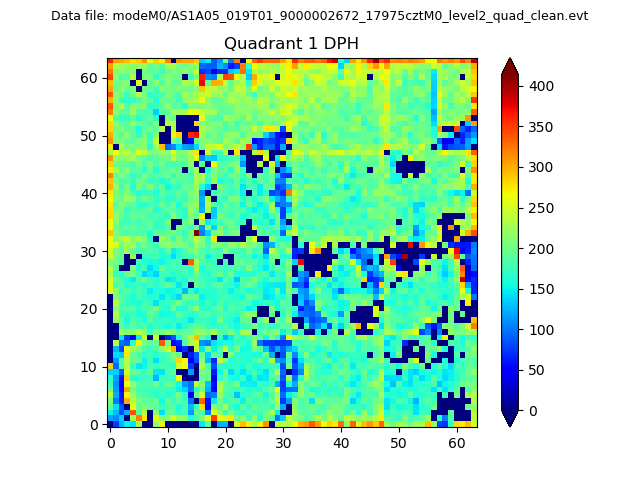 |
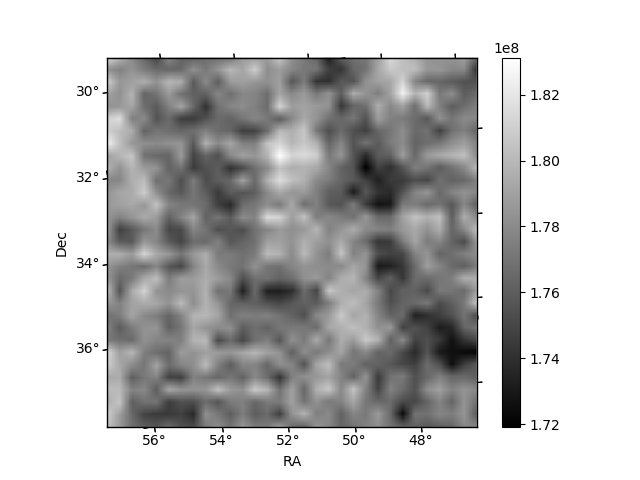
Quadrant B |
|---|---|---|---|
| Quadrant D | 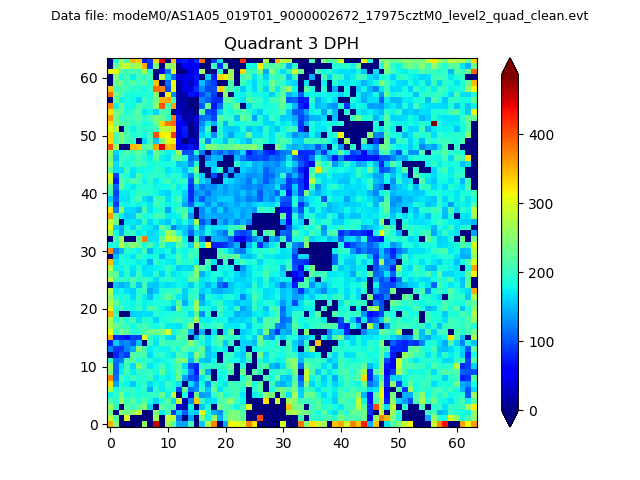 |
 |
Quadrant C |
| Plot type | Count rate plots | Images |
|---|---|---|
| Comparison with Poisson distribution Blue bars denote a histogram of data divided into 1 sec bins. Red curve is a Poisson curve with rate = median count rate of data. |
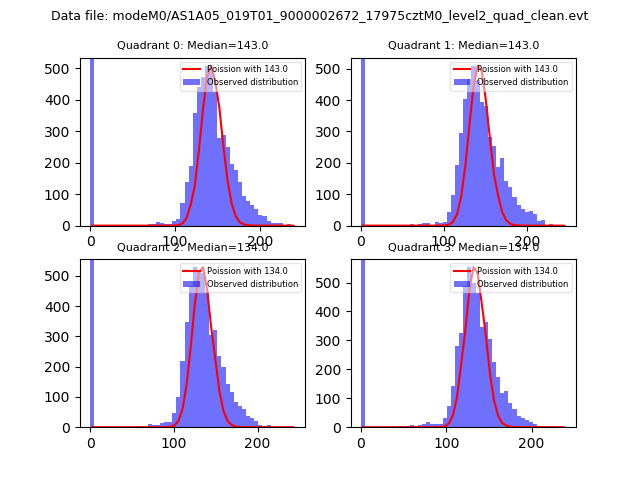 |
 |
| Quadrant-wise count rates Data is divided into 100 sec bins |
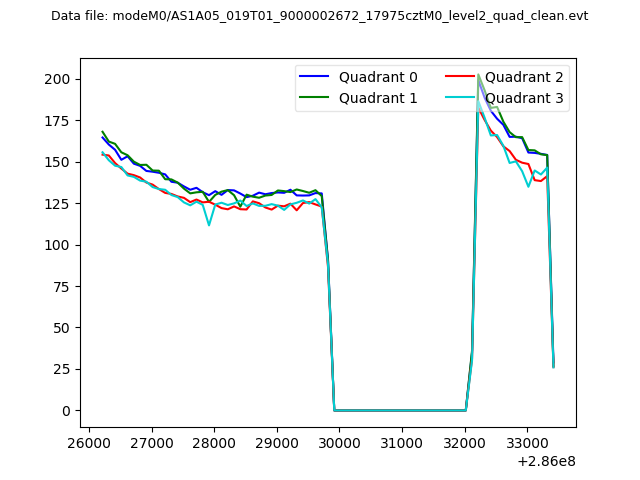 |
|
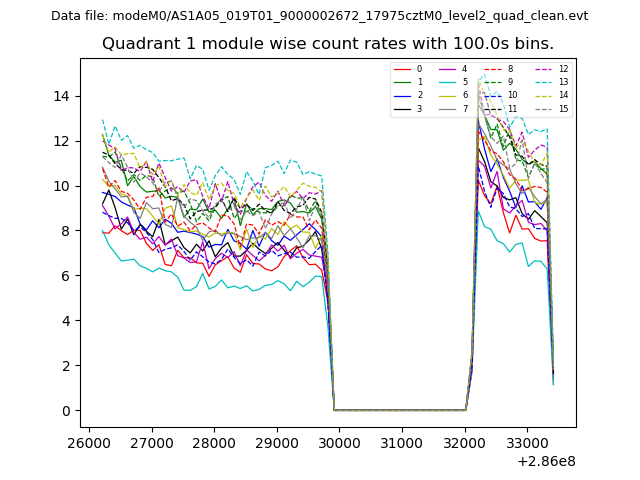
| Module-wise count rates for Quadrant A Data is divided into 100 sec bins |
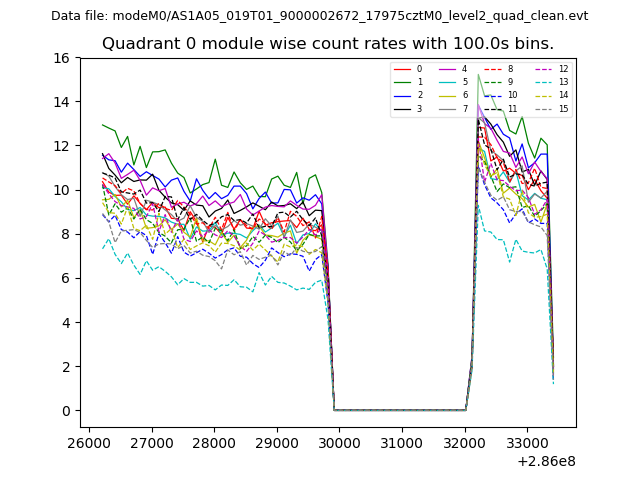 |
 |
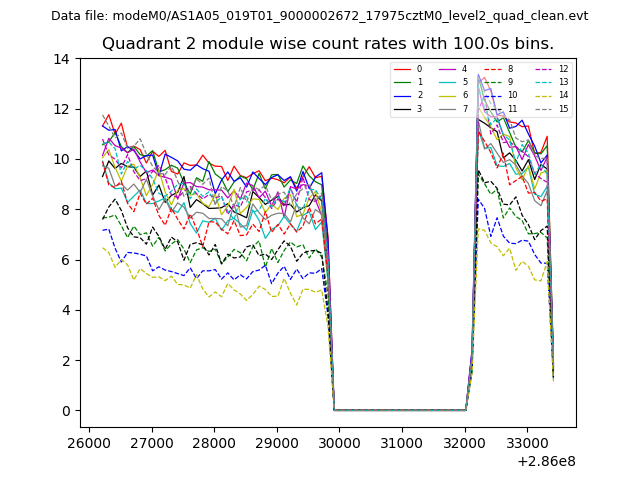
| Module-wise count rates for Quadrant B Data is divided into 100 sec bins |
 |
 |
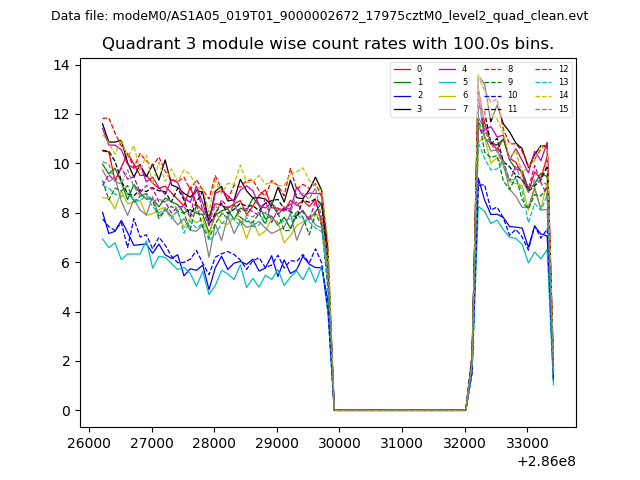
| Module-wise count rates for Quadrant C Data is divided into 100 sec bins |
 |
 |
| Module-wise count rates for Quadrant D Data is divided into 100 sec bins |
 |
 |
| Parameter | Plot |
|---|---|
| CZT HV Monitor | 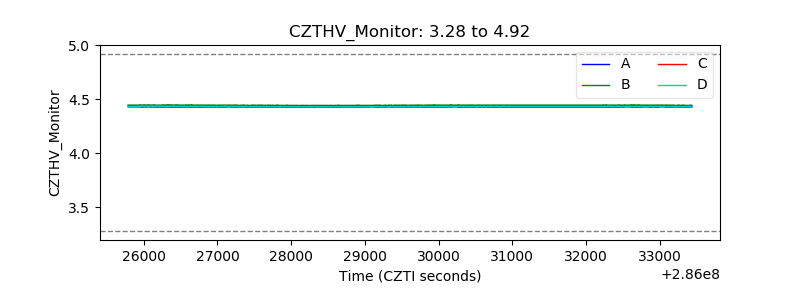 |
| D_VDD | 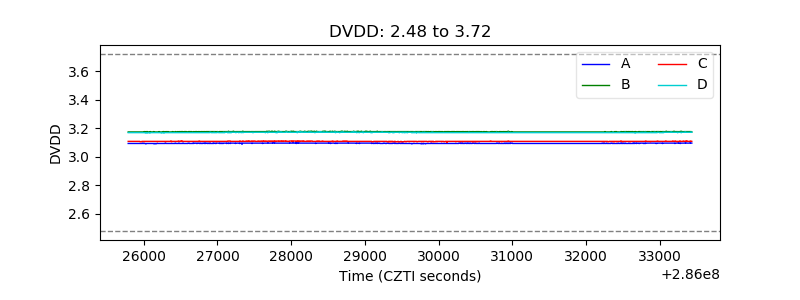 |
| Temperature 1 | 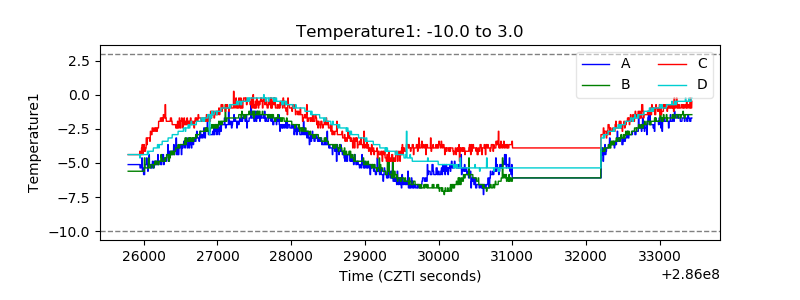 |
| Veto HV Monitor | 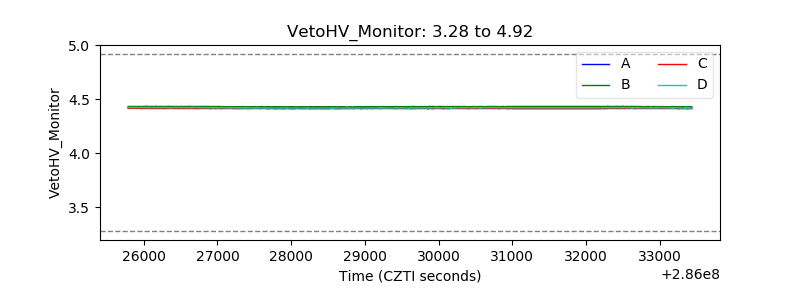 |
| Veto LLD | 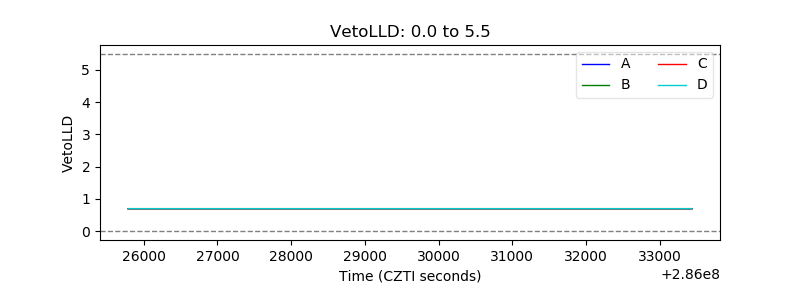 |
| Alpha Counter | 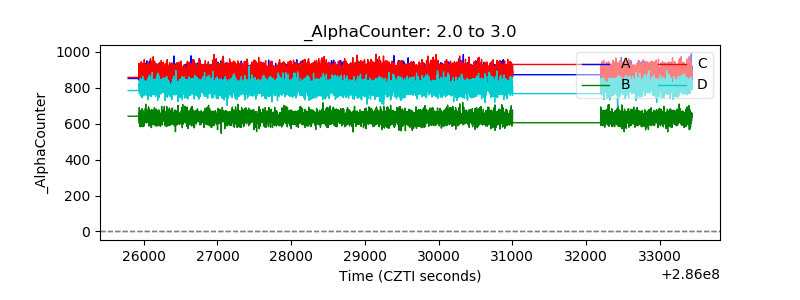 |
| _CPM_Rate |  |
| CZT Counter | 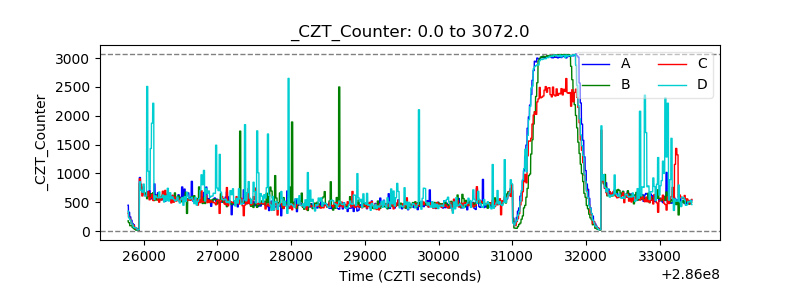 |
| +2.5 Volts monitor |  |
| +5 Volts monitor |  |
| _ROLL_ROT | 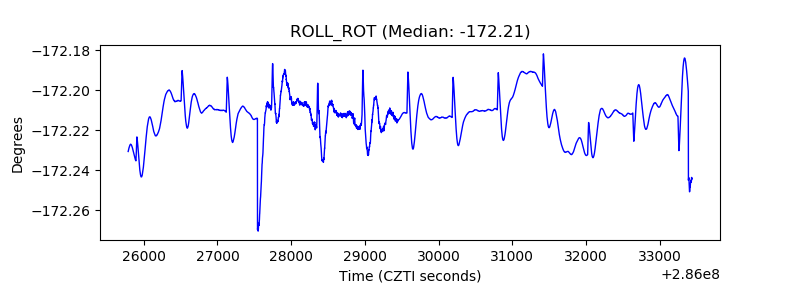 |
| _Roll_DEC | 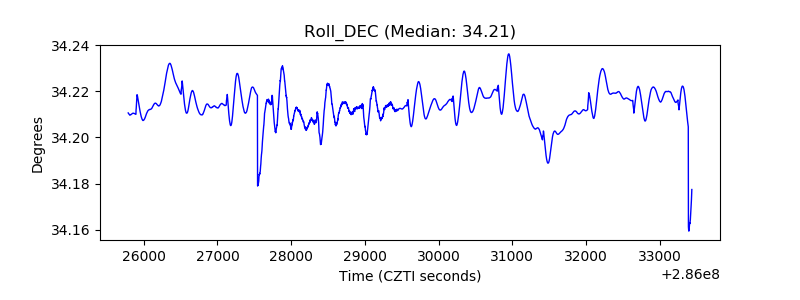 |
| _Roll_RA | 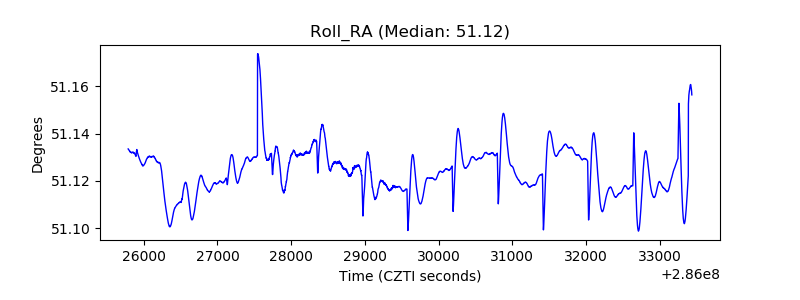 |
| Veto Counter | 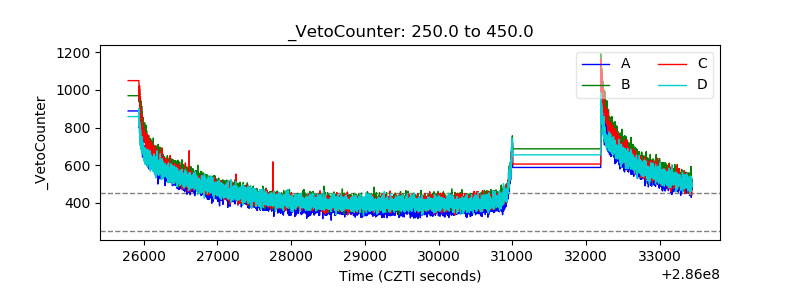 |