| Param | Original file | Final file |
|---|---|---|
| Filename | modeM0/AS1A05_019T01_9000002672_17977cztM0_level2.evt | modeM0/AS1A05_019T01_9000002672_17977cztM0_level2_quad_clean.evt |
| Size (bytes) | 148,426,560 | 42,575,040 |
| Size | 141.6 MB | 40.6 MB |
| Events in quadrant A | 1,071,800 | 296,962 |
| Events in quadrant B | 1,164,171 | 297,647 |
| Events in quadrant C | 999,218 | 277,706 |
| Events in quadrant D | 1,132,164 | 281,997 |
| Mode M0 | |||
|---|---|---|---|
| Quadrant | BADHDUFLAG | Total packets | Discarded packets |
| A | 0 | 4332 | 1 |
| B | 0 | 4680 | 1 |
| C | 0 | 4079 | 1 |
| D | 0 | 4556 | 1 |
| Mode M9 | |||
|---|---|---|---|
| Quadrant | BADHDUFLAG | Total packets | Discarded packets |
| A | 1 | 140611186068752 | 140608639336494 |
| B | 1 | -1 | -1 |
| C | 1 | -1 | -1 |
| D | 1 | -1 | -1 |
| Mode SS | |||
|---|---|---|---|
| Quadrant | BADHDUFLAG | Total packets | Discarded packets |
| A | 0 | 38 | 0 |
| B | 0 | 38 | 0 |
| C | 0 | 38 | 0 |
| D | 0 | 38 | 0 |
| Quadrant | Total seconds | Saturated seconds | Saturation percentage |
|---|---|---|---|
| A | 1840 | 21 | 1.141304% |
| B | 1840 | 26 | 1.413043% |
| C | 1840 | 14 | 0.760870% |
| D | 1840 | 32 | 1.739130% |
Noise dominated data is calculated using 1-second bins in cleaned event files. If a bin has >2000 counts, and if more than 50% of those come from <1% of pixels, then it is considered to be noise-dominated and hence unusable.
| Quadrant | # 1 sec bins | Bins with >0 counts | Bins with >2000 counts | High rate bins dominated by noise | Noise dominated (total time) | Noise dominated (detector-on time) | Marked lightcurve |
|---|---|---|---|---|---|---|---|
| A | 1840 | 1840 | 8 | 8 | 0.43% | 0.43% | 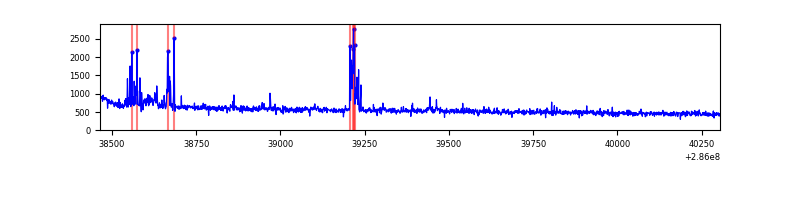 |
| B | 1840 | 1840 | 13 | 13 | 0.71% | 0.71% | 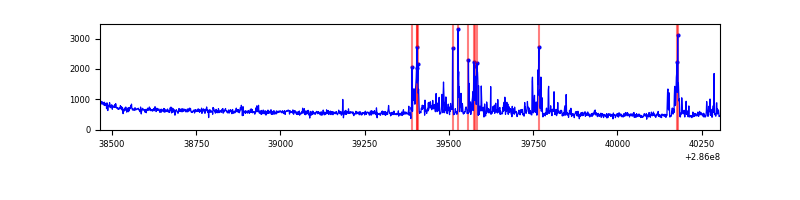 |
| C | 1840 | 1840 | 1 | 1 | 0.05% | 0.05% | 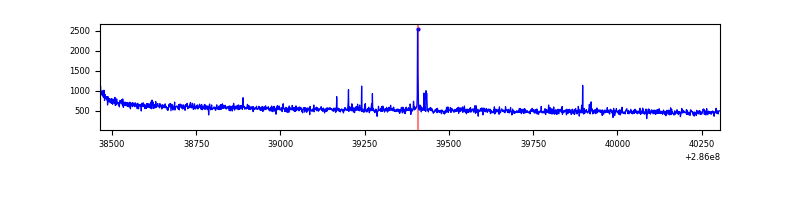 |
| D | 1840 | 1840 | 22 | 22 | 1.20% | 1.20% | 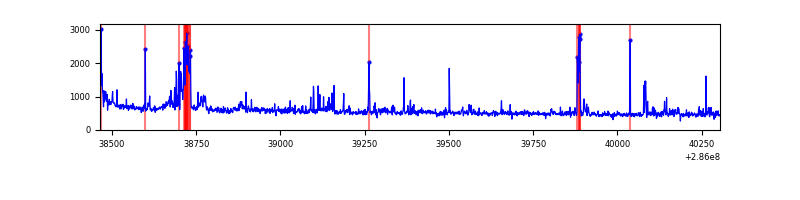 |
Top three noisy pixels from each quadrant. If the there are fewer than three noisy pixels in the level2.evt file, extra rows are filled as -1
| Pixel properties | Quadrant properties | ||||||
|---|---|---|---|---|---|---|---|
| Quadrant | DetID | PixID | Counts | Sigma | Mean | Median | Sigma |
| A | 15 | 174 | 72833 | 1368.78 | 259 | 255 | 53.0 |
| A | 0 | 226 | 2318 | 38.91 | 259 | 255 | 53.0 |
| A | 12 | 194 | 2047 | 33.8 | 259 | 255 | 53.0 |
| B | 7 | 220 | 62599 | 1249.86 | 253 | 248 | 49.9 |
| B | 0 | 182 | 56926 | 1136.14 | 253 | 248 | 49.9 |
| B | 0 | 197 | 41784 | 832.61 | 253 | 248 | 49.9 |
| C | 14 | 238 | 37651 | 662.67 | 239 | 240 | 56.5 |
| C | 3 | 233 | 13369 | 232.56 | 239 | 240 | 56.5 |
| C | 0 | 207 | 12222 | 212.24 | 239 | 240 | 56.5 |
| D | 7 | 238 | 69598 | 1101.1 | 249 | 243 | 63.0 |
| D | 10 | 70 | 28804 | 453.44 | 249 | 243 | 63.0 |
| D | 11 | 176 | 25540 | 401.62 | 249 | 243 | 63.0 |
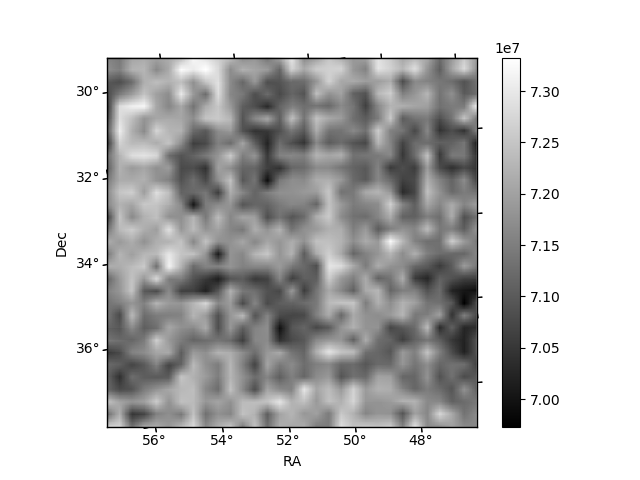
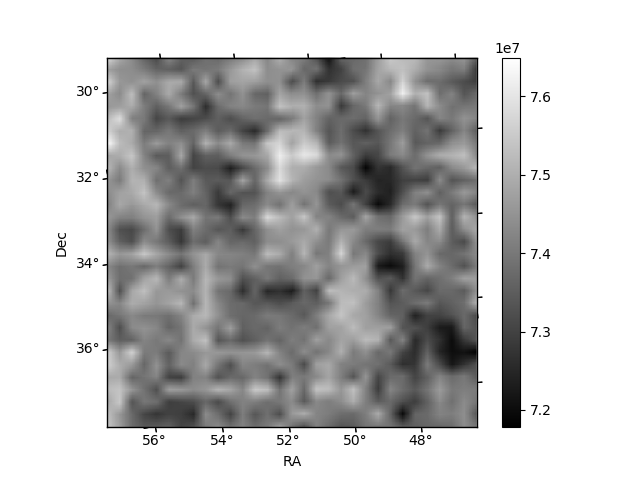
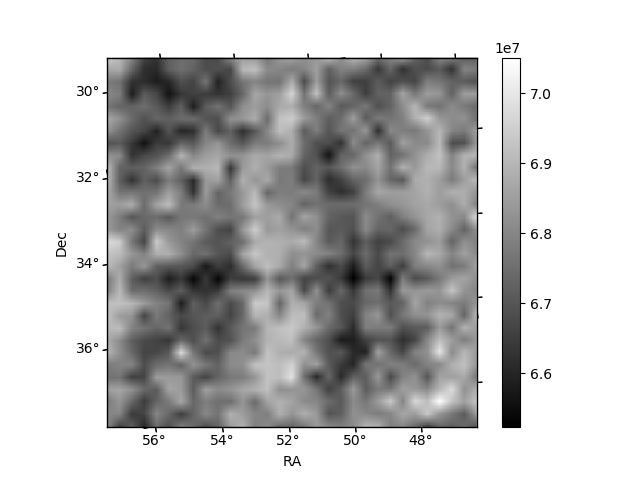
Histogram calculated using DETX and DETY for each event in the final _common_clean file
| Quadrant A | 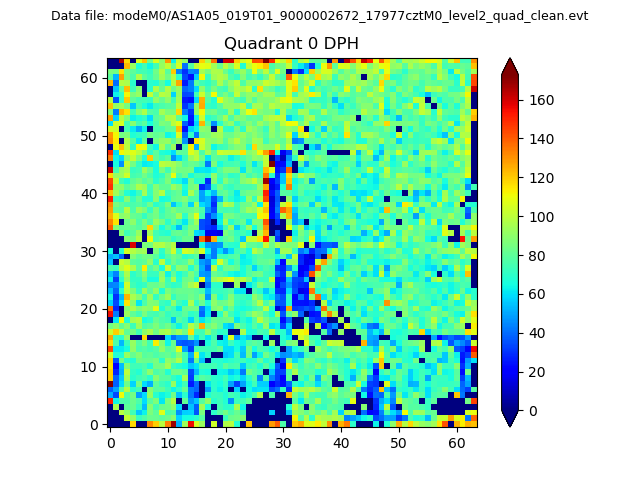 |
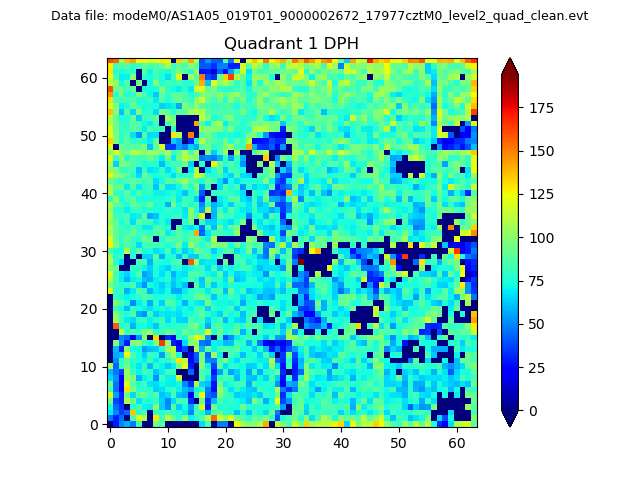 |
Quadrant B |
|---|---|---|---|
| Quadrant D | 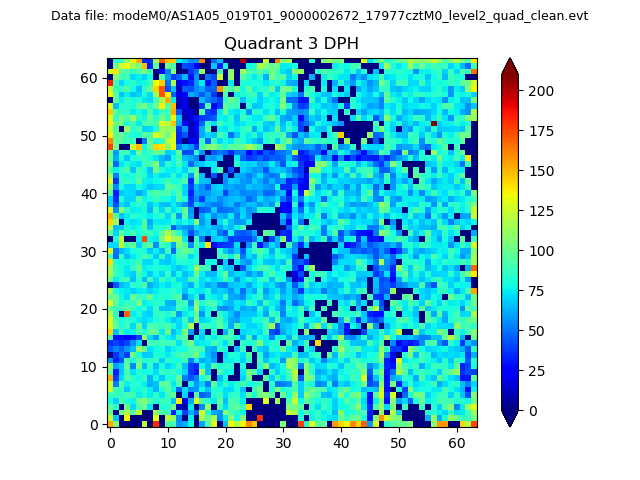 |
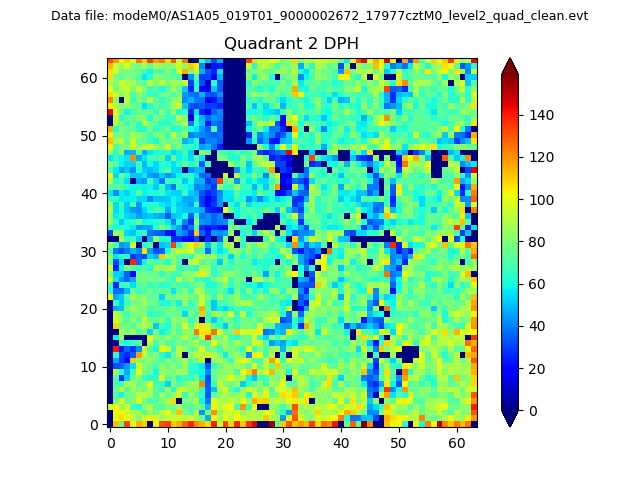 |
Quadrant C |
| Plot type | Count rate plots | Images |
|---|---|---|
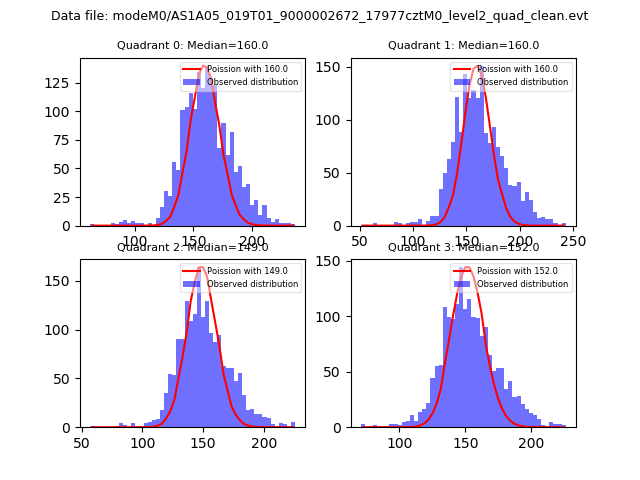
| Comparison with Poisson distribution Blue bars denote a histogram of data divided into 1 sec bins. Red curve is a Poisson curve with rate = median count rate of data. |
 |
 |
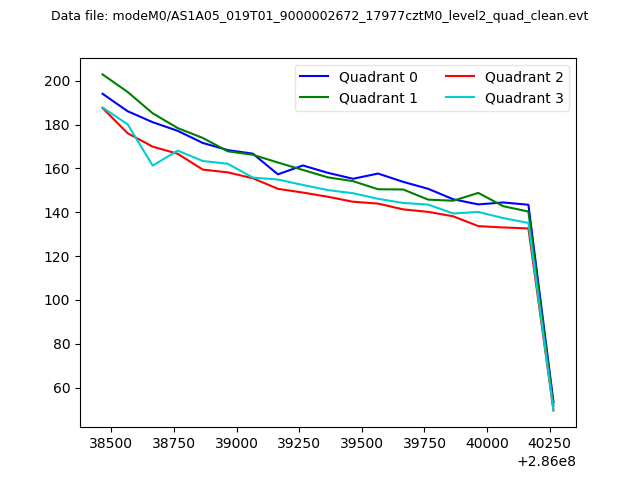
| Quadrant-wise count rates Data is divided into 100 sec bins |
 |
|
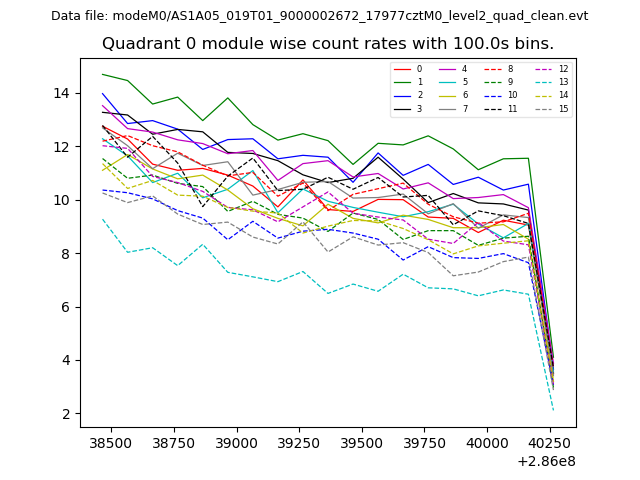
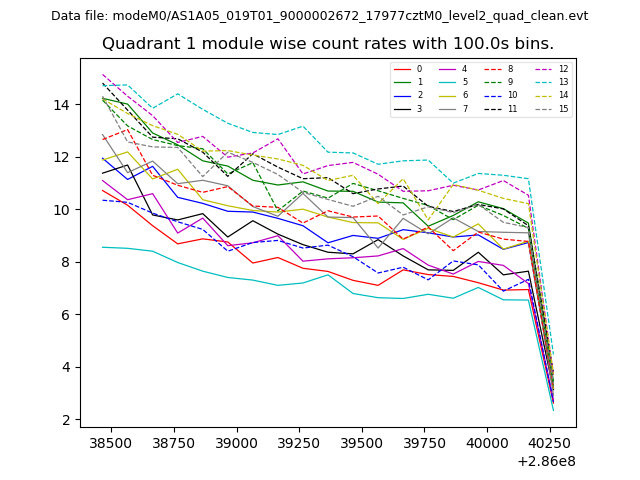
| Module-wise count rates for Quadrant A Data is divided into 100 sec bins |
 |
 |
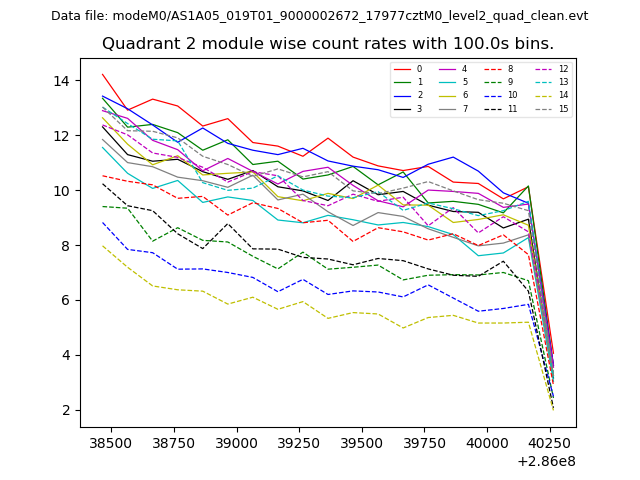
| Module-wise count rates for Quadrant B Data is divided into 100 sec bins |
 |
 |
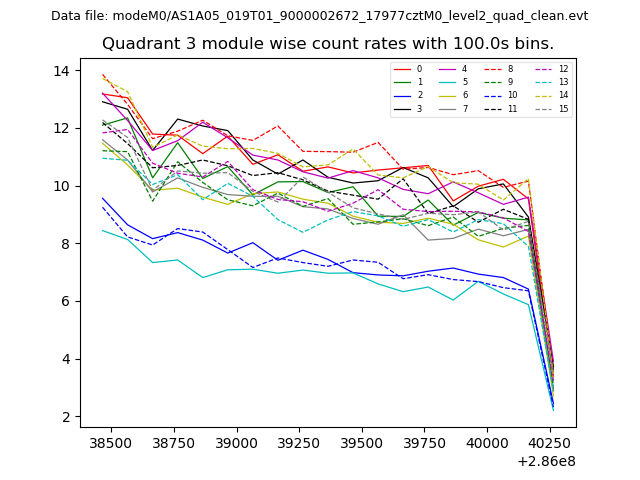
| Module-wise count rates for Quadrant C Data is divided into 100 sec bins |
 |
 |
| Module-wise count rates for Quadrant D Data is divided into 100 sec bins |
 |
 |
| Parameter | Plot |
|---|---|
| CZT HV Monitor | 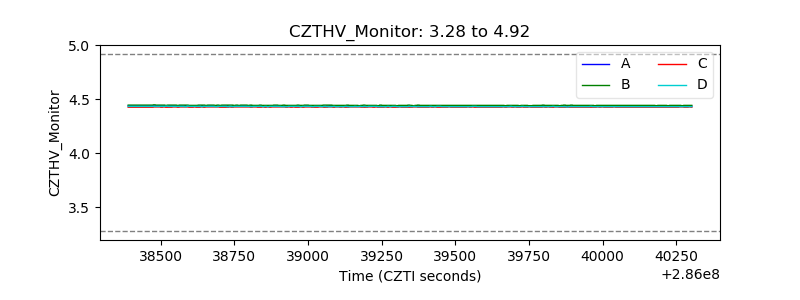 |
| D_VDD | 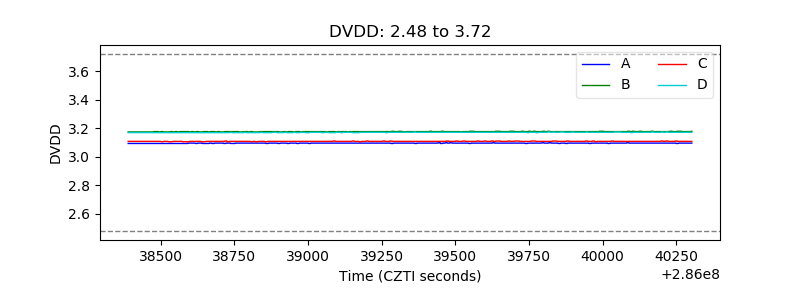 |
| Temperature 1 | 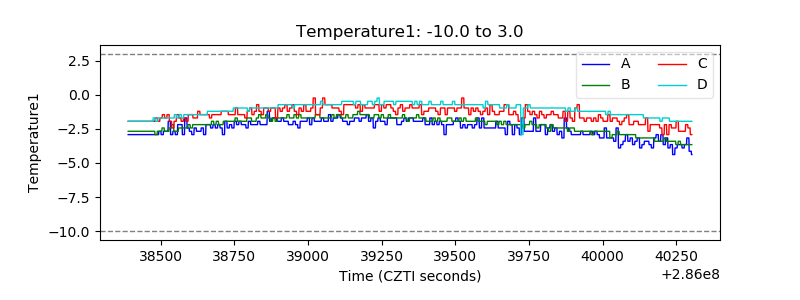 |
| Veto HV Monitor | 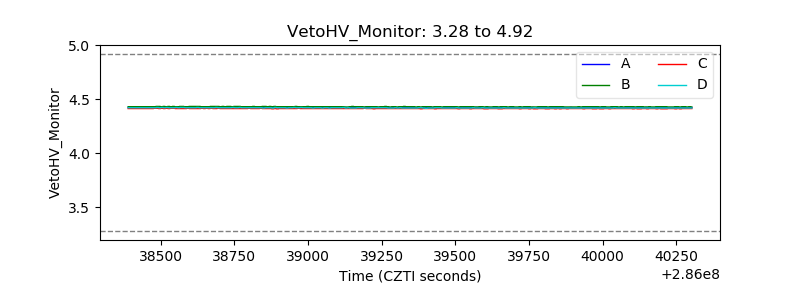 |
| Veto LLD | 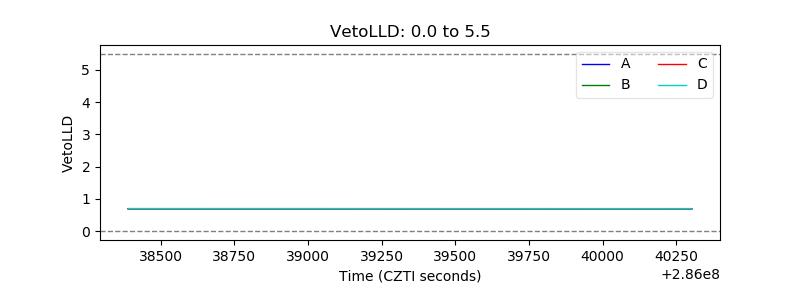 |
| Alpha Counter | 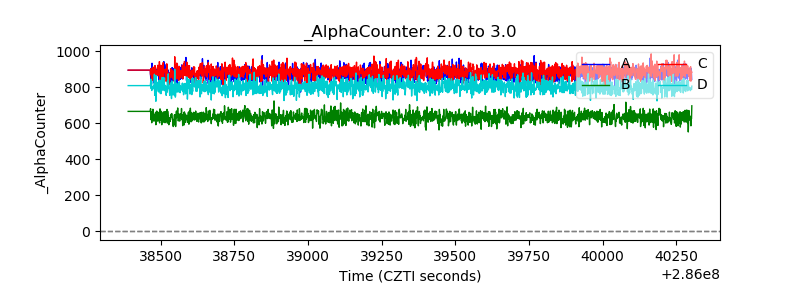 |
| _CPM_Rate | 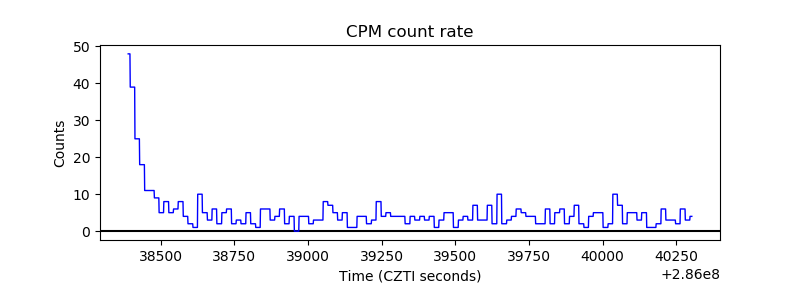 |
| CZT Counter | 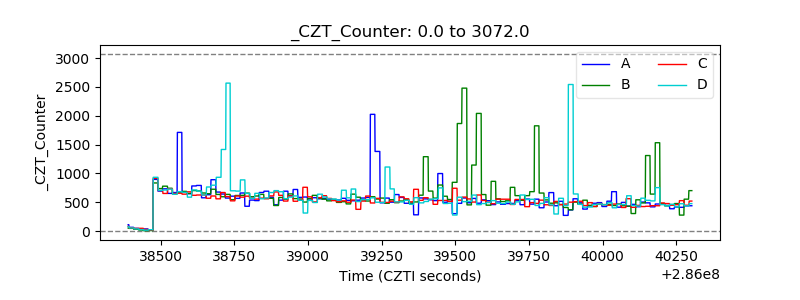 |
| +2.5 Volts monitor |  |
| +5 Volts monitor |  |
| _ROLL_ROT | 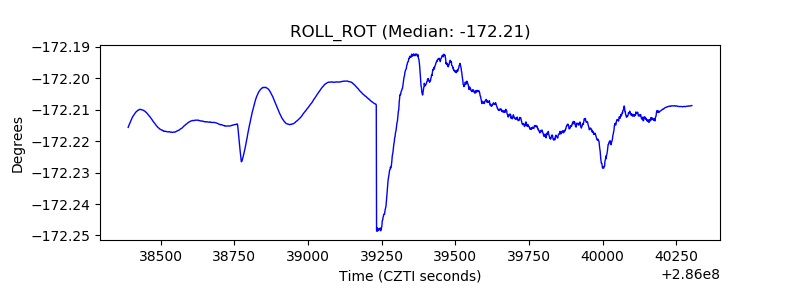 |
| _Roll_DEC | 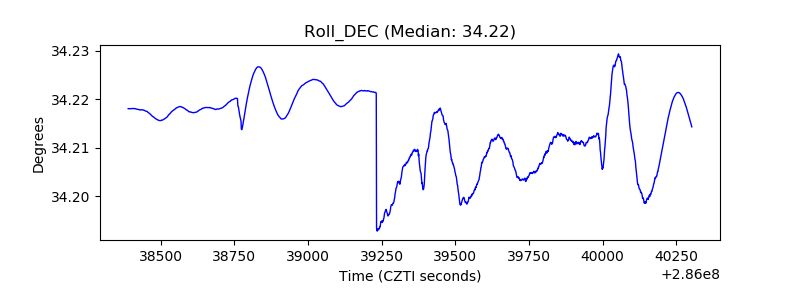 |
| _Roll_RA | 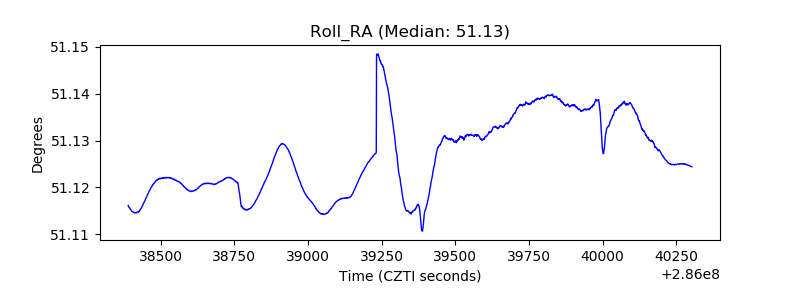 |
| Veto Counter | 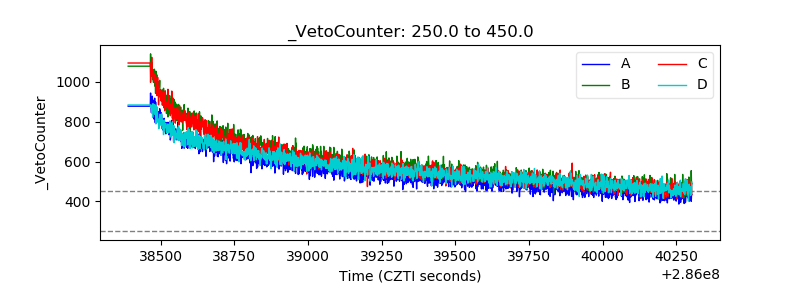 |