| Param | Original file | Final file |
|---|---|---|
| Filename | modeM0/AS1A05_108T02_9000002676_17978cztM0_level2.evt | modeM0/AS1A05_108T02_9000002676_17978cztM0_level2_quad_clean.evt |
| Size (bytes) | 64,218,240 | 7,413,120 |
| Size | 61.2 MB | 7.1 MB |
| Events in quadrant A | 413,819 | 40,956 |
| Events in quadrant B | 413,600 | 41,051 |
| Events in quadrant C | 402,978 | 40,564 |
| Events in quadrant D | 659,346 | 40,472 |
| Mode SS | |||
|---|---|---|---|
| Quadrant | BADHDUFLAG | Total packets | Discarded packets |
| A | 0 | 16 | 0 |
| B | 0 | 16 | 0 |
| C | 0 | 16 | 0 |
| D | 0 | 16 | 0 |
| Mode M0 | |||
|---|---|---|---|
| Quadrant | BADHDUFLAG | Total packets | Discarded packets |
| A | 0 | 1657 | 0 |
| B | 0 | 1634 | 0 |
| C | 0 | 1596 | 0 |
| D | 0 | 2417 | 0 |
| Quadrant | Total seconds | Saturated seconds | Saturation percentage |
|---|---|---|---|
| A | 760 | 7 | 0.921053% |
| B | 760 | 7 | 0.921053% |
| C | 760 | 4 | 0.526316% |
| D | 760 | 126 | 16.578947% |
Noise dominated data is calculated using 1-second bins in cleaned event files. If a bin has >2000 counts, and if more than 50% of those come from <1% of pixels, then it is considered to be noise-dominated and hence unusable.
| Quadrant | # 1 sec bins | Bins with >0 counts | Bins with >2000 counts | High rate bins dominated by noise | Noise dominated (total time) | Noise dominated (detector-on time) | Marked lightcurve |
|---|---|---|---|---|---|---|---|
| A | 760 | 760 | 3 | 3 | 0.39% | 0.39% | 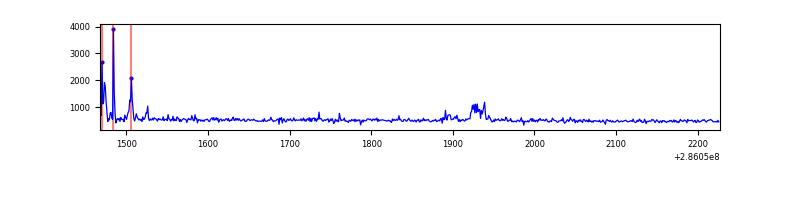 |
| B | 760 | 760 | 3 | 3 | 0.39% | 0.39% | 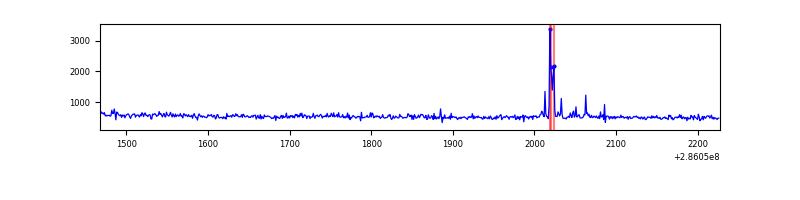 |
| C | 760 | 760 | 0 | 0 | 0.00% | 0.00% | 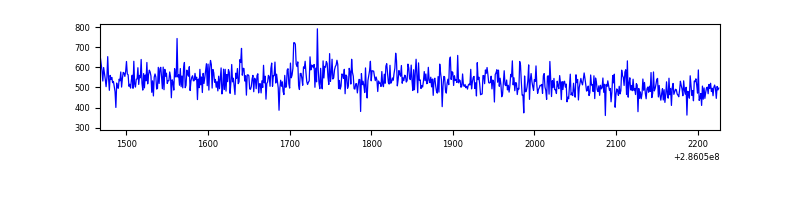 |
| D | 760 | 760 | 84 | 84 | 11.05% | 11.05% | 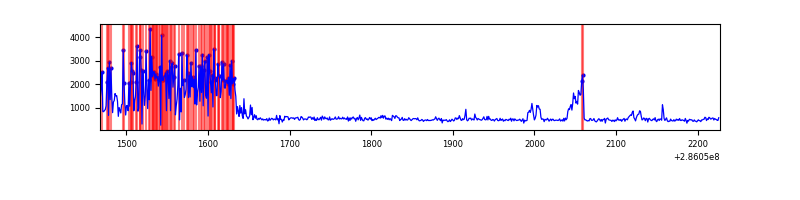 |
Top three noisy pixels from each quadrant. If the there are fewer than three noisy pixels in the level2.evt file, extra rows are filled as -1
| Pixel properties | Quadrant properties | ||||||
|---|---|---|---|---|---|---|---|
| Quadrant | DetID | PixID | Counts | Sigma | Mean | Median | Sigma |
| A | 14 | 237 | 37623 | 1706.75 | 97 | 95 | 22.0 |
| A | 0 | 226 | 899 | 36.57 | 97 | 95 | 22.0 |
| A | 12 | 194 | 773 | 30.83 | 97 | 95 | 22.0 |
| B | 7 | 220 | 14235 | 676.89 | 98 | 96 | 20.9 |
| B | 4 | 216 | 6287 | 296.39 | 98 | 96 | 20.9 |
| B | 3 | 209 | 2158 | 98.72 | 98 | 96 | 20.9 |
| C | 3 | 233 | 16736 | 694.71 | 94 | 95 | 24.0 |
| C | 14 | 238 | 15042 | 623.99 | 94 | 95 | 24.0 |
| C | 1 | 16 | 930 | 34.86 | 94 | 95 | 24.0 |
| D | 7 | 238 | 292727 | 12436.97 | 88 | 86 | 23.5 |
| D | 12 | 233 | 9975 | 420.27 | 88 | 86 | 23.5 |
| D | 5 | 222 | 8756 | 368.47 | 88 | 86 | 23.5 |
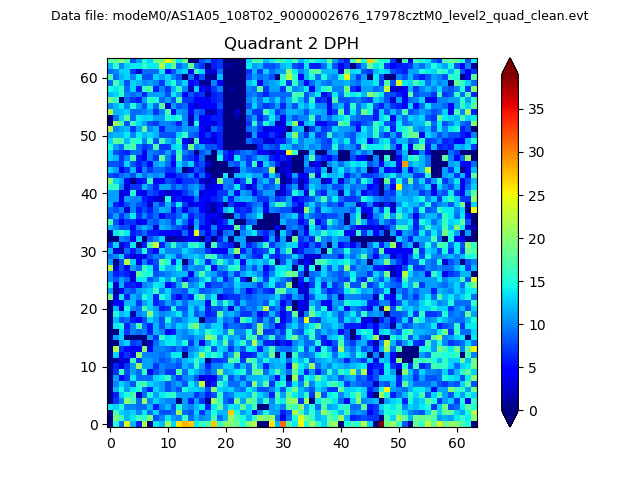
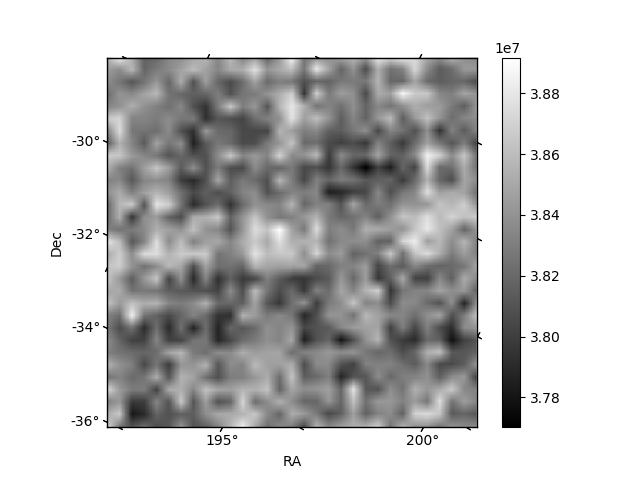
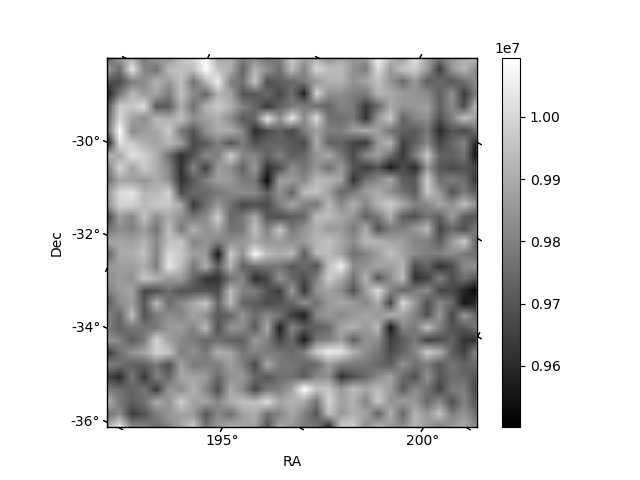
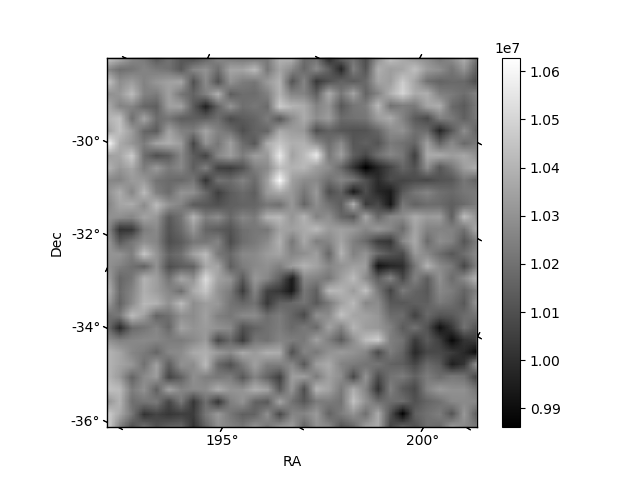
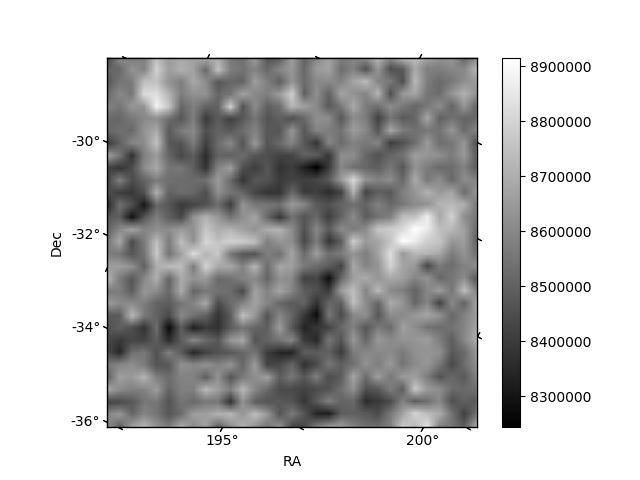
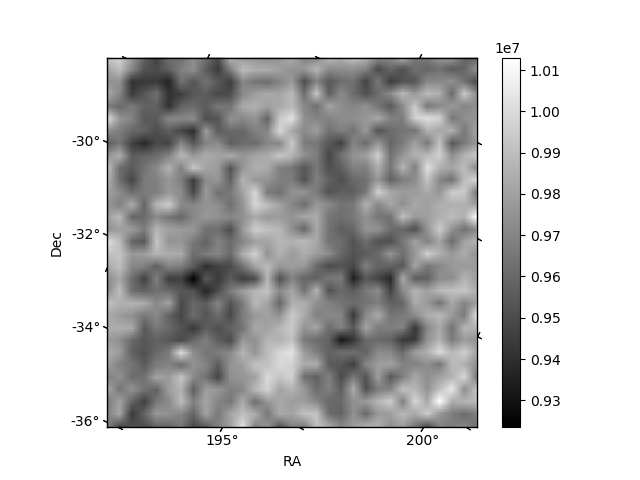
Histogram calculated using DETX and DETY for each event in the final _common_clean file
| Quadrant A | 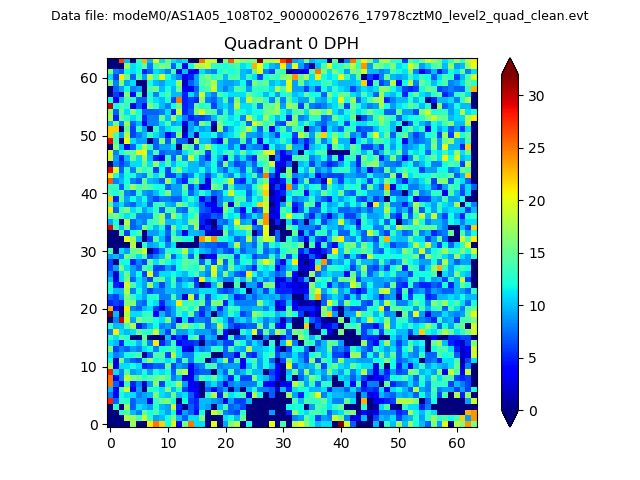 |
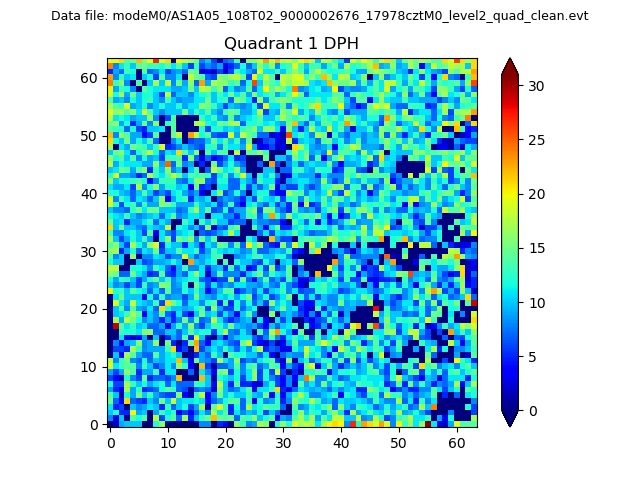 |
Quadrant B |
|---|---|---|---|
| Quadrant D | 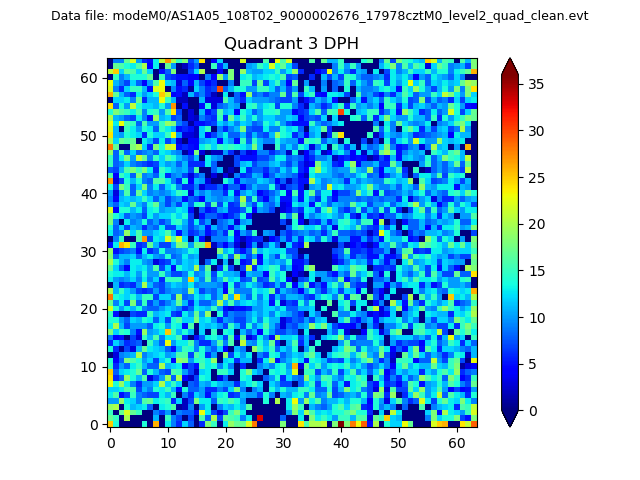 |
 |
Quadrant C |
| Plot type | Count rate plots | Images |
|---|---|---|
| Comparison with Poisson distribution Blue bars denote a histogram of data divided into 1 sec bins. Red curve is a Poisson curve with rate = median count rate of data. |
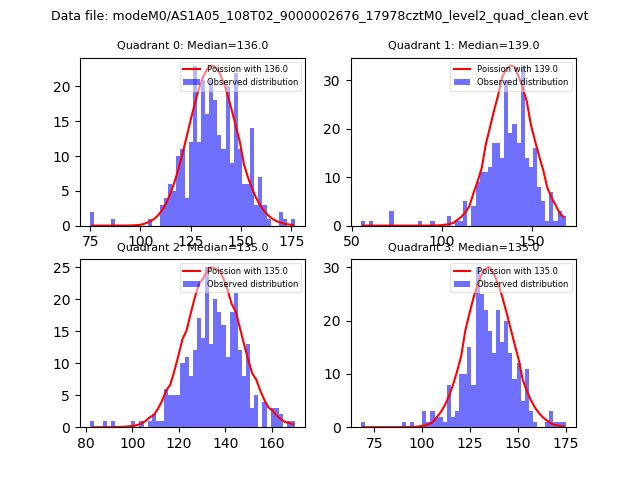 |
 |
| Quadrant-wise count rates Data is divided into 100 sec bins |
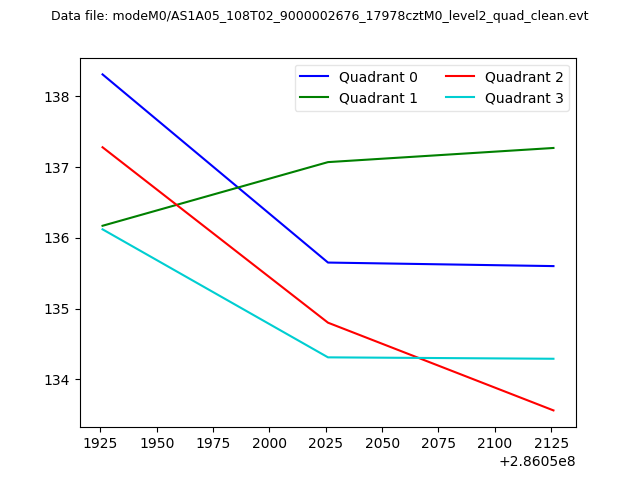 |
|
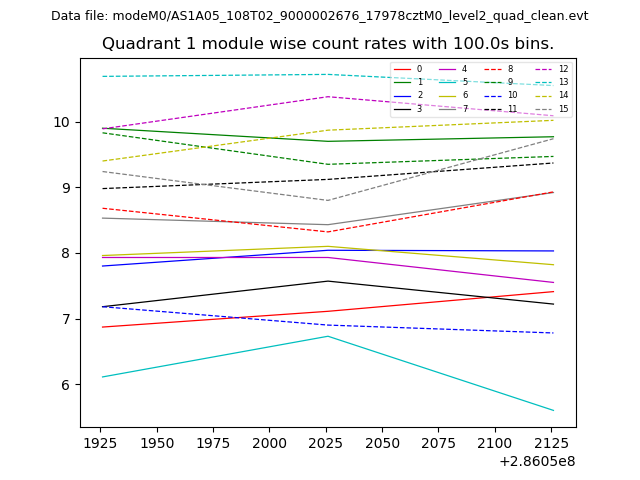
| Module-wise count rates for Quadrant A Data is divided into 100 sec bins |
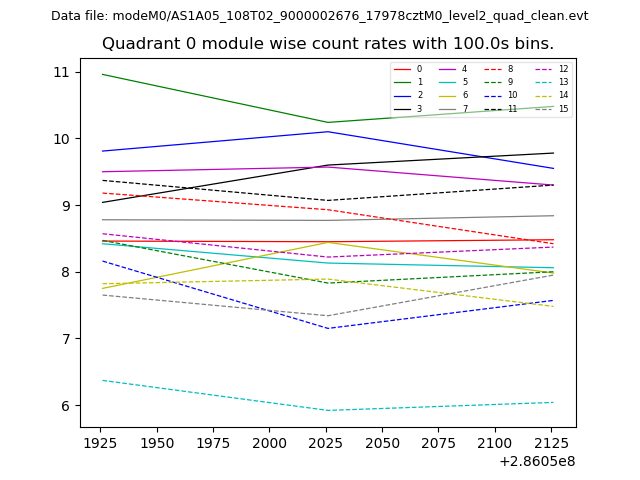 |
 |
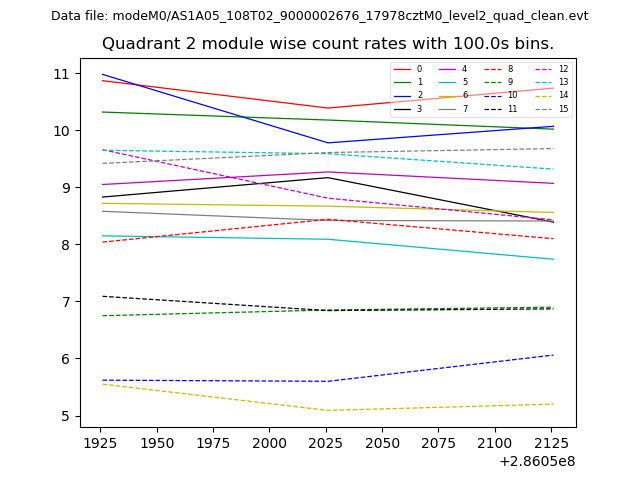
| Module-wise count rates for Quadrant B Data is divided into 100 sec bins |
 |
 |
| Module-wise count rates for Quadrant C Data is divided into 100 sec bins |
 |
 |
| Module-wise count rates for Quadrant D Data is divided into 100 sec bins |
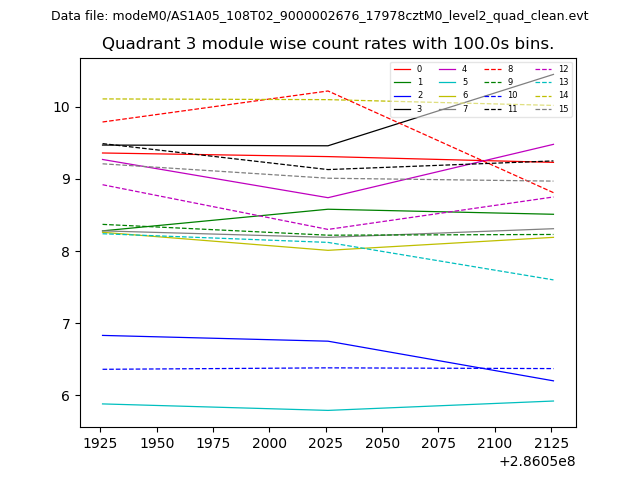 |
 |
| Parameter | Plot |
|---|---|
| CZT HV Monitor | 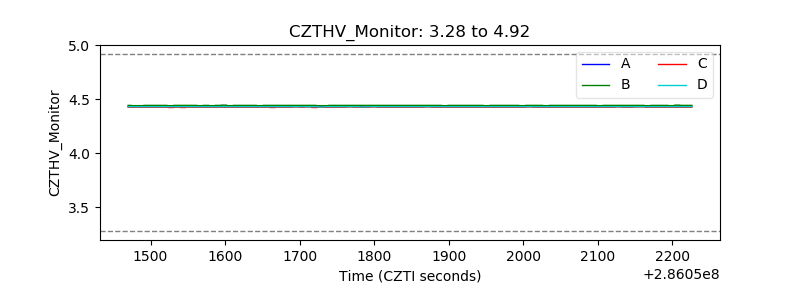 |
| D_VDD | 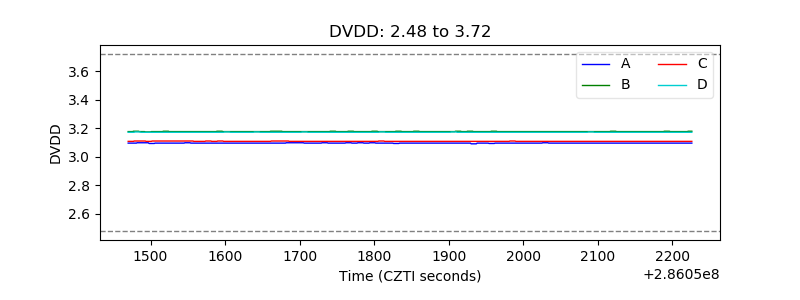 |
| Temperature 1 | 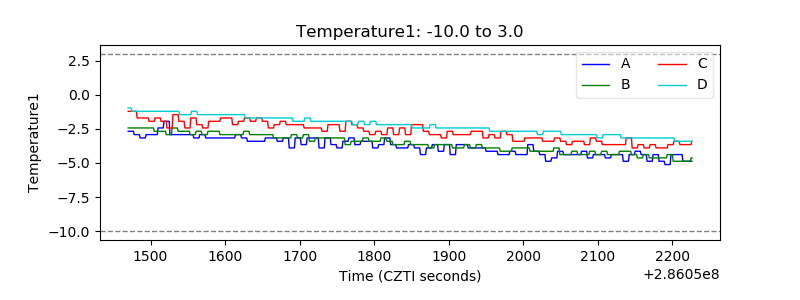 |
| Veto HV Monitor | 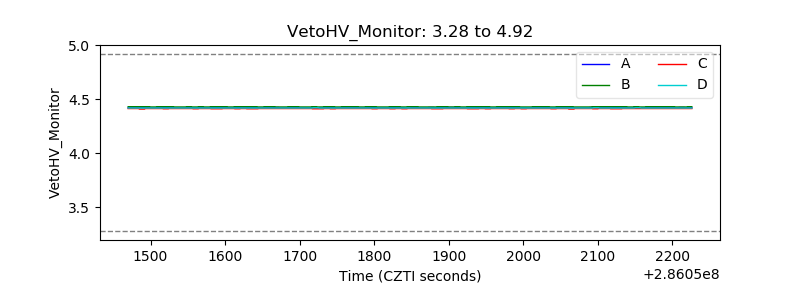 |
| Veto LLD | 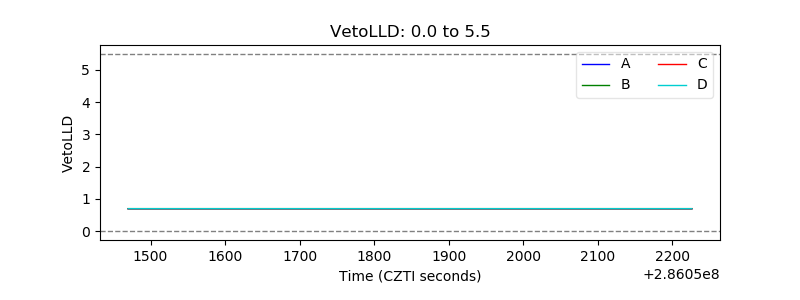 |
| Alpha Counter | 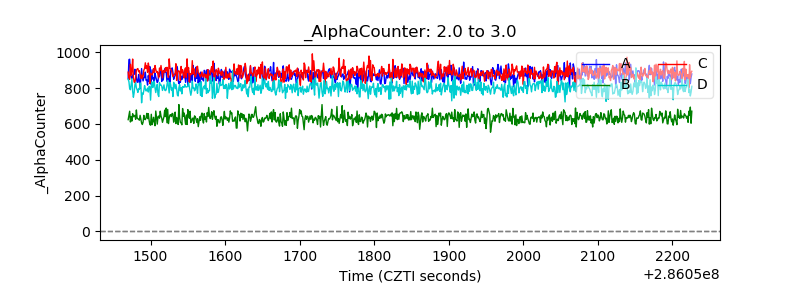 |
| _CPM_Rate | 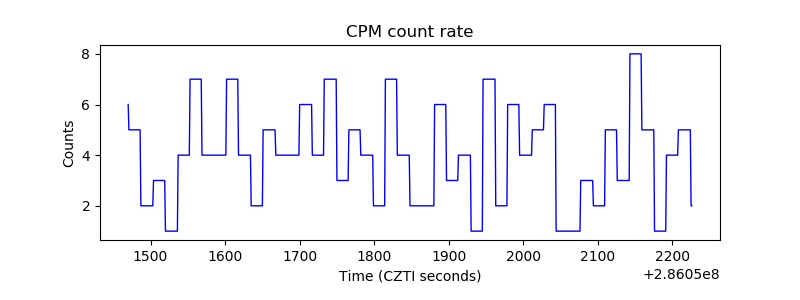 |
| CZT Counter | 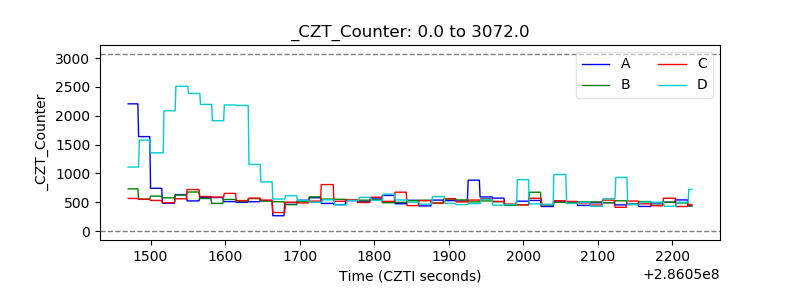 |
| +2.5 Volts monitor |  |
| +5 Volts monitor | 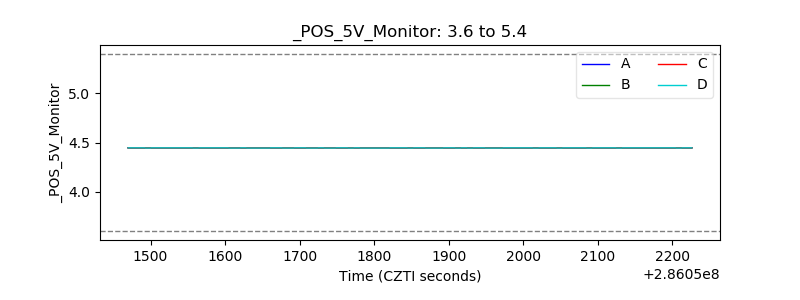 |
| _ROLL_ROT | 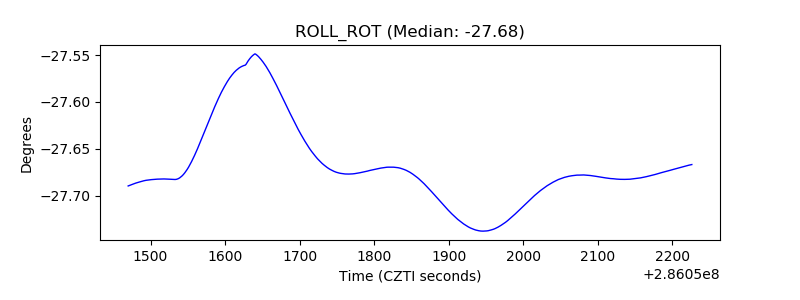 |
| _Roll_DEC | 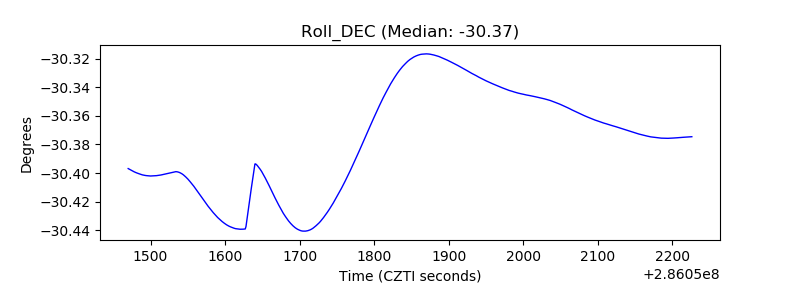 |
| _Roll_RA | 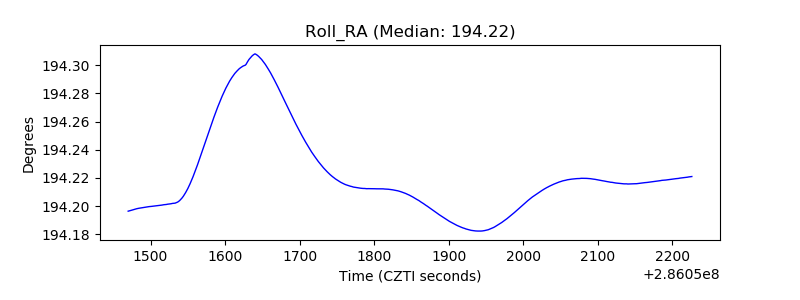 |
| Veto Counter | 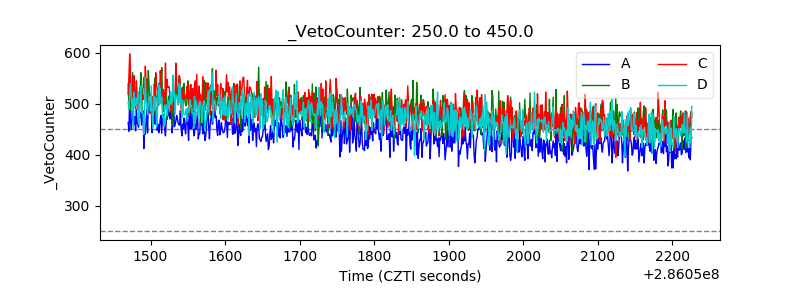 |